Product on Demand-Automating Cartographic Production - An ESRI White Paper July 2009
←
→
Page content transcription
If your browser does not render page correctly, please read the page content below
An ESRI ® White Paper • July 2009

      Product on Demand—
Automating Cartographic Production

                 ESRI 380 New York St., Redlands, CA 92373-8100 USA
   TEL 909-793-2853 • FAX 909-793-5953 • E-MAIL info@esri.com • WEB www.esri.com
Copyright © 2009 ESRI
All rights reserved.
Printed in the United States of America.

The information contained in this document is the exclusive property of ESRI. This work is protected under United States
copyright law and other international copyright treaties and conventions. No part of this work may be reproduced or
transmitted in any form or by any means, electronic or mechanical, including photocopying and recording, or by any
information storage or retrieval system, except as expressly permitted in writing by ESRI. All requests should be sent to
Attention: Contracts and Legal Services Manager, ESRI, 380 New York Street, Redlands, CA 92373-8100 USA.

The information contained in this document is subject to change without notice.

ESRI, the ESRI globe logo, ArcGIS, ArcIMS, PLTS, ArcMap, ArcSDE, ArcInfo, www.esri.com, and @esri.com are
trademarks, registered trademarks, or service marks of ESRI in the United States, the European Community, or certain other
jurisdictions. Other companies and products mentioned herein may be trademarks or registered trademarks of their respective
trademark owners.
J-9801

         Product on Demand—Automating
         Cartographic Production
         An ESRI White Paper

         Contents                                                                                              Page

         Introduction...........................................................................................    1

         Case Studies .......................................................................................... 1
            National Geospatial-Intelligence Agency—Enterprise Product
             on Demand Service ....................................................................... 1
            USDA Forest Service—FSTopo..................................................... 3
            Government of the Hong Kong Special Administrative Region,
             Lands Department—Geographic Information Retrieval
             System 2........................................................................................ 4

         Key Benefits of POD ............................................................................          5

         System Architecture..............................................................................         6
            Web Components............................................................................             8
            ArcGIS Server.................................................................................         8
            ArcSDE ...........................................................................................     9
            Specific Technologies Used for NGA ePODS ...............................                               9

         Steps for Implementation......................................................................            10
            Customization .................................................................................        10
                Map Templates and Business Logic .........................................                         10
                Connecting to the Datasets........................................................                 11
                Setting Up a Web Page .............................................................                11
            Deployment.....................................................................................        12

         ESRI White Paper                                                                                               i
J-9801
Product on Demand—Automating
Cartographic Production
Introduction Traditionally, the creation of high-quality, high-volume cartographic
products is a hands-on, time-intensive process. The Product on Demand
(POD) application brings high-end cartography to the server, introducing
on-the-fly map and chart generation over the Web. This white paper will
outline benefits, system architecture, and implementation considerations
for POD, as well as provide case studies of several POD projects.
Map and chart production organizations face the issue of meeting a high demand for up-
to-date products at a reduced cost. Today's proliferation of online mapping services may
solve this challenge for readily available city, street, and other common types of map
content, but for customers and products demanding higher-end cartography rich with
information, these services typically do not meet expectations. POD provides customers
with online mapping services they've experienced elsewhere, combined with the high-end
quality and detail they've come to expect from cartographic products created using
traditional interactive methods. The modern demand for easily accessible, quality
products and their customization is the driving factor behind POD technology.
Case Studies
National Geospatial- Highlights
Intelligence
Agency—Enterprise Provided the SS CURTISS, a marine aviation maintenance logistics ship, with an
Product on Demand updated harbor chart within five days of receiving surveyed data
Service
Realized 50 percent time savings when creating updated nautical charts necessary for
the Georgia-Russia crisis
Allows NGA to provide the most accurate data possible to support its customers'
needs
The National Geospatial-Intelligence Agency (NGA) is a U.S. Department of Defense
combat support agency and a member of the national intelligence community. Its primary
mission is to provide geospatial intelligence (GEOINT) to U.S. Armed Forces and
government agencies in support of U.S. national security, as well as aeronautical and
nautical safety of navigation to a variety of users.
To better provide its users with access to timely, accurate, and relevant geospatial
intelligence, NGA contracted with ESRI Professional Services in 2004 for a new
initiative now known as Enterprise Product on Demand Services (ePODS). One of the
main goals of this project was to automate map and chart creation to gain efficiency and
reduce errors. In addition, NGA sought to permit access to the most current NGA
aeronautical, nautical, and topographic data for selected customers. The ability to design
and print custom maps was also high on the list of desired functionality.
ESRI White PaperProduct on Demand—Automating Cartographic Production
J-9801
A Web portal that gives select users access to the system from specific NGA networks,
ePODS is built on service-oriented architecture (SOA) using ESRI's ArcGIS® family of
products. ArcGIS Server and ArcIMS® provide geographic information system (GIS)
Web services and portal functionality, respectively. Production Line Tool Sets (PLTS™)
for ArcGIS provides a robust final touchup or finishing environment for aeronautical,
nautical, and topographic maps and charts that NGA chooses to edit prior to publication.
Using the Web interface, users select the data they need; configure it into a map; apply
specific cartographic rules; preview the end product; and either print it or download a
source package that includes data, instructions, and media to work locally on the maps for
further refinement. The ePODS application produces output in several formats including
PDF, GeoTIFF, JPEG, CADRG, and geodatabase/ArcMap™ document (MXD)
downloads.
Continuing to mature and offer more products to NGA's user community, in April 2007,
the ePODS program moved from being a prototype program to an official program of
record at NGA. This status provides funding through fiscal year 2015 and the opportunity
to become part of NGA's life cycle processes. While ePODS maritime production has
been ongoing since 2007, it recently passed NGA's Operational Readiness Review
(ORR)/Operational Acceptance Review (OAR). This milestone was the final step in
NGA's acceptance process and determined that the maritime service can be officially
considered operational by NGA. Future services to undergo an ORR/OAR include
Topographic Line Maps (TLM) in summer 2009 and Tactical Pilotage Charts (TPC) and
Operational Area (OPAREA) charts in winter 2009. Additional map and chart types will
continue to be added through 2011.
The first iteration of the ePODS system went into production in September 2007 and
provided immediate benefits. One example involved the SS CURTISS, one of the United
States' Military Sealift Command's two aviation maintenance logistics ships. While under
way to an overseas port, the crew recognized a need for an updated harbor chart for their
destination. They notified the Naval Oceanographic Office, which dispatched a survey
team to collect new data for the destination port and forwarded that data to NGA. Once
received, a combined team from NGA and ESRI accessed the data with ePODS and
produced an updated harbor chart in only two days. This updated chart was sent to the
SS CURTISS within five days of receiving the data and was used by the ship to safely sail
into the harbor. Using traditional production methods, this same chart would typically
take six to eight weeks to reach operational users.
In summer 2008, NGA was faced with another operational challenge—how to rapidly
produce up-to-date nautical charts for the U.S. Navy and Coast Guard to use while
supporting the Georgia-Russia crisis. Once again, NGA turned to ePODS and was able to
produce six nautical charts of varying scales and rapidly disseminate them to operational
users at sea. In the end, NGA realized an approximate 50 percent time savings over
legacy production methods during this crisis.
The ePODS system will continue to allow NGA to change its focus from producing
cartographic products to providing the most accurate data possible to support its
customers' needs. With the help of ePODS, NGA has significantly reduced the time
required to produce maps and charts. For some maps and charts, production time has
dropped from hundreds of hours to less than one.
July 2009 2Product on Demand—Automating Cartographic Production
J-9801
NGA further increased its efficiency by using ePODS to determine on a case-by-case
basis how much production time to spend on a product based on the intended use of the
product, eliminating the need to spend hundreds of hours finishing a one-off product that
will only be used for quick analysis.
The system allows NGA to focus more of its resources on data quality, integrity, and
currency rather than cartographic product generation. With ePODS, NGA is able to
provide its customers with timely access to relevant and accurate GEOINT data. Safety of
navigation is also significantly improved for both military personnel and civilians with
the improvements in accuracy and timeliness of aeronautical and nautical charts.
USDA Forest The United States Department of Agriculture (USDA) Forest Service (USFS) is
Service—FSTopo responsible for managing all national forests owned by the federal government. One of
its responsibilities is to supply agency resource managers and the public with
basemapping products over the USFS' area of interest. These cartographic products
include the 1:24,000 and 1:63,360 (in Alaska) topographic maps. USFS shares this
duty of mapping the country with the United States Geologic Survey (USGS). USFS'
portfolio consists of approximately 10,600 of these 7.5-minute quadrangles (the extent
varies in Alaska) over the national forests. Like many federal mapping agencies, USFS
wanted to improve map revision and production efficiency. ESRI, based on its success
with helping NGA implement the ePODS system, worked closely with USFS to
implement a similar system—FSTopo—tailored to its large-scale products and associated
workflows.
Previously, basemap cartographic data was managed in ArcSDE® (where edits were
performed in checked-out ArcInfo® coverages. To take full advantage of ArcGIS server
abilities, a project was implemented to enable editing in a seamless enterprise
geodatabase. The new geodatabase model would ensure that data could be maintained
more effectively while enabling required production capability. The model was
constructed as a cartographic database, meaning it would be used directly to make high-
end cartographic products with limited processing on the server. However, before the
maps were made directly from the geodatabase, cartographic editing would ensure that
required cartographic standards were upheld. This included topologically correct data
from vectors originally collected on a CAD system. Data topology enabled symbolization
and automated product generation. The legacy coverage annotation was translated into
geodatabase annotation to meet product specifications involving text placement. Due to
the relatively large scale of the maps, the contour data was quite extensive. To ensure that
performance was maximized, ArcSDE best practices regarding spatial indexing were
implemented.
Once the database model was populated with the required data, a map template document
was constructed. The document comprised both static and dynamic surround elements.
Two custom dynamic elements were created: the declination diagram and the adjoining
sheet diagram. Due to the new ability for users via POD to create custom maps that cross
traditional boundaries, the adjoining sheet diagram was required to show the extent of the
current map as it related to existing map sheets. The declination diagram, which shows
the relationship between magnetic and true north, was programmed to be sure it would
update based on any location across the United States chosen by a user. Both these
elements were developed to allow deployment on ArcGIS Server or ArcGIS Desktop,
enabling USFS to use the elements in either environment.
ESRI White Paper 3Product on Demand—Automating Cartographic Production
J-9801
Once the data and map templates were configured, the project switched its focus to the
server architecture and deployment. The site is hosted externally via a third-party
commercial company to ensure around-the-clock support, maintenance, and performance.
FSTopo's system architecture consists of four physical servers and three virtual servers.
One of the physical servers is the data server, running ArcSDE® and Oracle. The three
remaining servers house the three virtual servers, which are used to load balance the map
requests. The virtual servers provide an ArcIMS front end that receives the map request
from the client, depending on which server is free. The request is then passed to one of
the remaining three physical servers, which are running ArcGIS Server. Again, to ensure
maximized load balancing, the request is passed to the server not currently being used.
This is where the map is created with the most current data, exported to PDF format, and
sent back to the client.
FSTopo has improved map production efficiency. The cost and overhead of film-based
map production has been eliminated. The site produces approximately 30 maps a day,
with access limited to USFS only; however, public access is planned. Other plans include
extending the delivery formats to include GeoTIFFs, vectors, and text.
Government of the The Lands Department is the government department responsible for the administration
Hong Kong Special of all land within the Hong Kong Special Administrative Region. Some of its main
Administrative functions include land disposal for development purposes, valuation of land, acquisition
Region, Lands of private land for public projects, land lease control and enforcement, maintenance of
Department— the geodetic control network, land boundary surveys, aerial surveys, and map
Geographic production. The Lands Department comprises a number of district offices throughout
Information Hong Kong. It is vital to have a simple-to-use system that allows all staff to access the
Retrieval System 2 topographic maps and land record information via a thin Internet client. The
Geographic Information Retrieval System 2 (GIRS2) is the next-generation application
designed to allow Lands Department staff to continue to easily access the information
and produce standard maps and other types of reports for land administration purposes
using POD technology.
The system is required to be flexible and configurable to support the functions and
responsibilities of the different offices within Lands Department; however, constraints
and standards must also be enforced. These constraints and standards relate not only to
the maps and plans themselves but also users' access to the different datasets for display
within the maps. The initial rollout of the map production portion of the GIRS2
application will consist of seven unique plan types—within a single plan type, the styles
vary greatly. The plans and styles change with respect to page size, scale, geographic
extent, data content, and marginal and note information. Authorized Lands Department
staff are provided with access to change any or all of these parameters on each type of
plan. Configuring the map templates for such a dynamic system involves a significant
amount of planning intelligence from the system.
GIRS2, once completed, will leverage the latest Web-based server technologies,
providing a modern user experience customized using Adobe's Flex technology. ESRI's
ArcGIS Server technology allows the deployment of a Web-based GIS solution to a
workforce of approximately 500 users and provides map content over the Web.
July 2009 4Product on Demand—Automating Cartographic Production
J-9801
Key Benefits of POD POD allows an agency to streamline and automate its production workflows, allowing
quickly produced, cartographically refined products using the most up-to-date data from
the available data stores. Reducing the time needed to create cartographic products allows
analysts to focus more on updating and performing quality control on the data. When a
data change is made in the central database, any chart downloaded from the POD system
will reflect that change. The up-to-date information is made immediately available to any
user that connects to the system.
The POD service is a Web service, so anyone connected to the network can access POD
by using a Web browser. If published to the World Wide Web, the POD service is
available to anyone with an Internet connection. The Web site interface is customizable
based on need and purpose, and downloadable formats can include (but are not limited
to) JPEG, TIFF, and PDF. Unlike with traditional paper maps, users are not limited to
only predefined extents—custom extents and scale can be made available, allowing
custom map products that meet the direct needs of each specific user.
In addition to map generation, POD users also have the ability to export the data to a
finishing package. The finishing package is a ZIP file containing a geodatabase, related
data, a map document, and any other relevant documents; the contents of the finishing
package are customizable by the organization publishing the service. The user can import
this information into ArcGIS Desktop and perform additional cartographic finishing
operations such as adding more data sources for custom charts; performing analysis; or
building finished products for traditional, color-separated, printed maps.
Workflows for interacting with the POD service are dependent on the needs of the
organization, and the variety of output options already available through POD offers
flexibility. The POD service can be used solely as an internal tool for an organization to
keep up with the demands of the customer. This means that internal analysts will receive
customer requests, generate the product internally, fine-tune the cartography (using the
finishing package option, if it is needed), and send the final product to the customer either
digitally or as a printed output. Another approach is to allow external customers to
connect to the POD service directly and download their desired product on the fly. In this
workflow, depending on what makes sense to the publishing organization, customers may
have the ability to choose their own area of interest, as well as define the page size, select
the specific information they want to see, and select the output type they want. Once all
their options are defined, they just need to click the download button, and a new chart is
created specifically for them.
POD was developed to
Provide users with quality cartographic products via a Web portal.
Generate maps on the fly from the latest data.
Offer an alternative to outdated products.
Provide users with rapid access to custom centered maps.
Accelerate map creation efforts by automating the generation of the base
cartographic products.
ESRI White Paper 5Product on Demand—Automating Cartographic Production
J-9801
Enable the generation of current maps based on demand.
Improve and expand functional capabilities in map creation and dissemination.
Remove or eliminate the need for highly labor-intensive methods of producing
specification maps and products.
Reduce or eliminate the need for manual updates on products.
The benefits of POD include the following:
The ability to focus maintenance efforts on database(s) and still provide products
without expending additional resources
The ability to update older products, making them more timely and accurate
Customer access to the latest high-quality data available
Wider variety of customization and delivery options available to the customer
System Architecture POD is built using ESRI's three-tiered architecture, which is a service-oriented
architecture designed to support enterprise-level implementations. The three tiers of this
architecture are the authoring tier, the serving or publishing tier, and the use or
consumption tier (see figure 1). For the POD-specific application of this architecture, the
authoring tier contains the database-driven cartographic rules, label content, and label
placement. Product logic, permissions, and a connection to the database and product
templates are all established at the server tier. The use tier can include thick-client
software such as ArcGIS Desktop, thin-client software such as a Web browser, or direct
connections such as those from a mobile device.
July 2009 6Product on Demand—Automating Cartographic Production
J-9801
Figure 1
Three-Tiered Architecture
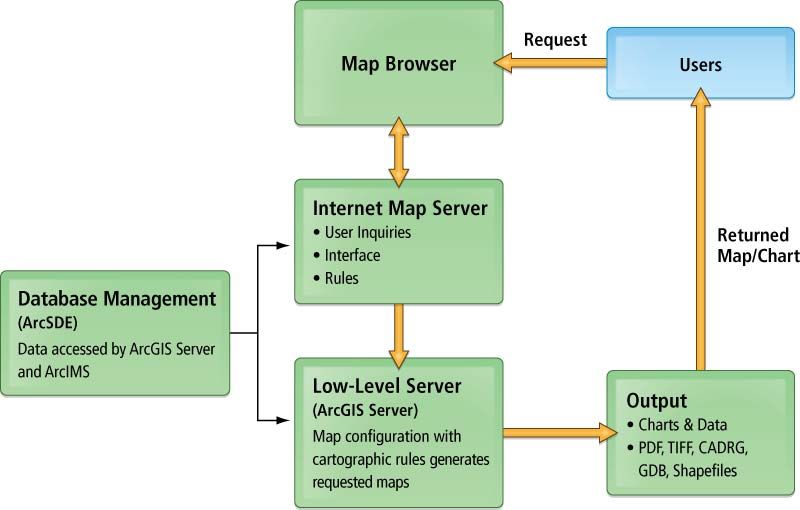
Figure 2 outlines the POD architecture in more detail and shows the relationship between
POD and ArcGIS Server. The yellow boxes represent POD components, and the white
boxes represent unique components to be developed for each POD implementation. The
POD framework is composed of two components that sit on top of ArcGIS Server—the
POD interface and the POD server. POD uses a Simple Object Access Protocol (SOAP)
Web service end point that can be called through other applications. The POD server
contains all the business logic needed for the particular products. The requests from the
POD interface are processed by ArcGIS Server, which calls the project's specific data and
map templates.
ESRI White Paper 7Product on Demand—Automating Cartographic Production
J-9801
Figure 2
Layered Components of POD
Web Components Web server accepts the request from the user.
The request is passed on to the Internet map server.
● The map server finds the requested area of interest (AOI).
♦ The data on the map server viewer is not the same data that will be exported
on the chart.
● The map server takes all the users' inputs and queries and passes them along to
ArcGIS Server to do the heavy lifting.
ArcGIS Server ■ ArcGIS Server handles business logic for a particular product.
● Dynamic surround element updates based on data content
● Projection information updates based on centerpoint of an AOI
● Addition of output formats (e.g., GeoTIFF & CADRG)
July 2009 8Product on Demand—Automating Cartographic Production
J-9801
● Determination of constraints for page size and scale of products
● Back-end processing of data for enhanced cartographic display
● On-the-fly data conversion and loading
● Thinning of hydrographic and transportation network features
ArcSDE ArcSDE is the database access engine to spatial data and its associated attributes.
● Requires a relational database management system (RDBMS)—in this case,
Oracle 10g
Specific There are a variety of ways that POD can be configured. It is primarily composed of
Technologies Used COTS ESRI software and third-party software. COTS ArcGIS Server is available in
for NGA ePODS two base languages—.NET and Java. Either one can be used to create a POD site; the
decision depends on which existing technologies the system may want to leverage and
on the language with which the system needs to be built.
The ePODS application uses a combination of third-party software and COTS ESRI
software. The relationship of these various technologies is illustrated in figure 3.
Figure 3
The ePODS Architecture
Technologies used in ePODS include
Third-party software
● BEA JRockit
● Apache Web Server
● Apache Tomcat Servlet Container
ESRI White Paper 9Product on Demand—Automating Cartographic Production
J-9801
● Oracle 10g
● Internet Explorer
COTS ESRI® software
● ArcGIS Desktop
● ArcGIS Server
● ArcIMS
ePODS specific files
● The ePODS software components are the PodServer, POD Service, and ePODS
Web application.
Steps for The two major steps in implementing a POD system are customization and deployment.
Implementation As mentioned above, there are project-specific components that are unique for each
implementation of POD. The development of these components makes up the
customization step for POD and is the most time-consuming piece to set up. The
customized components fall into three groups: product-specific map templates and
business logic, project-specific datasets, and an entry point such as a Web page.
Customization
Map Templates and For each kind of product that needs to be produced using POD, a template map (or
Business Logic chart) document is created. This document stores the unique details about the map such
as symbolization, surround elements, specific data layers, and spatial information.
Symbolization within the map document defines when to use fonts, shapes, points, lines,
and polygons to represent particular kinds of information displayed within the map itself.
The graphics around the map, or the surround elements, can include things like legends,
scale bars, and north arrows. Surround elements can be set up to be dynamic, meaning
that they can change depending on the part of the world over which the chart is
generated. The layers of data needed for each type of chart are also defined in the
template chart document, as well as spatial information such as scale and projection.
Setting up and refining the template are key to a cartographically mature output.
Sometimes products need special processes to happen on the fly that cannot be set up in
the map document. An example of this is hydro thinning. When NGA's ePODS was set
up, the hydro data, or the records of rivers and streams, was too dense when placed
directly on the chart. The information was not very useful because there were too many
small streams showing up on the page; the output looked like a blue blob rather than lines
representing rivers. The hydro-thinning back-end process introduced a logic that
dynamically thinned out all the smaller streams, leaving just the main bodies of water to
populate on the chart. This allowed NGA to keep its data as it originally existed and
helped produce a cleaner output. Back-end processes like this can support needed
business logic and can extend beyond just data processing.
July 2009 10Product on Demand—Automating Cartographic Production
J-9801
Connecting to the The map template documents are created using the ArcGIS Desktop ArcMap application.
Datasets Within ArcMap, data is added to the document in layers. Each layer represents a
particular data file, such as a feature class, a shapefile, or a raster file. As layers of data
are added in the MXD, the location of the data is stored within that layer. When a new
product is requested from the server, the data is retrieved using this stored location.
Setting Up a Web The POD user interface (usually a Web page) can be set up in any way that best suits the
Page end user. The options are open ended. In the simplest case, the front end can be a direct
connection from another application designed to ingest the available POD products. In
another simple case, the front-end Web application can allow the user only the choice of
AOI and product type. The NGA ePODS Web application is the most robust front end
developed yet for POD, so it's a nice example to illustrate all the possible options for the
Web application. Options for a POD front end are not limited to the ePODS list of
functionality.
Figure 4
The ePODS Web Application
ESRI White Paper 11Product on Demand—Automating Cartographic Production
J-9801
A summary of options in the ePODS front end are outlined in figure 4. This Web page
provides the user with a variety of options for product search and download. The user has
the ability to search by tile number, coordinate entry, country, and industry-specific codes
such as special use airspaces (SUAs). Product options are many as well, including the
ability to define any reasonable page size, on/off check boxes for each of the information
(or data) layers, customized title, and the option to not include the surround elements
such as the legend and scale bar. File format for product download is another option
available to the user. The generic formats include JPEG, TIFF, PDF, and EPS. Industry-
specific formats include georeferenced PDF, Spot EPS, CADRG, and ECRG. The
finishing package is another option for file type and, as noted earlier in this paper, is a
ZIP file containing the map document and/or associated data.
Deployment Once the system is functioning as expected and is sufficiently debugged, the next step is
to go live. This may be as simple as sending a Web address to key users but can be as
complex as completely changing internal workflows. If the organization publishing the
POD system plans to use it internally to create products for formal publishing, then the
cartographers working on the products will need a workflow that describes how to take
the POD output and turn it into a publication. If the organization requires some data
adjustment before it is made available via POD, then the data analyst will need a
workflow outlining those new procedures. The impact that a POD implementation has on
an organization can be significant, depending on the project requirements. The efficiency
gains and added advantages from easy access to up-to-date data will likely have an even
greater impact on production processes and user satisfaction.
July 2009 12About ESRI Our Focus Contact ESRI
For four decades, ESRI has been At ESRI, we focus on promoting 1-800-GIS-XPRT (1-800-447-9778)
helping people make better the value of GIS and its applications Phone: 909-793-2853
decisions through management and throughout the world and pay close Fax: 909-793-5953
analysis of geographic information. attention to our users’ needs. Our info@esri.com
Our culturally diverse staff work software development and services www.esri.com
with our business partners and respond to our customers with
Offices worldwide
hundreds of thousands of people products that are easy to use, flexible,
www.esri.com/locations
who use GIS to make a difference and integrated. Our technology is
in our world. multidisciplinary, productive, and
valuable to our users.
A full-service GIS company, ESRI
offers support for implementing We have a strong commitment to
GIS technology from the desktop educating our customers through
to enterprise-wide servers, online ESRI’s various training programs. ESRI
services, and mobile devices. is a socially conscious business and
GIS solutions are flexible and invests heavily in issues regarding
customizable to meet the needs of education, conservation, sustainable
all our users. development, and humanitarian affairs.
ESRI
380 New York Street
Redlands, California
92373-8100 USAYou can also read


