The Economic Impact of Instacart on the U.S. Retail Grocery Industry Before and During the COVID-19 Pandemic - Robert Kulick, Ph.D.
←
→
Page content transcription
If your browser does not render page correctly, please read the page content below
The Economic Impact of Instacart on the U.S. Retail
 Grocery Industry Before and During the COVID-19
                                        Pandemic

                                    Robert Kulick, Ph.D.
                                          September 2021
About the Author
Dr. Kulick is an Associate Director in NERA’s Communications, Media, and Internet Practice and
an adjunct professor at George Mason University Law School.

He is grateful to Wonjun Chang and Megan Ye for assistance with this report and to Instacart for
its sponsorship. The views expressed are exclusively his own and do not necessarily represent
those of any of the institutions with which he is affiliated.
Executive Summary
In recent years, the U.S. grocery industry has witnessed the development of several new
technologies with the potential to transform how stores operate and interact with consumers. The
COVID-19 pandemic rapidly increased the adoption of these new technologies as the industry
simultaneously experienced a surge in demand and unprecedented operational challenges. Perhaps
the most significant innovation in how grocery stores operate has been the advent of third-party
delivery platforms led by Instacart.
Due to both the rapid expansion of Instacart and the potential for policy makers to enact regulatory
changes at the local, state, or national level that may restrict or impair the operations of grocery
delivery platforms, it is crucial to understand how Instacart affects grocery workers and the overall
grocery industry. Thus, this study utilizes a series of rigorous statistical models to evaluate the
relationship between Instacart adoption and economic outcomes in the U.S. retail grocery industry.
Specifically, it examines three primary questions: (1) whether the positive relationship between
Instacart adoption and economic growth in the grocery industry found in previous research for four
states extends to all 50 states; (2) whether the surge in Instacart usage associated with the COVID-
19 pandemic led directly to increased grocery employment and output; and (3) whether Instacart
has had any impact on grocery workers’ wages.
The statistical analysis presents strong evidence of a direct causal relationship between Instacart
adoption and economic growth in the U.S. grocery industry. Both the pre-pandemic and post-
pandemic results are based on the estimation of a series of distinct but complementary statistical
models that differ in how Instacart adoption is measured. Thus, for ease of interpretation, the
median estimates across models are reported in this executive summary. The results show:
By the end of 2019, prior to the outbreak of COVID-19, Instacart was responsible for
creating approximately 116,000 jobs in the U.S. grocery industry and for increasing
grocery revenue by $2.9 billion.
Instacart accounted for approximately 70 percent of pre-pandemic net grocery job creation
from 2013 to 2019.
During the pandemic, Instacart was responsible for creating approximately 70,000
additional jobs in the U.S. grocery industry and further annualized revenue growth of $3.5
billion. Thus, to date, Instacart has cumulatively created approximately 186,000 total jobs
in the U.S. grocery industry and increased total annual grocery revenue by $6.4 billion.
U.S. grocery employment surged during the pandemic, and approximately 92 percent of
net grocery job creation associated with COVID-19 was attributable to Instacart.
During the pandemic, Instacart increased average weekly wages for grocery workers by
approximately $22 in markets served by Instacart.
The consistency of the results across models and estimation strategies strongly supports a
causal interpretation of the findings.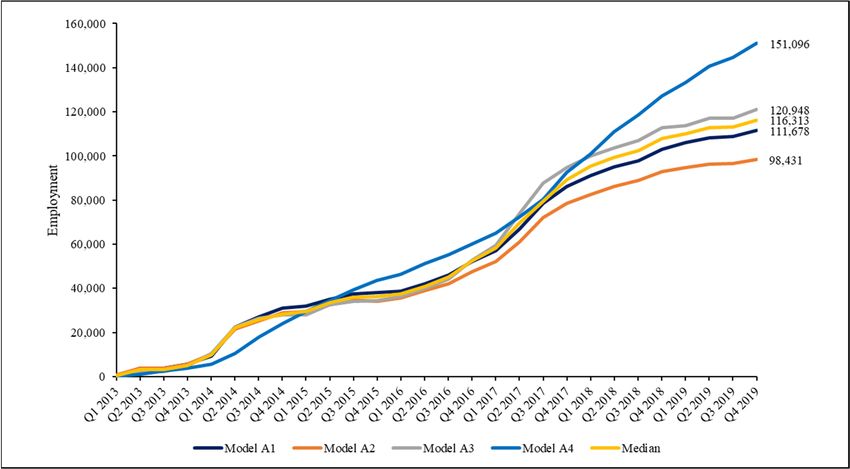
Contents

I.        INTRODUCTION ....................................................................................................... 4

II.       SUMMARY OF MAIN FINDINGS .................................................................................. 6

          A. Pre-Pandemic Results ................................................................................... 6
          B. Post-Pandemic Results .................................................................................. 9

III.      DATA AND METHODOLOGY ..................................................................................... 12

          A. Overview ...................................................................................................... 12
          B. Analysis of Instacart Entry and Adoption and Economic Outcomes
             in the U.S. Grocery Industry Pre-Pandemic ................................................. 12
          C. Analysis of the Surge in Instacart Adoption and Economic
             Outcomes in the U.S. Grocery Industry During the COVID-19
             Pandemic ..................................................................................................... 15

IV.       STATISTICAL ESTIMATION OF THE PRE-PANDEMIC INSTACART ENTRY AND
          ADOPTION MODELS ............................................................................................... 19

          A. Employment Effects of Instacart Entry and Adoption ................................... 19
          B. Output Effects of Instacart Entry and Adoption ............................................ 24
          C. Average Wage Effects of Instacart Entry and Adoption ............................... 25

V.        STATISTICAL ESTIMATION OF THE POST-PANDEMIC INSTACART ADOPTION
          MODELS ............................................................................................................... 26

          A. Employment Effects of Instacart Adoption During the COVID-19
             Pandemic ..................................................................................................... 26
          B. Output Effects of Instacart Adoption During the COVID-19
             Pandemic ..................................................................................................... 28
          C. Average Wage Effects of Instacart Adoption During the COVID-19
             Pandemic ..................................................................................................... 29

VI.       CONCLUSION ........................................................................................................ 31

APPENDIX 1..................................................................................................................... 32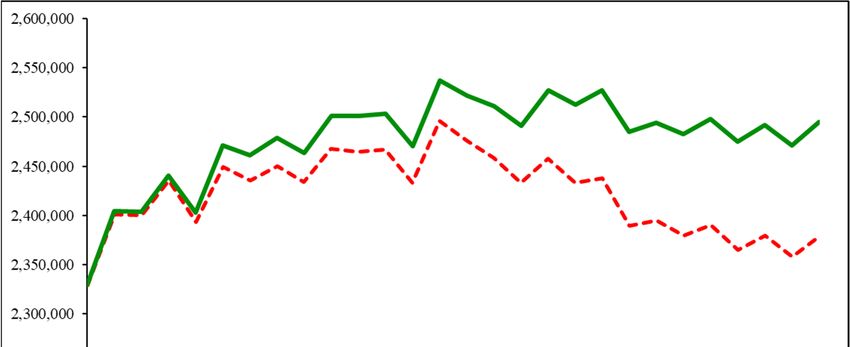
I.     Introduction
In recent years, the U.S. grocery industry has witnessed the development of several new
technologies with the potential to transform how stores operate and interact with consumers. The
COVID-19 pandemic rapidly increased the adoption of these new technologies as the industry
simultaneously experienced a surge in demand and unprecedented operational challenges.

Perhaps the most significant innovation in how grocery stores operate has been the advent of third-
party delivery platforms led by Instacart. Starting with commercial service in San Francisco in
early 2013, Instacart provides same-day delivery to customers from approximately 55,000 stores
across the United States. From 2013 to 2019, Instacart expanded quickly with deliveries growing
at a compound annual growth rate of 216 percent. During the COVID-19 pandemic, Instacart’s
already rapid growth accelerated dramatically with the value of transactions on the platform
quadrupling.

Due to both the rapid expansion of Instacart and the potential for policy makers to enact regulatory
changes at the local, state, or national level that may restrict or impair the operations of grocery
delivery platforms, it is crucial to understand how Instacart affects grocery workers and the overall
grocery industry. To date, rigorous statistical examination of Instacart’s economic impact is
limited to an analysis conducted by the author of the present study assessing Instacart’s effect on
grocery employment and output in four states.1 The present study thus expands on the previous
research by examining three primary questions regarding Instacart’s effect on the grocery industry:
(1) whether the positive relationship between Instacart adoption and grocery employment and
output found in previous research extends to all 50 states;2 (2) whether the surge in Instacart usage
associated with the outbreak of COVID-19 enabled the growth of the grocery industry during the
pandemic by directly increasing employment and output; and (3) whether Instacart has had any
impact on the wages earned by grocery workers by, for instance, changing the composition of jobs
within the industry or enhancing the ability of the industry to respond to changes in demand.

The results of this study demonstrate that the previously documented “Instacart Effect” is a
national phenomenon, significantly increasing grocery employment and output within each major
U.S. geographic region. The results also indicate that not only did the Instacart Effect persist during
the COVID-19 pandemic, but that the relationship between Instacart adoption and economic
growth in the grocery industry strengthened as large numbers of consumers opted for grocery
delivery to avoid in-store shopping and replace restaurant dining.

Both the pre-pandemic and post-pandemic 3 results are based on the estimation of a series of
distinct but complementary statistical models that differ in how Instacart adoption is measured.

    1
      Robert Kulick, The Economic Impact of Instacart on the Retail Grocery Industry: Evidence from Four States,
NERA Economic Consulting (2020) (available at https://www.nera.com/publications/archive/2020/nera-economist-
evaluates-the-economic-impact-of-instacart-on-the.html).
    2
      The results reported throughout this study also include Washington, D.C.
    3
      The terminology “post-pandemic” is used throughout this study to refer to the time period beginning in Q1 2020
when COVID-19 first appeared in the United States.
                                                                                                                  4
Thus, for ease of interpretation, the median estimates across models are reported below. The results
show:
By the end of 2019, prior to the outbreak of COVID-19, Instacart was responsible for
creating approximately 116,000 jobs in the U.S. grocery industry and for increasing
grocery revenue by $2.9 billion.
Instacart accounted for approximately 70 percent of pre-pandemic net grocery job creation
from 2013 to 2019.
In Q2 2020, at the height of the COVID-19 pandemic, Instacart was responsible for
creating approximately 70,000 additional jobs in the U.S. grocery industry and further
annualized revenue growth of $3.5 billion. Thus, to date, Instacart has created
approximately 186,000 total jobs in the U.S. grocery industry and increased total annual
grocery revenue by $6.4 billion combining the pre- and post-pandemic economic impacts.
U.S. grocery employment surged during the pandemic, and approximately 92 percent of
net grocery job creation associated with COVID-19 was attributable to Instacart.
By enabling the industry to respond to the surge in demand associated with the pandemic,
Instacart increased average weekly wages for grocery workers by approximately $22 in
markets served by Instacart. Furthermore, despite speculation that new technologies
including third-party grocery delivery may change the composition of jobs within the
industry favoring lower paying jobs,4 the statistical results consistently show no reduction
in average grocery wages associated with Instacart adoption pre-pandemic.
There is strong evidence that the relationship between Instacart adoption and grocery
employment, output, and wages is causal.
o Multiple statistical techniques are used to rule out alternative explanations for the
observed relationships. The consistency of the results across models and estimation
strategies strongly supports a causal interpretation.
o The evidence for a causal interpretation of the results is further supported by the
application of a series of falsification or “placebo” tests to each model. These tests
consistently show that the Instacart Effect is not a statistical artifact of broader
trends in the retail economy, but rather reflects a specific relationship between
Instacart adoption and economic outcomes in the U.S. grocery industry.
This study has two primary objectives. The first is to present the results of the underlying statistical
analysis in a simple and straightforward manner to make the findings accessible to the general
public. The second is to demonstrate the strength and consistency of the statistical results and the
4
See e.g., Francoise Carre and Chris Tilly, Change and Uncertainty, Not Apocalypse: Technological Change and
Store-Based Retail, UC Berkeley Center for Labor Research (2020) (available at
https://laborcenter.berkeley.edu/release-change-and-uncertainty-not-apocalypse-technological-change-and-store-
based-retail/).
5
large amount of evidence supporting a causal interpretation of the findings through an in-depth
discussion of the statistical methodology and data. For readers primarily interested in the first
objective, the next section of this paper presents the key findings relying primarily on
visualizations of the results with limited discussion of the underlying statistical methodology. The
remaining sections provide an in-depth discussion of the data, models, estimation procedures, and
econometric results.
II. Summary of Main Findings
The statistical analysis introduced in this study presents strong evidence that Instacart has driven
and continues to propel significant increases in employment and output in the U.S. grocery
industry. The first set of results presented below quantifies the economic growth experienced by
the grocery industry due to Instacart’s entry and adoption prior to the COVID-19 pandemic. The
second set of results quantifies the incremental contribution of Instacart to the growth of the
grocery industry during the pandemic.
A. Pre-Pandemic Results
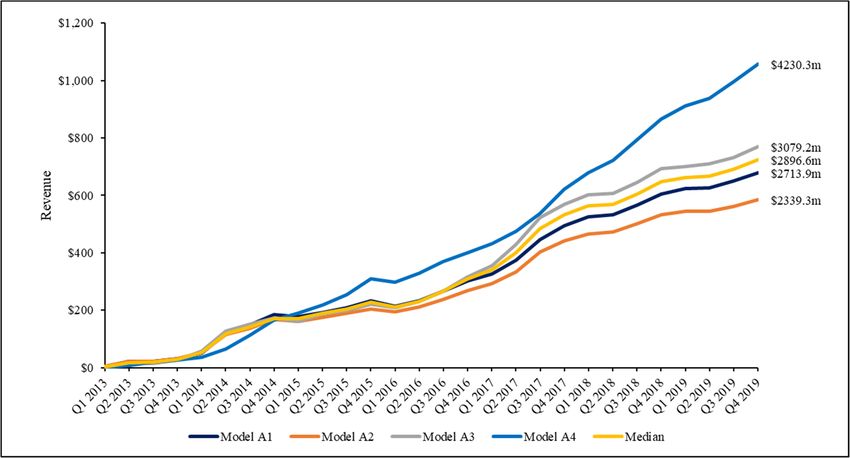
Figure 1 presents Instacart’s contribution to grocery employment and revenue through 2019 based
on estimates from four statistical models. The models, labeled A1-A4, differ in terms of how
Instacart adoption is measured, and further details on the models are provided in the next section.
The first four bars of each series represent the increase in grocery employment and revenue directly
attributable to Instacart by model, and the fifth bar represents the median employment/revenue
impact across models.
FIGURE 1:
GROCERY EMPLOYMENT AND REVENUE ATTRIBUTABLE
TO INSTACART BY MODEL, 2019
$5,000
160,000 151,096
$4,230m $4,500
140,000
$4,000
120,948
120,000 116,313
111,678 $3,500
$3,079m
98,431 $2,897m
100,000 $2,714m $3,000
Employment
Revenue
$2,339m $2,500
80,000
$2,000
60,000
$1,500
40,000
$1,000
20,000 $500
0 $0
2019 Employment 2019 Revenue
Model A1 Model A2 Model A3 Model A4 Median
For employment, the statistical results indicate that by the end of 2019, Instacart was responsible
for creating 98,431 to 151,096 jobs in the U.S. grocery industry with a median estimate of 116,313
6jobs. That is, in the absence of Instacart, there would have been 98,431 to 151,096 fewer grocery
jobs in the United States in 2019. For output, the statistical results indicate that Instacart increased
grocery revenue by $2.3 billion to $4.2 billion with a median estimate of $2.9 billion, or that in the
absence of Instacart, U.S. grocery stores would have earned $2.3 billion to $4.2 billion less in
revenue in 2019.5
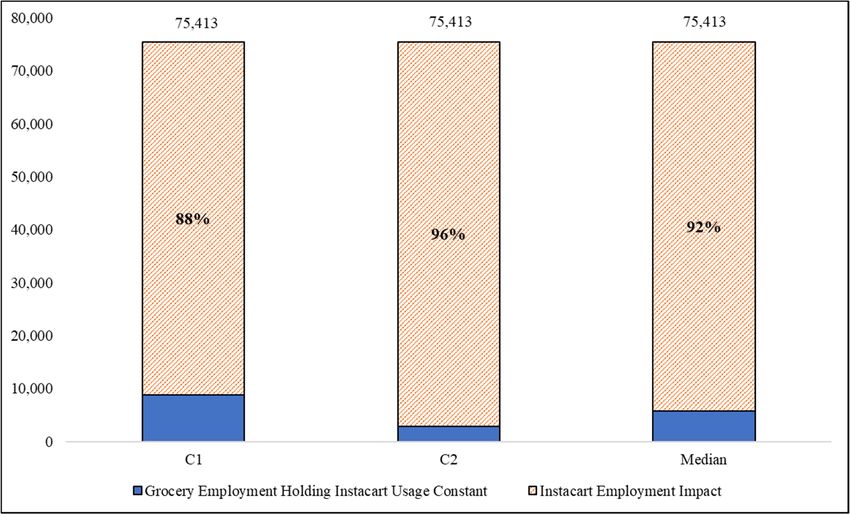
Figure 2 presents actual U.S. grocery employment from Q1 2013 to Q4 2019 (which includes
employment growth attributable to Instacart) versus U.S. grocery employment without Instacart
based on Instacart’s median impact on grocery employment across the statistical estimates from
models A1-A4.
FIGURE 2:
U.S. GROCERY EMPLOYMENT WITH AND
WITHOUT INSTACART, 2013-2019
The top line depicts actual grocery employment in the United States since the commercial entry of
Instacart into its first market and indicates that from Q1 2013 to Q4 2019, employment in the
industry increased from 2,329,561 to 2,494,908, or 7.1 percent, representing net job creation of
165,347. In the absence of Instacart, however, the growth of the grocery industry would have been
essentially stagnant. Without Instacart, the industry would have only grown by 49,369, a growth
5
Because the underlying models are estimated on a quarterly basis, economic impacts for a given year are
calculated based on Q4 employment and annualized revenue. Calculating revenue on an annualized basis allows for
direct comparison of the pre-pandemic results, which are estimated for multiple quarters, and the post-pandemic results,
which are estimated for a single quarter.
7rate of 2.1 percent. Put differently, the statistical results indicate that Instacart accounted for
approximately 70 percent of net grocery job creation from 2013 to 2019.
The results also indicate that the Instacart Effect is a national phenomenon fostering the growth of
the grocery industry throughout the United States. Figures 3 and 4 present the median grocery
employment and revenue increases attributable to Instacart by geographic region through 2019.
FIGURE 3:
GROCERY EMPLOYMENT ATTRIBUTABLE TO INSTACART
BY MODEL AND REGION, 2019
FIGURE 4:
GROCERY REVENUE ATTRIBUTABLE TO INSTACART
BY MODEL AND REGION, 2019
8For employment, the models show that through 2019, Instacart created a median estimate of 27,750
jobs in the East;6 17,106 jobs in the Midwest;7 42,577 jobs in the South;8 and, 28,880 jobs in the
West.9 For output, the models show that through 2019, Instacart increased grocery revenue by a
median estimate of $684 million in the East; $377 million in the Midwest; $997 million in the
South; and $839 million in the West.
B. Post-Pandemic Results
The first cases of COVID-19 appeared in the United States early in Q1 2020, and, by the end of
the quarter, much of the United States was subject to mandatory stay-at-home orders.10 In Q2 2020,
the disruption to the U.S. economy reached its peak as measured in terms of job losses. However,
not all sectors of the economy declined. While the retail economy shed 1,853,762 jobs from Q4
2019 to Q2 2020, the U.S. grocery industry grew, adding 75,413 jobs over the same period.
Instacart also grew dramatically during the pandemic with the value of transactions on the platform
quadrupling. These economic shocks to the retail economy and the grocery industry are depicted
in Figure 5.11
FIGURE 5:
THE EFFECT OF THE COVID-19 PANDEMIC ON THE U.S. RETAIL ECONOMY
AND THE GROCERY INDUSTRY
2,640,000 16,500,000
2,620,000
16,000,000
2,600,000
15,500,000
Grocery Employment
2,580,000
Retail Employment
2,560,000 15,000,000
2,540,000 14,500,000
2,520,000
14,000,000
2,500,000
13,500,000
2,480,000
2,460,000 13,000,000
Q1 2019 Q2 2019 Q3 2019 Q4 2019 Q1 2020 Q2 2020
Grocery Employment Retail Employment
6
The East is defined as CT, MA, ME, NY, VT, DE, NH, NJ, RI, PA.
7
The Midwest is defined as IA, IL, IN, KS, MI, MN, OH, WI, NE.
8
The South is defined as AL, AR, FL, GA, KY, LA, MD, MO, MS, NC, OK, SC, TN, TX, VA, WV, DC.
9
The West is defined as AZ, CA, CO, ID, MT, NM, NV, OR, UT, WA, ND, SD, WY, AK, HI.
10
Anne Schuchat, “Public Health Response to the Initiation and Spread of Pandemic COVID-19 in the United
States, February 24–April 21, 2020,” Morbidity and Mortality Weekly Report (May 8, 2020) 551-556 (available at
https://www.cdc.gov/mmwr/volumes/69/wr/mm6918e2.htm).
11
Total grocery employment in Figure 5 for 2019 differs slightly from that reported in Figure 2 because Figure 2
is based on Census QWI data while Figure 5 is based on BLS QCEW data. As discussed below, the post-pandemic
analysis is conducted using QCEW data as MSA-level QWI data are not yet available for Q2 2020.
9Figure 6 presents the increase in grocery employment and revenue attributable to Instacart at the
peak of the COVID-19 pandemic in Q2 2020. These effects are in addition to the impacts
attributable to Instacart pre-pandemic. That is, the economic growth depicted in Figure 6 is
incremental to the employment and revenue impacts presented in Figure 1. The models quantifying
the magnitude of the Instacart Effect during the COVID-19 pandemic are labeled C1-C2 and are
discussed in detail in the next section. The first two bars of each series represent the additional
contribution of Instacart to grocery employment and revenue growth in Q2 2020 relative to Q4
2019 by model and the third bar represents the median employment/revenue impact across models.
FIGURE 6:
GROCERY EMPLOYMENT AND REVENUE ATTRIBUTABLE TO INSTACART
BY MODEL DURING THE COVID-19 PANDEMIC, Q2 2020
For employment, the results indicate that Instacart created a further 66,584 to 72,535 jobs in the
U.S. grocery industry during the pandemic with a median estimate of 69,560 jobs in addition to
the jobs created by Instacart pre-pandemic. Thus, combining the employment results from Figure
1 and Figure 6, in the absence of Instacart, there would have been 165,015 to 223,631 fewer
grocery jobs in the United States in Q2 2020. For revenue, the results indicate that Instacart
increased grocery revenue by a further $3.4 billion to $3.7 billion with a median estimate of $3.5
billion. Again, combining the output results from Figure 1 and Figure 6, in the absence of Instacart,
annualized grocery revenue would have been $5.7 billion to $7.9 billion lower in the United States
in Q2 2020.
As shown in Figure 5, between Q4 2019 and Q2 2020, U.S. grocery employment increased by
75,413 jobs. Figure 7 uses models C1-C2 to quantify the proportion of the COVID-19 surge in
U.S. grocery employment attributable to Instacart.
10FIGURE 7:
PERCENTAGE OF COVID-19 GROCERY EMPLOYMENT SURGE
ATTRIBUTABLE TO INSTACART
Figure 7 shows that 88 percent to 96 percent of the increase in grocery employment at the peak of
the COVID-19 pandemic in Q2 2020 was attributable to Instacart with a median estimate of 92
percent.
For wages, Figure 8 shows that in markets it served, Instacart increased average weekly grocery
wages by between $19.59 and $25.16 with a median estimate of $22.37 during the pandemic.
FIGURE 8:
INCREASE IN AVERAGE GROCERY WAGE ATTRIBUTABLE TO INSTACART
BY MODEL DURING THE COVID-19 PANDEMIC, Q2 2020
11Thus, during the pandemic, Instacart benefitted grocery workers by creating jobs and increasing
wages and benefitted the grocery industry by increasing output. These gains stand in sharp contrast
to the decline and disruption experienced by retailers and retail employees in other industries.
III. Data and Methodology
A. Overview
This study examines three primary questions regarding Instacart’s effect on the U.S. retail grocery
industry: (1) whether the positive relationship between Instacart adoption and economic growth in
the grocery industry as measured by employment and output documented in Kulick (2020) extends
to all 50 states; (2) whether the surge in Instacart usage catalyzed by the outbreak of COVID-19
directly enabled the growth of the grocery industry as measured by employment and output during
the pandemic; and (3) whether Instacart has had any impact on grocery workers’ wages by, for
instance, changing the composition of jobs within the industry or enhancing the ability of the
industry to respond to changes in demand. This study evaluates these questions using a statistical
technique known as regression analysis. Regression analysis is a tool frequently used by
economists to assess the relationship between two variables while holding constant other potential
explanations for the observed relationship.
Instacart’s effect on the grocery industry pre-pandemic is evaluated using a dataset combining
internal sales data provided by Instacart with employment, payroll, and wage data from the U.S.
Census Bureau Quarterly Workforce Indicators (QWI) program. Instacart’s effect on the grocery
industry post-pandemic is evaluated using a dataset combining Instacart’s internal sales data with
data from the U.S. Bureau of Labor Statistics (BLS) Quarterly Census of Employment and Wages
(QCEW).
To provide a rigorous assessment of whether there is evidence of a causal relationship between
Instacart adoption and economic outcomes in the U.S. grocery industry, each question is evaluated
using several regression models. Specifically, and as described in more detail below, the regression
analyses are conducted using different measures of Instacart adoption in a local market.
Furthermore, in estimating each model, multiple statistical techniques are used to rule out
alternative explanations for the observed relationships. The consistency of the empirical results
across models and statistical control strategies provides strong evidence of a causal relationship
between Instacart adoption and economic growth in the U.S. grocery industry.
B. Analysis of Instacart Entry and Adoption and Economic Outcomes in the U.S.
Grocery Industry Pre-Pandemic
The economic impact of Instacart’s entry and adoption on the U.S. grocery industry is quantified
through the estimation of five regression models. The models use data on grocery employment,
12payroll, and average wages12 in metropolitan statistical areas13 (MSAs) across the 50 U.S. states
and Washington, D.C. on a quarterly basis from Q1 2012 to Q4 2019 to evaluate the effect of
Instacart on economic outcomes in the grocery industry. The starting point for the sample of Q1
2012 was chosen to capture a full year of data prior to Instacart’s commercial entry into its first
market, San Francisco, in Q1 2013. The end point represents the most recent quarter in which all
variables used in the regression analysis have data available at a quarterly frequency.
Each of the five models uses a different measure of Instacart adoption. The first model (A1)
quantifies Instacart adoption using the number of Instacart deliveries made in an MSA. The second
model (A2) quantifies Instacart adoption using Instacart’s total value of goods sold or GMV in an
MSA. The third model (A3) quantifies Instacart adoption using the number of stores served by
Instacart in an MSA. The fourth model (A4) quantifies Instacart adoption using the number of
quarters following Instacart’s entry into an MSA. The fifth model (A5) compares economic
outcomes based on an indicator variable representing whether Instacart is present in the MSA.
Because each measure of Instacart adoption utilized in models A1-A4 varies by quarter and is thus
suitable for estimating the magnitude of the Instacart Effect at any given point in time, models A1-
A4 are used to quantify Instacart’s effect on grocery employment and output. Model A5 is included
for comparison to the results from Kulick (2020) and as a robustness check supporting a causal
interpretation of the results.
To rule out the possibility that the observed effects reflect spurious correlations due to unobserved
factors, each model is estimated controlling for various fixed effects. In fixed-effects models,
variation in the dependent variable resulting from unobserved factors is removed.14 For instance,
by controlling for MSA fixed effects in estimating models A1-A5, all MSA-level cross-sectional
variation in the dependent variables is removed, and the estimation procedure eliminates the
potential confounding effect of non-time varying characteristics specific to each MSA.15 Similarly,
controlling for year fixed effects eliminates potential bias from time trends encapsulated in the
dependent variables. In addition to controlling for MSA and year effects, models A1-A5 also
control for quarter and region-year interaction effects. Each model is estimated using the fixed-
effects “within” estimator, and standard errors are clustered by state.
Further support for a causal interpretation of the results is provided by subjecting each of the
primary regression models to six placebo tests. These placebo tests are designed to confirm that
the statistical results reflect the specific relationship between Instacart adoption and economic
outcomes in the grocery industry rather than a general correlation between Instacart adoption and
broader trends in the retail economy. Thus, for the first five tests, each model is estimated replacing
the dependent variable, employment in the grocery store industry, with employment in the book
12
The QWI MSA-level average wage data contain a small number of extreme outliers. Thus, observations from
the QWI data with an average wage below the 0.1 percentile and above the 99.9 percentile are dropped from the
regression sample.
13
Approximately 98 percent of Instacart sales in Q4 2019 occurred in MSAs. Thus, because data for the variables
used in the regression analysis are frequently missing for micropolitan areas, the regression sample is limited to MSAs.
14
See e.g., James H. Stock and Mark W. Watson, Introduction to Econometrics (Boston: Pearson Education,
2003) at 278-279.
15
See e.g., Fumio Hayashi, Econometrics, 1st ed. (Princeton, NJ and Oxford, U.K.: Princeton University Press,
2000) at 323-336.
13store, sporting goods and hobby store, general merchandise store, furniture store, and clothing
store industries. These placebo industries were selected as those most likely to be affected by retail
demand shocks associated with the rise of e-commerce. For the sixth test, the model is estimated
on total retail employment excluding employment from the grocery industry.
The underlying dataset used to estimate the Instacart entry and adoption models reflects the
combination of data from three sources. Quarterly data indicating when Instacart started serving
each MSA and other measures of Instacart adoption in an MSA were provided by Instacart.
Quarterly employment, payroll, and average wage data by MSA are sourced from the U.S. Census
Bureau’s QWI program. Quarterly real gross domestic product (GDP) and data on population and
personal income are sourced from the U.S. Bureau of Economic Analysis (BEA).16 Yearly state-
level data measuring personal expenditures on food and food services are also obtained from the
BEA. Table 1 provides definitions of and sources for the variables used in the pre-pandemic
Instacart entry and adoption regressions.
TABLE 1:
VARIABLE DEFINITIONS AND SOURCES FOR INSTACART
ENTRY AND ADOPTION ANALYSIS
Variables Definition Source
Dependent
The natural logarithm of employment in the grocery stores industry (NAICS 4451) in a given MSA on the last day of
log(Grocery Employment) U.S. Census Bureau
a given quarter
log(Grocery Payroll) The natural logarithm of total payroll in the grocery stores industry (NAICS 4451) in a given MSA in a given quarter U.S. Census Bureau
The natural logarithm of average monthly earnings of full-quarter employees in the grocery stores industry (NAICS
log(Grocery Wage) U.S. Census Bureau
4451) in a given MSA in a given quarter
The natural logarithm of employment in the book stores and news dealers industry (NAICS 4512) in a given MSA on
log(Book Store Employment) U.S. Census Bureau
the last day of a given quarter
log(Sporting and Hobby The natural logarithm of employment in the sporting goods, hobby, and musical instrument stores industry (NAICS
U.S. Census Bureau
Employment) 4511) in a given MSA on the last day of a given quarter
log(General Merchandise The natural logarithm of employment in the general merchandise stores, including warehouse clubs and supercenters,
U.S. Census Bureau
Employment) industry (NAICS 4523) in a given MSA on the last day of a given quarter
The natural logarithm of employment in the furniture stores industry (NAICS 4421) in a given MSA on the last day
log(Furniture Store Employment) U.S. Census Bureau
of a given quarter
The natural logarithm of employment in the clothing stores industry (NAICS 4481) in a given MSA on the last day of
log(Clothing Store Employment) U.S. Census Bureau
a given quarter
log(Total Non-Grocery Retail The natural logarithm of employment in all retail trade industries (NAICS 44-45) except the grocery stores industry
U.S. Census Bureau
Employment) (NAICS 4451) in a given MSA on the last day of a given quarter
Independent
log(Deliveries) The natural logarithm of the number of Instacart deliveries made in a given MSA in a given quarter Instacart
log(GMV) The natural logarithm of the Gross Merchandise Value of Instacart deliveries made in a given MSA in a given quarter Instacart
log(Store Count) The natural logarithm of the number of stores from which Instacart made deliveries in a given MSA in a given quarter Instacart
The natural logarithm of the number of quarters since the first quarter when Instacart Presence = 1 for a given MSA
log(Quarters Since Entry) Instacart
in a given quarter; Quarters Since Instacart Entry = 0 in first quarter of entry
Instacart Presence Indicator =1 if Instacart made deliveries in a given MSA in a given quarter Instacart
The natural logarithm of employment in all industries except the grocery stores industry (NAICS 4451) in a given
log(Non-Grocery Employment) U.S. Census Bureau
MSA on the last day of a given quarter
Personal Income per Capita Per capita personal income in a given MSA in a given year U.S. BEA
log(GDP) The natural logarithm of GDP in a given MSA in a given year U.S. BEA
log(Consumer Expenditures on Food
The natural logarithm of consumer expenditures on food and beverage goods in a given state in a given year U.S. BEA
and Beverage Goods)
log(Consumer Expenditures on Food
The natural logarithm of consumer expenditures on food services in a given state in a given year U.S. BEA
Services)
16
The BEA provides county-level data which are mapped to the MSA-level Census QWI data.
14Table 2 provides summary statistics for the variables used in the pre-pandemic Instacart entry and
adoption analysis.
TABLE 2:
SUMMARY STATISTICS FOR INSTACART
ENTRY AND ADOPTION ANALYSIS
Number of Standard
Variables Mean Median Min Max
Observations Deviation
Primary Regression Variables
Grocery Employment 13,902 5,247 1,563 11,708 16 120,099
Grocery Payroll 13,980 33,444,702 8,881,609 81,476,113 51,341 1,037,489,961
Grocery Wage 13,931 1,186 1,138 285 404 3,348
Store Count 14,049 13 0 52 0 1,279
Quarters Since Entry 14,049 1.38 0.00 3.30 0.00 27.00
Instacart Presence 14,049 0.27 0.00 0.44 0.00 1.00
Non-Grocery Employment 13,846 274,862 86,904 611,717 1,049 6,481,660
Personal Income per Capita (Annual) 14,049 44,320 42,403 10,468 23,130 128,766
GDP (Annual, Thousands) 14,049 35,437,594 9,331,478 92,121,675 164,700 1,141,945,618
Consumer Expenditures on Food and Beverage Goods (Annual, Millions) 14,049 30,657 20,470 28,502 1,719 127,369
Consumer Expenditures on Food Services (Annual, Millions) 14,049 28,782 18,556 30,501 1,579 149,368
Placebo Regression Variables
Book Store Employment 11,313 220 83 453 0 5,095
Sporting and Hobby Employment 13,599 1,091 410 2,083 0 23,497
General Merchandise Employment 13,844 3,562 1,440 6,505 9 71,222
Furniture Store Employment 13,206 473 151 953 0 8,431
Clothing Store Employment 13,505 2,237 558 6,231 0 92,120
Total Non-Grocery Retail Employment 13,846 25,877 8,822 53,213 44 514,260
Sources: See Table 1 sources. Note: The sample size of regression variables varies due to differences in data availability. Grocery
wage data excludes observations with wage values below the 0.1 percentile and above the 99.9 percentile. Summary statistics for
Deliveries and GMV are redacted.
As indicated in Table 1, except for the Instacart Presence variable, the measures of Instacart
adoption above are included in the regression analysis as the natural logarithm (log) of each
variable. By taking the log of each variable, the regressions account for diminishing returns in the
relationship between Instacart adoption and the dependent variables. The log function is also
convenient as it allows the coefficients in the regression equations to be interpreted in percentage
terms. However, because the dataset includes observations prior to Instacart’s entry for each MSA
and because the log function does not permit inclusion of zero-valued observations, each of the
Instacart adoption variables is transformed by adding one to the variable so that the pre-entry value
is equal to one rather than zero. To confirm the robustness of the analysis to this transformation,
Appendix 1 presents alternative specifications where a range of root functions, which also account
for diminishing returns but permit zero-valued observations, are applied to each measure of
Instacart adoption instead. Appendix 1 shows that the results are robust to the use of these
alternative specifications, and thus are not a statistical artifact created by the transformation of the
Instacart adoption variables.
C. Analysis of the Surge in Instacart Adoption and Economic Outcomes in the
U.S. Grocery Industry During the COVID-19 Pandemic
The analysis described in this section assesses the relationship between the surge in Instacart
adoption and economic outcomes in the grocery industry at the peak of the COVID-19 pandemic
in Q2 2020. The statistical approach described in the previous section is adapted in three primary
15ways to address the distinct methodological considerations specific to investigating Instacart’s
economic impact on the grocery industry during the pandemic.
First, because of the rapid onset of the pandemic, the surge in Instacart adoption in Q2 2020 is
most evident in a significant increase in deliveries and GMV. Thus, the models described in this
section measure Instacart usage in terms of these two adoption variables.
Second, because the analysis is conducted for a cross-section of data at a point in time, it is not
possible to use fixed effects to control for unobservables as in the pre-pandemic analysis. It remains
crucial, however, to adequately control for demand conditions to support a causal interpretation of
the results. In particular, because both grocery demand and Instacart adoption spike simultaneously
in Q2 2020, it is important to adopt a control strategy to isolate the effect of Instacart adoption on
grocery demand rather than grocery demand on Instacart adoption. Thus, in addition to applying
controls for observable factors similar to those used in the pre-pandemic Instacart entry and
adoption models, the analysis in this section also relies on a distinct set of statistical methodologies
to control for potentially confounding factors.
As a starting point, each regression presented in this section controls directly for local COVID-19
cases and deaths to capture regional variation in the intensity of the pandemic. In addition, for the
employment and output regressions, the dependent variables and the Instacart adoption variables
for Q2 2020 are differenced relative to their pre-pandemic values in Q4 2019 to remove potentially
spurious correlation due to unobserved pre-pandemic factors. Thus, the first of the post-pandemic
statistical models (C1) evaluates the relationship between the change in grocery employment
between Q2 2020 and Q4 2019 and the change in Instacart deliveries between Q2 2020 and Q4
2019. The second model (C2) evaluates the relationship between the change in grocery
employment between Q2 2020 and Q4 2019 and the change in Instacart GMV between Q2 2020
and Q4 2019. Due to the absence of a potentially confounding secular trend in average grocery
wages, for the average wage regressions, the levels of the dependent variables and Instacart
adoption variables are used in estimating the models.
Finally, models C1 and C2 are estimated using a statistical technique known as instrumental
variables (IV) estimation. While differencing the primary variables of interest and controlling for
observable factors including the local intensity of the pandemic constitute effective strategies for
controlling for local demand conditions, it is still useful to further rule out the possibility that a
positive relationship between local grocery outcomes and Instacart adoption reflects high grocery
demand related to the COVID-19 pandemic driving increased Instacart adoption. IV estimation
proceeds by introducing an additional variable known as an “instrument” into the model that
effects the independent variable of interest but is otherwise uncorrelated with unobserved factors
that jointly determine the dependent variable and the independent variable.17 In this case, using IV
estimation to address the potential issue of simultaneity between grocery demand and Instacart
adoption involves utilization of an instrument that is correlated with Instacart adoption but not
correlated with COVID-19 related demand shocks except by facilitating Instacart adoption. The
Quarters Since Entry variable employed directly as a regressor in the pre-pandemic Instacart entry
17
See e.g., Jeffrey M. Wooldridge, Econometric Analysis of Cross Section and Panel Data, 2nd ed. (Cambridge,
MA and London, U.K.: MIT press, 2010) at 89-96.
16and adoption analysis is used as an instrument in estimating models C1 and C2 because it is highly
correlated with increased Instacart adoption during the pandemic but, because it is fixed based on
the date of Instacart’s initial entry into a market, is not a function of current demand conditions.
Third, MSA-level QWI data is not yet available for Q2 2020. Thus, the post-pandemic statistical
analysis uses employment, payroll, 18 and average wage data from the BLS’ QCEW program.
Unlike the QWI data, detailed industry-level data from QCEW are available at the county level
rather than the MSA level. Accordingly, the county-level data from QCEW are mapped to MSAs
as defined in the QWI data to maintain a consistent geographic scope between the pre- and post-
pandemic analyses. To ensure privacy of employers and individuals, QCEW data are sometimes
redacted based on data disclosure guidelines set by regional government agencies that collect labor
statistics.19 Data redaction is likely to occur when, for a given industry, the number of employers
in a county is small, or when a single firm makes up a large proportion of the county’s employment,
in which cases, the redacted data could be used to make inferences regarding individual
employers.20 As such, the missingness of data may not be random, but may depend on systematic
factors. Failing to consider the structure of missingness in the data can therefore lead to bias in the
statistical estimates.
A statistical technique known as inverse propensity score weighting is thus used to address the
potential for sample selection bias to affect the statistical results.21 Specifically, the propensity of
inclusion (the probability of the data being present) is first estimated using county-specific
independent variables including population, personal income, GDP, population density, and region.
Observations in the dataset are then weighted by the inverse of this propensity metric in estimating
the regression models, controlling for potential sample selection bias. All regression results
deriving from the post-pandemic statistical models presented in Section V are propensity score
weighted.22 However, the results are similar without propensity score weighting. The similarity of
the results with and without propensity score weighting indicates that sample selection bias does
not present a concern.
Table 3 provides definitions and sources of variables used in the post-pandemic analysis.
18
A variable identical to QWI’s payroll variable is not available in the QCEW. However, the QCEW wages
variable captures similar information: “QCEW wages data represent the total compensation paid during the calendar
quarter, regardless of when the services were performed.” See Quarterly Census of Employment and Wages, QCEW
Overview (available at https://www.bls.gov/cew/overview.htm).
19
Quarterly Census of Employment and Wages, QCEW Overview (available at
https://www.bls.gov/cew/overview.htm).
20
See e.g., Kentucky Center for Statistics, Kentucky Industry Profiler Technical Notes (2018) (available at
https://kcews.ky.gov/Content/Reports/Industry%20profiler%20tech%20notes.pdf).
21
See e.g., John Haltiwanger, Ron S. Jarmin, Robert Kulick, and Javier Miranda, “High Growth Young Firms:
Contribution to Job, Output, and Productivity Growth,” Measuring Entrepreneurial Businesses: Current Knowledge
and Challenges (University of Chicago Press, 2017) 11-62 at 17.
22
While QWI data are also sometimes redacted, only a small number of observations in the pre-pandemic
regression sample are missing. Out of the 440 MSAs in the QWI data, only one MSA is missing from the sample for
the entirety of the sample period, and out of all MSA-quarter observations in the dataset, fewer than two percent of
observations are missing. Thus, no adjustment is necessary for the pre-pandemic Instacart entry and adoption
regressions.
17TABLE 3:
VARIABLE DEFINITIONS AND SOURCES
FOR COVID-19 ANALYSIS
Variables Definition Source
Dependent
log(Grocery Employment) The difference in the natural logarithm of employment in the grocery stores industry (NAICS 4451) in a
U.S. BLS
(Q4 2019-Q2 2020) given county between Q4 2019 and Q2 2020
log(Grocery Payroll) The difference in the natural logarithm of total wages in the grocery stores industry (NAICS 4451) in a given
U.S. BLS
(Q4 2019-Q2 2020) county between Q4 2019 and Q2 2020
log(Grocery Average Weekly Wage The natural logarithm of average weekly wage in the grocery stores industry (NAICS 4451) in a given
U.S. BLS
Q2 2020) county in Q2 2020
log(Book Store Employment) The difference in the natural logarithm of employment in the book stores and news dealers industry (NAICS
U.S. BLS
(Q4 2019-Q2 2020) 4512) in a given county between Q4 2019 and Q2 2020
log(Sporting and Hobby The difference in the natural logarithm of employment in the sporting goods, hobby, and musical instrument
U.S. BLS
Employment) (Q4 2019-Q2 2020) stores industry (NAICS 4511) in a given county between Q4 2019 and Q2 2020
The difference in the natural logarithm of employment in the general merchandise stores, including
log(General Merchandise
warehouse clubs and supercenters, industry (NAICS 4523) in a given county between Q4 2019 and Q2 U.S. BLS
Employment) (Q4 2019-Q2 2020)
2020
log(Furniture Store Employment) The difference in the natural logarithm of employment in the furniture stores industry (NAICS 4421) in a
U.S. BLS
(Q4 2019-Q2 2020) given county between Q4 2019 and Q2 2020
log(Clothing Store Employment) The difference in the natural logarithm of employment in the clothing stores industry (NAICS 4481) in a
U.S. BLS
(Q4 2019-Q2 2020) given county between Q4 2019 and Q2 2020
log(Total Non-Grocery Retail The difference in the natural logarithm of employment in all retail trade industries (NAICS 44-45) except the
U.S. BLS
Employment) (Q4 2019-Q2 2020) grocery stores industry (NAICS 4451) in a given county between Q4 2019 and Q2 2020
Independent
log(Deliveries) The diffference in the natural logarithm of the number of Instacart deliveries made in a given county
Instacart
(Q4 2019-Q2 2020) between Q4 2019 and Q2 2020
log(GMV) The difference in the natural logarithm of the Gross Merchandise Value of Instacart deliveries made in a
Instacart
(Q4 2019-Q2 2020) given county between Q4 2019 and Q2 2020
log(Deliveries Q2 2020) The natural logarithm of the number of Instacart deliveries made in a given county in Q2 2020 Instacart
The natural logarithm of the Gross Merchandise Value of Instacart deliveries made in a given county in Q2
log(GMV Q2 2020) Instacart
2020
log(Non-Grocery Employment) The difference in the natural logarithm of employment in all industries except the grocery stores industry
U.S. BLS
(Q4 2019- Q2 2020) (NAICS 4451) in a given county between Q4 2019 and Q2 2020
log(Non-Grocery Employment The natural logarithm of employment in all industries except the grocery stores industry (NAICS 4451) in a
U.S. BLS
Q2 2020) given county on the last day in Q2 2020
Population density in a given county: population (BEA) in 2019 divided by land area in 2010 (U.S. Census U.S. BEA &
Population Density
Bureau) U.S. Census Bureau
Personal Income per Capita Per capita personal income in a given county in 2019 U.S. BEA
log(GDP) The natural logarithm of GDP in a given county in 2019 U.S. BEA
COVID Cases per Capita New York Times
Average COVID-19 cases per day in a given county over Q2 2020
Q2 2020 COVID-19 Data
COVID Deaths per Capita New York Times
The total number of deaths from COVID-19 in a given county in Q2 2020
Q2 2020 COVID-19 Data
As with the pre-pandemic Instacart entry and adoption analysis, Instacart adoption during the
pandemic in a county is included in the regression analysis as the log of the relevant variable. So
that counties without Instacart can be included in the analysis, the Instacart adoption variables are
again transformed by adding one to the value of each variable. Appendix 1 presents the results for
models C1-C2 where root functions are again used as alternatives to the log specification and
shows that the statistical results are highly robust. Table 4 provides summary statistics.
18TABLE 4:
SUMMARY STATISTICS FOR
COVID-19 ANALYSIS
Number of Standard
Variables Mean Median Min Max
Observations Deviation
Primary Regression Variables
Grocery Employment
852 76 30 280 -2,942 2,411
(Q4 2019-Q2 2020)
Grocery Payroll
852 1,693,657 660,875 4,604,908 -30,583,082 69,386,338
(Q4 2019-Q2 2020)
Grocery Average Weekly Wage Q2 2020 879 508 499 97 266 991
Non-Grocery Employment
851 -14,439 -3,992 39,111 -632,428 15,496
(Q4 2019- Q2 2020)
Non-Grocery Employment Q2 2020 879 107,860 41,583 220,310 253 3,295,986
Personal Income per Capita (Annual) 1,159 49,255 46,441 14,239 23,081 197,847
GDP (Annual, Thousands) 1,159 14,626,056 4,124,397 42,113,151 40,209 726,943,301
Population Density (Persons per Square Mile) 1,159 623 160 2,875 1 71,341
COVID Cases per Capita Q2 2020 1,159 0.003 0.002 0.005 0.000 0.084
COVID Deaths per Capita Q2 2020 1,159 0.013 0.005 0.024 0.000 0.269
Placebo Regression Variables
Book Store Employment
398 -97 -57 151 -1,752 369
(Q4 2019-Q2 2020)
Sporting and Hobby Employment
472 -219 -105 345 -3,222 161
(Q4 2019-Q2 2020)
General Merchandise Employment
744 4 9 353 -5,200 2,734
(Q4 2019-Q2 2020)
Furniture Store Employment
607 -58 -19 122 -1,369 296
(Q4 2019-Q2 2020)
Clothing Store Employment
733 -643 -227 1,576 -23,062 151
(Q4 2019-Q2 2020)
Total Non-Grocery Retail Employment
852 -2,142 -692 5,132 -80,950 878
(Q4 2019-Q2 2020)
Sources: See Table 3 sources. Note: The sample size of regression variables varies due to differences in data availability. Summary
statistics for Deliveries and GMV are redacted.
IV. Statistical Estimation of the Pre-Pandemic Instacart Entry and
Adoption Models
A. Employment Effects of Instacart Entry and Adoption
This section begins with estimation of the primary statistical models relating retail grocery
employment to Instacart adoption by MSA from Q1 2012 to Q4 2019. The dependent variable for
each model A1-A5 is (log) grocery employment and the independent variables of interest are the
five measures of Instacart adoption discussed in the previous section: (log) Deliveries, GMV,
Stores, Quarters Since Entry and Instacart Presence. The results are presented in Table 5.
19TABLE 5:
GROCERY EMPLOYMENT
REGRESSION MODEL ESTIMATES
VARIABLES A1 A2 A3 A4 A5
log(Deliveries) 0.004***
log(GMV) 0.003***
log(Store Count) 0.011***
log(Quarters Since Entry) 0.026***
Instacart Presence 0.027***
log(Non-Grocery Employment) 0.493*** 0.496*** 0.491*** 0.493*** 0.505***
Personal Income per Capita -0.001 -0.001 -0.002* -0.002** -0.001
log(GDP) 0.057 0.057 0.060 0.054 0.059
log(Consumer Expenditures on Food and Beverage Goods) 0.136 0.143 0.132 0.126 0.158
log(Consumer Expenditures on Food Services) 0.146 0.148 0.150 0.134 0.154
Constant -1.741 -1.863 -1.753 -1.458 -2.220
Observations 13,846 13,846 13,846 13,846 13,846
R-squared 0.148 0.148 0.148 0.151 0.146
Number of MSAs 439 439 439 439 439
MSA Fixed Effects Yes Yes Yes Yes Yes
Year Fixed Effects Yes Yes Yes Yes Yes
Quarter Fixed Effects Yes Yes Yes Yes Yes
Region-Year Fixed Effects Yes Yes Yes Yes Yes
Sources: See Table 1 sources. [1] Results indicated with a triple asterisk (***) are significant at the one percent level. [2] Results
indicated with a double asterisk (**) are significant at the five percent level. [3] Results indicated with a single asterisk (*) are
significant at the ten percent level. [4] All regressions have robust standard errors clustered by state.
As indicated in Table 5, each regression controls for total MSA-level employment excluding
grocery employment, personal income per capita, real GDP, state-level consumer expenditures on
food and beverage goods, and state-level consumer expenditures on food services. Each regression
includes 439 MSAs across the 50 U.S. states and Washington, D.C. The R-squared value
represents the “within” R-squared, and standard errors are clustered by state.
For models A1-A4, the coefficient estimates on the Instacart adoption variables in Table 5 can be
interpreted as the percentage change in grocery employment due to a one percent increase in
Instacart adoption. The results for model A1 indicate that a one percent increase in Instacart
deliveries in an MSA, all else equal, increases grocery employment by 0.004 percent. The results
for model A2 indicate that a one percent increase in Instacart GMV increases grocery employment
by 0.003 percent. The results for model A3 indicate that a one percent increase in the number of
stores served by Instacart in an MSA increases grocery employment by 0.011 percent. The results
for model A4 indicate that a one percent increase in the number of quarters since Instacart’s entry
into an MSA is associated with a 0.026 percent increase in grocery employment. The results for
model A5 indicate that, abstracting from the duration of Instacart’s presence in an MSA or the
intensity of Instacart use, Instacart entry is associated on average with a 2.7 percent increase in
grocery employment. For all five models, the coefficients on the Instacart adoption variables are
statistically significant.
To test whether the relationship between Instacart adoption and grocery employment is consistent
in direction and magnitude across different regions of the United States, in Table 6, the regressions
from Table 5 are re-estimated allowing all coefficients in the model to vary by region. The
variables of interest are the Instacart adoption terms interacted with variables representing the
major geographic regions of the United States.
20TABLE 6:
GROCERY EMPLOYMENT
REGRESSION MODEL ESTIMATES BY REGION
VARIABLES A1 A2 A3 A4 A5
log(Deliveries) 0.004***
log(Deliveries) * South 0.001
log(Deliveries) * West -0.001
log(Deliveries) * Midwest 0.000
log(GMV) 0.002***
log(GMV) * South 0.001
log(GMV) * West -0.001
log(GMV) * Midwest 0.000
log(Store Count) 0.010***
log(Store Count) * South 0.002
log(Store Count) * West -0.003
log(Store Count) * Midwest 0.002
log(Quarters Since Entry) 0.023***
log(Quarters Since Entry) * South 0.013
log(Quarters Since Entry) * West -0.010
log(Quarters Since Entry) * Midwest -0.001
Instacart Presence 0.021**
Instacart Presence * South 0.012
Instacart Presence * West -0.001
Instacart Presence * Midwest -0.001
Sources: See Table 1 sources. [1] Results indicated with a triple asterisk (***) are significant at the one percent level. [2] Results
indicated with a double asterisk (**) are significant at the five percent level. [3] Results indicated with a single asterisk (*) are
significant at the ten percent level. [4] All regressions have robust standard errors clustered by state.
In these regressions, the uninteracted Instacart adoption variable represents the effect in the East
and the coefficients on the regional interaction variables represent the difference between the
magnitude of the coefficient in the East and the coefficient in the specified region.23 That is, the
magnitude of the Instacart Effect in the South for each model is the sum of the coefficient on the
uninteracted Instacart adoption variable and the coefficient on the interaction of the Instacart
adoption variable and an indicator variable for the South. Specifying the models in this way allows
for a direct test of whether the regional differences are statistically significant based on the
individual coefficients of the regional interaction variables. Across all five models, there are no
statistically significant differences across regions. These results support two conclusions: (1) that
the Instacart Effect is a national phenomenon, and (2) that it is reasonable to use the pooled (non-
regional) Instacart adoption coefficients estimated in Table 5 for the purposes of quantifying the
economic impacts generated by Instacart both nationally and locally. Thus, the regional economic
impacts presented in Figures 3 and 4 in Section II are calculated using the pooled coefficient
estimates from Table 5.
To provide further evidence for a causal interpretation of the results, each model is subjected to
six placebo tests. For these tests, each model is estimated by replacing the dependent variable,
grocery industry employment, with employment in the book store, sporting goods and hobby store,
23
Because the models in Table 6 are estimated with regional interaction terms for all variables including the
controls, the coefficient estimates reported above are independent of which region is chosen as the base category.
21You can also read