Saliva is more sensitive than nasopharyngeal or nasal swabs for diagnosis of asymptomatic and mild COVID 19 infection - Nature
←
→
Page content transcription
If your browser does not render page correctly, please read the page content below
www.nature.com/scientificreports
OPEN Saliva is more sensitive
than nasopharyngeal
or nasal swabs for diagnosis
of asymptomatic and mild
COVID‑19 infection
Alvin Kuo Jing Teo 1, Yukti Choudhury2, Iain Beehuat Tan 3,4,5, Chae Yin Cher2,
Shi Hao Chew6, Zi Yi Wan2, Lionel Tim Ee Cheng7, Lynette Lin Ean Oon8, Min Han Tan2,
Kian Sing Chan8 & Li Yang Hsu1,9*
We aimed to test the sensitivity of naso-oropharyngeal saliva and self-administered nasal (SN) swab
compared to nasopharyngeal (NP) swab for COVID-19 testing in a large cohort of migrant workers in
Singapore. We also tested the utility of next-generation sequencing (NGS) for diagnosis of COVID-19.
Saliva, NP and SN swabs were collected from subjects who presented with acute respiratory infection,
their asymptomatic roommates, and prior confirmed cases who were undergoing isolation at a
community care facility in June 2020. All samples were tested using RT-PCR. SARS-CoV-2 amplicon-
based NGS with phylogenetic analysis was done for 30 samples. We recruited 200 subjects, of which 91
and 46 were tested twice and thrice respectively. In total, 62.0%, 44.5%, and 37.7% of saliva, NP and
SN samples were positive. Cycle threshold (Ct) values were lower during the earlier period of infection
across all sample types. The percentage of test-positive saliva was higher than NP and SN swabs. We
found a strong correlation between viral genome coverage by NGS and Ct values for SARS-CoV-2.
Phylogenetic analyses revealed Clade O and lineage B.6 known to be circulating in Singapore. We
found saliva to be a sensitive and viable sample for COVID-19 diagnosis.
The severe acute respiratory syndrome coronavirus 2 (SARS-CoV-2) emerged from Wuhan, China, in November
20191, and has since caused a global pandemic, with over 25 million confirmed COVID-19 cases and 850,000
deaths as of 1st September 20202. Singapore has since recorded over 56,000 cases and 27 deaths since the first case
was reported on 23rd January 2020, the majority of cases being migrant workers living in crowded d ormitories3.
Acute coronavirus disease 2019 (COVID-19) is primarily diagnosed via reverse transcription-polymerase
chain reaction (RT-PCR) detection of viral genetic material. However, considering the three primary modes of
transmission of SARS-Cov-2 i.e., contact, droplet and aerosol routes, various types of samples have been sug-
etection4. In Singapore and several other countries, nasopharyngeal (NP) swabs are
gested for the purpose of d
the principal means for collecting specimens for testing5,6. However, the collection procedure for NP swabs can
cause discomfort and require trained healthcare staff to perform.
Saliva and self-administered nasal (SN) swabs are, in many ways, ideal specimens for COVID-19 screening.
Both can be collected safely without the need for trained staff. The utility of saliva for COVID-19 testing has
been tested in multiple territories and countries7–15. The majority of current published studies involve relatively
small numbers of subjects. A meta-analysis suggests that saliva is at best slightly less sensitive or similar to other
1
Saw Swee Hock School of Public Health, National University of Singapore, National University Health
System, #10‑01, 12 Science Drive 2, Singapore 117549, Singapore. 2Lucence Diagnostics, Singapore,
Singapore. 3Department of Medical Oncology, National Cancer Centre, Singapore, Singapore. 4Duke‑NUS
Graduate Medical School, National University of Singapore, Singapore, Singapore. 5Genome Institute of
Singapore, Singapore, Singapore. 6Headquarters Army Medical Services, Singapore Armed Forces, Singapore,
Singapore. 7Department of Diagnostic Radiology, Singapore General Hospital, Singapore, Singapore. 8Department
of Molecular Pathology, Singapore General Hospital, Singapore, Singapore. 9Yong Loo Lin School of Medicine,
National University of Singapore, National University Health System, Singapore, Singapore. *email: mdchly@
nus.edu.sg
Scientific Reports | (2021) 11:3134 | https://doi.org/10.1038/s41598-021-82787-z 1
Vol.:(0123456789)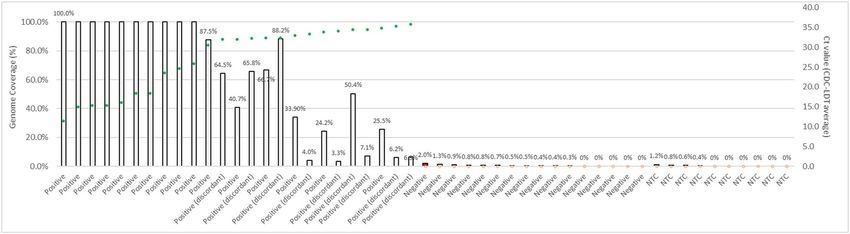
www.nature.com/scientificreports/
specimens, including NP s wabs16. However, one caveat relates to how saliva is collected—saliva is a complex
bio-mixture which can consist of salivary gland secretion, gingival crevicular fluid, sputum and/or mucosal
transudate, in varying proportions depending on collection method. Some studies tested only secretions from
the mouth11,12, others explicitly tested “posterior oropharyngeal” or “deep throat” saliva with secretions from the
oropharynx7–10, while the rest were unspecified13–16.
We aimed to test the sensitivity of “naso-oropharyngeal” saliva and SN swabs compared to NP swabs in a
large cohort of migrant workers in Singapore using RT-PCR testing. We additionally used direct-from-RNA
amplicon-based next-generation sequencing (NGS) for confirmatory detection of low-level SARS-CoV-2 signal
and to establish phylogeny for tested samples.
Methods
Study population. Subjects were recruited between 2nd and 26th June 2020 from two sites—a 5400-bed
purpose-built dormitory where migrant workers were housed in large rooms holding 7–20 workers, and a com-
munity care facility (CCF) where migrant workers diagnosed with COVID-19 but not requiring acute hospital
care were sent for isolation and monitoring. All subjects at the CCF are prior confirmed cases (via RT-PCR),
while subjects from the dormitory comprised two groups—(1) migrant workers presenting with symptoms of
acute respiratory tract infection (ARI); and (2) asymptomatic roommates of newly diagnosed COVID-19 cases.
Ethics statement. This study was approved by the Director of Medical Services, Ministry of Health, under
Singapore’s Infectious Disease Act17. Under this Act, in the event of a major outbreak, the Director may require
the obtainment of such information or samples (including human samples) as deemed appropriate or necessary
that will be of significant public health benefit to the c ountry17. Informed consent was obtained from all partici-
pants, and all methods were performed in accordance to Singapore guidelines and regulations for biomedical
research.
Sample collection. Migrant workers from the purpose-built dormitory presenting with ARI were assessed
by physicians at the medical post, who made the decision for whether diagnostic NP swabs for COVID-19 test-
ing was necessary. Those workers requiring NP swabs were immediately approached for study participation, and
consent was taken where agreeable.
For the collection of SN swabs, participants were instructed to insert the swab (about 1 cm) into their nos-
trils (one at a time), tilt their head back slightly, and rotate the swab in a circular motion for 3 times around the
nasal wall. The swab was then inserted into the collection tube. For the collection of naso-oropharyngeal saliva
samples, participants were asked to tilt their head back slightly, clear their throat and nose, and spit the saliva
into the collection bottle. The steps were repeated until the required volume (2 mL) was achieved. For “naso-
oropharyngeal” saliva collection, instructional videos (video link in English: https://youtu.be/4jGrJUbjBBs) in
the major native languages of the migrant workers were shown, following which these samples were collected
under the supervision of a trained researcher.
For consenting subjects from CCF and asymptomatic roommates of newly diagnosed cases at the dormitory,
NP swab collection procedure was performed by a trained researcher. SN swab and saliva samples were collected
in the same sitting.
Each subject was tested up to three times at 2–3-days interval where possible, in order to compare the sen-
sitivity of different samples across time. Subjects from the purpose-built dormitory who tested negative across
all three samples during the first round of testing were not retested. Subjects from the CCF were not retested if
all samples from the initial two rounds were negative.
NP swabs from subjects with ARI were sent dry in cooler boxes to the Singapore General Hospital (SGH)
molecular laboratory as part of routine clinical testing. NP swabs and self-administered nasal swabs from other
subjects were sent in 3 mL of viral transport medium, while up to 2 mL of saliva was collected in a container with
2 mL of viral RNA stabilization fluid (SAFER-Sample Stabilization Fluid, Lucence, Singapore) before transfer to
Lucence. All samples were processed within the same day. Both service laboratories are the College of American
Pathologists (CAP) accredited, and Lucence is CLIA-licensed.
Laboratory testing. RT-PCR at SGH was performed using the automated cobas 6800 system (Roche,
Branchburg, NJ, USA) on an automated cobas 6800 system, with results inferred according to the manufac-
turer’s specifications. NP and saliva samples sent to Lucence Laboratory underwent RNA extraction (200 μL of
the sample) (GeneAid Biotech Ltd) and were tested with a laboratory-developed RT-PCR test (CDC-LDT) based
on primers published by the Division of Viral Diseases, National Center for Immunization and Respiratory
Diseases, Centers for Disease Control and Prevention, Atlanta, GA, USA18, while saliva and SN swabs were addi-
tionally tested using the Fortitude 2.1 kit (MiRXES, Singapore). The analytical limit of detection of the CDC-
LDT was determined to be 25 copies per reaction based on a synthetic SARS-CoV-2 genome (Twist Bioscience).
Saliva was pre-processed with the addition of dithiothreitol (DTT) at 0.4–0.85% of total sample volume, vortex-
ing, and incubation at room temperature for 15 min. Solubilization was visibly apparent post-treatment at room
temperature and RNA was extracted immediately post-treatment.
A limited number of samples was selected for the initial stage of determining performance specifications for
a NGS-based SARS-CoV-2 assay. Both saliva and SN swab samples were included to demonstrate compatibility
of RNA extracts from samples collected in the viral RNA stabilization fluid. Thirty samples were selected includ-
ing high and low viral load samples, and those that had discordant results from the two RT-PCR assays. Six of
the 30 samples were paired sets of saliva and SN swab samples from the same time point for 3 individuals, and
Scientific Reports | (2021) 11:3134 | https://doi.org/10.1038/s41598-021-82787-z 2
Vol:.(1234567890)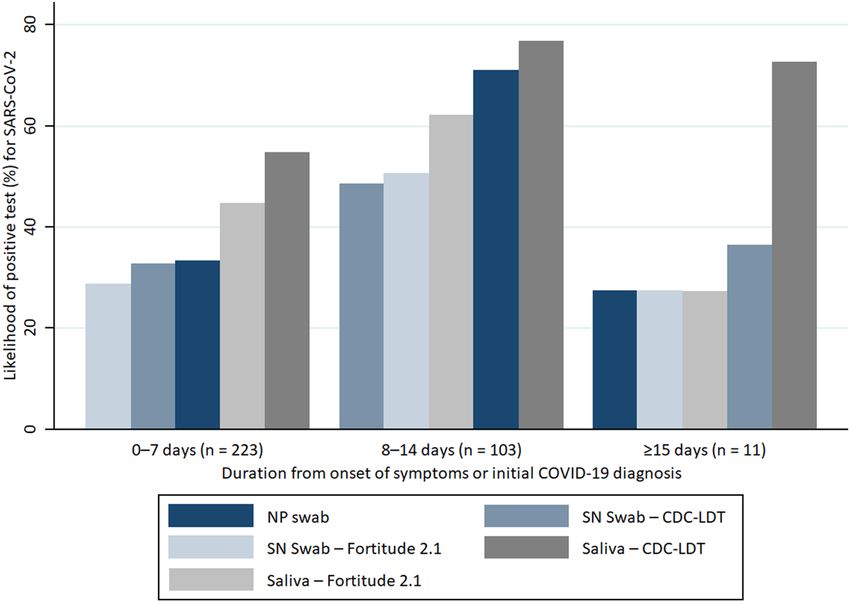
www.nature.com/scientificreports/
Characteristics Purpose-built dormitory (n = 149) CCF (n = 51)
Male sex (%) 149 (100) 51 (100)
Median age (IQR), years 32 (28–37) 38 (36–41)
Symptomatic (%) 45 (30.2) 43 (84.3)
Number of subjects tested
Round 1 149 51
Round 2 40 51
Round 3 1 45
Number of symptomatic subjects with any positive test (%)
Round 1 30/74 (40.5) 37/42 (88.1)
Round 2 15/32 (46.9) 37/41 (90.2)
Round 3 0 (0) 37/41 (90.2)
Number of asymptomatic subjects with any positive test (%)
Round 1 44/74 (59.5) 5/42 (11.9)
Round 2 17/32 (53.1) 4/41 (9.8)
Round 3 1/1 (100) 4/41 (9.8)
Median (IQR) duration from symptom onset to test date, days—symptomatic subjects
Round 1 3 (2–4) 7 (6–8)
Round 2 5 (4–6) 10 (9–11)
Round 3 – 13 (12–14)
Median (IQR) duration from date of initial diagnosisa to test date, days—asymptomatic subjects
Round 1 0 (0–0) 5.5 (5–6)
Round 2 4 (3–6) 8.5 (8–9)
Round 3 11 (11) 11.5 (11–12)
Table 1. Characteristics of recruited subjects. CCF community care facility, IQR interquartile range. a For
asymptomatic subjects recruited at the purpose-built dormitory, all three samples (nasopharyngeal, self-
administered nasal, and saliva) were taken at the same time during round 1. For asymptomatic subjects
recruited at CCF, subjects were diagnosed with COVID-19 via prior RT-PCR testing and only two samples
(self-administered nasal and saliva) were taken during round 1.
6 samples (4 saliva, 2 SN swabs) were collected at different time points from 3 other individuals. The remaining
18 samples comprised 10 saliva, 7 SN swab, and 1 NP swab sample from individual patients.
SARS-CoV-2 amplicon-based NGS was done using 330 primer pairs to generate amplicons (size range
130–178 bp) covering the entire virus genome (except the first 25 bases and 30 bases upstream of the final
polyA tail) to establish a direct-from-sample workflow. To rule out potential non-specific amplification of other
viruses related in sequence, all amplicons were verified to have limited similarity to sarbecoviruses, outside of
SARS-related coronaviruses (assumed not to be present in circulation). The threshold coverage (%) for making
positive call by NGS was established by performing NGS on 5 negative (by RT-PCR) samples from this study,
11 negative NP swab samples from community testing, and 10 no-template controls (NTC). For samples with
complete viral genomes (100% coverage ≥ 1 × coverage), phylogenetic analysis was performed to identify lineages
based on sequence variants.
Statistical methods. We described our data using frequencies/percentages and median/interquartile
range. We assessed the comparability between sampling methods using kappa-statistic and percent agreement.
STATA 13.1 (StataCorp, Texas, USA) was used for all statistical calculations.
Results
We recruited 200 subjects—149 from the dormitory and 51 from CCF. There were 45 subjects with ARI and
104 asymptomatic close contacts recruited from the purpose-built dormitory, while 51 subjects with confirmed
COVID-19 (8 asymptomatic at the time of diagnosis) were recruited at the CCF (Table 1).
Of 200 subjects, 91 and 46 completed second and third rounds of testing, respectively, resulting in 337 sets of
tests (Table 2). Because COVID-19-positive migrant workers were rapidly transferred out of dormitories to CCFs,
all but one subject from the dormitory site did not complete the planned testing. The median time period between
the date of diagnosis and the first round of testing in asymptomatic subjects was 0 days (range 0–6 days), while
the median time period between symptom onset and the first round of testing was 5.5 days (range 0–28 days).
In total, there were 209 (62.0%) positive saliva tested via CDC-LDT, 167 (49.6%) positive saliva tested via
Fortitude 2.1, 150 (44.5%) positive NP swabs tested via cobas SARS-CoV-2 or CDC-LDT, 127 (37.7%) positive
SN swabs tested via CDC-LDT, and 119 (35.3%) positive SN swabs tested via Fortitude 2.1. Cycle threshold (Ct)
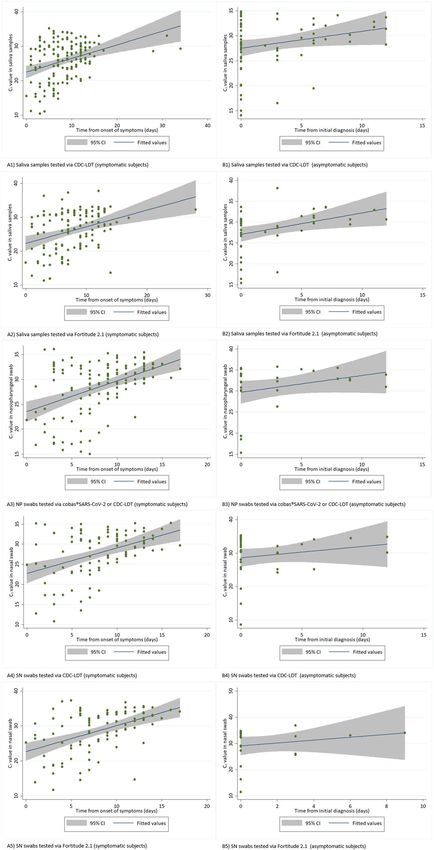
values were lower during the earlier period of infection across all sample types, predominantly for symptomatic
infections where the onset of illness could be better estimated (Fig. 1). The likelihood of a positive saliva test
was higher than NP and SN from samples collected within weeks 1 and 2 from initial diagnosis. The percentage
Scientific Reports | (2021) 11:3134 | https://doi.org/10.1038/s41598-021-82787-z 3
Vol.:(0123456789)www.nature.com/scientificreports/
Tests on symptomatic individuals (n = 188) Tests on asymptomatic individuals (n = 149)
Positive results, n (%)
Saliva—CDC-LDT 145 (77.1) 64 (43.0)
Saliva—Fortitude 2.1 123 (65.4) 44 (29.5)
NP swab—CDC-LDT 123 (65.4) 27 (18.1)
SN swab—CDC-LDT 96 (51.1) 31 (20.8)
SN swab—Fortitude 2.1 98 (52.1) 21 (14.1)
Concordance of results among NP swabs (CDC-LDT), SN swabs (CDC-LDT), and saliva (CDC-LDT), n (%)
Saliva only positive 24 (12.8) 35 (23.5)
NP swab only positive 6 (3.2) 1 (0.7)
SN swab only positive 2 (1.1) 8 (5.4)
Saliva and NP swab positive 29 (15.4) 8 (5.4)
NP and SN swab positive 2 (1.1) 2 (1.3)
Saliva and SN swab positive 6 (3.2) 5 (3.4)
All three swabs positive in-tandem 86 (45.7) 16 (10.7)
Concordance of results among NP swabs (CDC-LDT), SN swabs (Fortitude 2.1), and saliva (CDC-LDT), n (%)
Saliva only positive 25 (13.3) 39 (26.2)
NP swab only positive 5 (2.7) 1 (0.7)
SN swab only positive 1 (0.5) 4 (2.7)
Saliva and NP swab positive 26 (13.8) 10 (6.7)
NP and SN swab positive 3 (1.6) 2 (1.3)
Saliva and SN swab positive 5 (2.7) 1 (0.7)
All three swabs positive in-tandem 89 (47.3) 14 (9.4)
Concordance of results among NP swabs (CDC-LDT), SN swabs (CDC-LDT), and saliva (Fortitude 2.1), n (%)
Saliva only positive 14 (7.5) 20 (13.4)
NP swab only positive 12 (6.4) 4 (2.7)
SN swab only positive 4 (2.1) 9 (6.0)
Saliva and NP swab positive 22 (11.7) 5 (3.4)
NP and SN swab positive 6 (3.2) 3 (2.0)
Saliva and SN swab positive 4 (2.1) 4 (2.7)
All three swabs positive in-tandem 82 (43.6) 15 (10.1)
Concordance of results among NP swabs (CDC-LDT), SN swabs (Fortitude 2.1), and saliva (Fortitude 2.1), n (%)
Saliva only positive 14 (7.5) 23 (15.4)
NP swab only positive 9 (4.8) 5 (3.4)
SN swab only positive 2 (1.1) 4 (2.7)
Saliva and NP swab positive 21 (11.2) 6 (4.0)
NP and SN swab positive 8 (4.3) 2 (1.3)
Saliva and SN swab positive 4 (2.1) 1 (0.7)
All three swabs positive in-tandem 84 (44.7) 14 (9.4)
Table 2. Results of RT-PCR testing on samples. NP nasopharyngeal, SN self-administered nasal, CDC-LDT
Centers for Disease Control and Prevention-Laboratory Developed Test.
testing positive for SARS-CoV-2 from any samples fell beyond 14 days of symptom onset in symptomatic sub-
jects or from initial diagnosis for asymptomatic subjects, although this was less significant for saliva tested via
CDC-LDT (Fig. 2).
For 63 positive NP swabs with low Ct (< 30) values (the lower results of the two targets), saliva was posi-
tive in 62 (98.4%) and 61 (96.8%) samples, while SN swabs were concomitantly positive in 57 (90.5%) and 60
(95.2%) samples when tested via CDC-LDT and Fortitude 2.1, respectively. For 87 positive NP swabs with high
Ct (≥ 30) values, saliva was positive in 77 (88.5%) and 64 (73.6%) samples, while SN swabs were concomitantly
positive in 49 (56.3%) and 48 (55.2%) samples, respectively. The likelihood of concordant positive tests in other
samples was also high when Ct values were low (< 30) in saliva tested via CDC-LDT—76.9% of NP swabs, 64.0%
of SN swabs tested via CDC-LDT, and 62.6% of SN swabs tested via Fortitude 2.1 were concomitantly positive.
However, only 41.9% of NP swabs, 30.7% of SN swabs tested via CDC-LDT, and 27.4% of SN swabs tested via
Fortitude 2.1 were positive in-tandem with saliva samples tested via CDC-LDT when Ct values were high (≥ 30).
Test concordances between different sample sites were relatively good, with the kappa statistic of 0.616 for
NP and SN swabs tested via CDC-LDT (agreement of 81.3%), 0.675 for NP tested via CDC-LDT and SN swabs
tested via Fortitude 2.1 (agreement of 84.3%), 0.537 for saliva and NP tested via CDC-LDT (76.2%), and 0.602 for
Scientific Reports | (2021) 11:3134 | https://doi.org/10.1038/s41598-021-82787-z 4
Vol:.(1234567890)www.nature.com/scientificreports/
Figure 1. RT-PCR cycle threshold (Ct) values of naso-oropharyngeal saliva samples, nasopharyngeal (NP) swabs, and self-
administered nasal (SN) swabs obtained from subjects infected with SARS-CoV-2. (A) (left) shows the cycle threshold (Ct) values
of samples obtained from symptomatic subjects over time since the onset of symptoms. (B) (right) shows the Ct values of samples
obtained from asymptomatic subjects over time since the initial COVID-19 diagnosis. Saliva samples and SN swabs were tested via
CDC-LDT and Fortitude 2.1. All NP swabs were tested via cobas severe acute respiratory syndrome coronavirus 2 (SARS-CoV-2)
(Roche Molecular Systems, Branchburg, NJ) or Centers for Disease Control and Prevention-Laboratory Developed Test (CDC-LDT).
Scientific Reports | (2021) 11:3134 | https://doi.org/10.1038/s41598-021-82787-z 5
Vol.:(0123456789)www.nature.com/scientificreports/
Figure 2. Likelihood of test positivity over time in confirmed COVID-19 subjects. The figure shows the
likelihood of positivity for SARS-CoV-2 for nasopharyngeal (NP) swabs, self-administered nasal (SN) swabs,
and naso-oropharyngeal saliva samples collected at 0–7 days, 8–14 days, and ≥ 15 days from the onset of
symptoms (symptomatic subjects) or initial COVID-19 diagnosis (asymptomatic subjects). NP swabs were
tested using via cobas SARS-CoV-2 or Centers for Disease Control and Prevention-Laboratory Developed Test
(CDC-LDT).
saliva tested via Fortitude 2.1 and NP tested via CDC-LDT (80.1%). Test concordances were excellent between
the two saliva (87.2%) and SN swabs (91.0%) tests, with a kappa statistic of 0.745 and 0.806, respectively.
Among 30 samples (saliva, NP and SN swabs) tested by NGS, there was a strong correlation between viral
genome coverage by NGS and Ct values for SARS-CoV-2. Ten samples showed 100% coverage (7 unique subjects)
(Fig. 3). Ten samples (4 saliva, 6 SN swabs) with discordant results between the 2 RT-PCR tests (CDC-LDT posi-
tive, Fortitude negative) were positive by NGS. Phylogenetic analyses of sequences of SARS-CoV-2 viral RNA
from high-coverage saliva samples of the 7 unique subjects showed Clade O by GISAID n omenclature19 and
20
lineage B.6 by PANGOLIN system of n omenclature .
Discussion
Our study is concordant with multiple published works supporting saliva as an alternative sample for COVID-19
screening and d iagnosis7–15, and one of a minority where saliva was shown to be more sensitive than the cor-
responding NP s wab8,9,13, although the results by Leung et al. (53.7% saliva vs. 47.4% NP swab, 95 subjects) were
not statistically d ifferent8. Several reasons may account for this difference in the studies, including enrichment
from nasal and oropharyngeal secretions, where the viral load is potentially h igher8,9, or a higher volume of
samples collection, where approximately 10 mL of saliva was collected for testing13. Steps were taken to minimize
biases and errors—NP swabs performed by trained healthcare staff, environmental testing of CAP-accredited
laboratory (no evidence of contamination), conduction of tests for most of the samples in the same laboratory,
and pre-processing of saliva samples with dithiothreitol before RNA extraction to resolve the issues of saliva
specimen viscosity, which can lead to false negatives.
Interestingly but perhaps unsurprisingly, the use of different RT-PCR kits in the present study resulted in dif-
ferent test-positive rates in saliva, suggesting that this can potentially be an important consideration for clinical
laboratories, where more sensitive laboratory protocols should be deployed for clinical diagnosis as opposed
to mass screening for low-prevalence populations. More validation would be required to confirm this finding.
SN swabs, however, appeared less sensitive compared to both saliva and NP swabs for the diagnosis of
COVID-19. Although it was convenient, less time-consuming to perform relative to saliva collection, and caused
less discomfort compared to NP swabs, the markedly lower sensitivity should preclude its use where other sample
types can be collected.
In our study, NGS provided efficient whole-genome profiling of SARS-CoV-2 for phylogenetic analysis
directly from the clinical samples without culture. NGS detection sensitivity was excellent with a threshold of
1.7% genome coverage or 5 amplicons targets, confirming all CDC-LDT positives tested. Other groups have
reported highly sensitive performance for NGS with limits of detection ranging between a threshold of 5%
genome coverage or 84 genome-equivalents per mL21, or at least 5 SARS-CoV-2 targets for detection22. The
phylogeny results were consistent with the virus belonging to a viral type (Clade O, lineage B.6) known to be
circulating in the geographical regions of Singapore and India.
Scientific Reports | (2021) 11:3134 | https://doi.org/10.1038/s41598-021-82787-z 6
Vol:.(1234567890)www.nature.com/scientificreports/
Figure 3. Correlation between viral genome coverage (%) by next generation sequencing (NGS) and cycle
threshold (Ct) values for SARS CoV-2. NGS is a sensitive method of detecting low-level SARS-CoV-2 virus in
clinical samples, and coverage (%) of the genome is correlated to the Ct value determined by RT-PCR. Thirty
samples (17 saliva and 11 SN swabs and 1 NP swab) were tested by NGS. Ten samples (4 saliva, 6 SN swabs)
with discordant results from the RT-PCR tests were confirmed to be positive by NGS (median genome coverage
29.7%, range 3.3–88.2%). Genome coverage (%) is defined as the proportion of the SARS-CoV-2 genome that
has > 1× depth of coverage. The threshold coverage (%) for making positive call by NGS was established by
running 5 negatives (by RT-PCR) samples from this study, 11 negative NP swab samples from community
testing, and 10 no-template controls (NTC). The threshold was determined to be the detection of 5 amplicons,
which corresponds to a coverage of ~ 1.7% of the SARS-CoV-2 genome. Among five negatives (by both RT-PCR
methods) saliva samples, one saliva sample was called positive by NGS (red bar) with a genome coverage of
2.0%. This sample was from a patient with RT-PCR positive NP swab and nasal swab samples collected at the
same time, raising the possibility of a low-level signal detected on NGS. Ct values for samples with positive calls
(by either or both Fortitude 2.1 and CDC-LDT RT-PCR assays) are represented on the graph with green circles,
and samples negative for SARS-CoV-2 (by both RT-PCR tests) and NTC are represented as open circles. Average
Ct values (of 2 targets) or single Ct value (when only 1 target was detected) from the CDC-LDT assay are plotted
on the secondary axis.
There are several limitations to our work. Firstly, the study population was confined to young and middle-aged
men who were either asymptomatic or had mild disease. The results cannot be extrapolated to other populations
(e.g., paediatric), where there is a clear need for alternate sample types to NP swabs. Secondly, we did not extend
the follow-up testing sufficiently to determine when saliva viral shedding stopped for the majority of subjects,
although this has been explored in other studies7,10. Thirdly, we did not test for the difference, if any, between
saliva obtained from naso-oropharyngeal or the mouth alone, although it is biologically plausible that the latter
would result in lower sensitivity for COVID-19 diagnosis16.
In conclusion, our study adds to the body of evidence supporting saliva as a sensitive and less intrusive sam-
ple for COVID-19 diagnosis and further defines the role of naso-oropharyngeal secretions and the impact of
different RT-PCR kits in increasing the sensitivity of testing. In our study, SN swabs were inferior to both saliva
and NP swabs. Our study also provides evidence to support NGS in challenging samples for sensitive COVID-
19 molecular diagnosis. Such an NGS workflow can also provide direct-from-sample phylogenetic analysis for
public health decision-making, such as contact tracing.
Received: 23 September 2020; Accepted: 22 December 2020
References
1. World Health Organization. Novel Coronavirus (2019-nCoV) Situation Report (2020). https://www.who.int/docs/default-source/
coronaviruse/situation-reports/20200121-sitrep-1-2019-ncov.pdf. Accessed 1 September 2020.
2. Worldometer. COVID-19 Coronavirus Pandemic (2020). https://www.worldometers.info/coronavirus/#countries. Accessed 1 Sep-
tember 2020.
3. Ministry of Health Singapore. COVID-19 Situation Report (2020). https://covidsitrep.moh.gov.sg/. Accessed 1 September 2020.
4. Priyanka, Choudhary, O. P., Singh, I. & Patra, G. Aerosol transmission of SARS-CoV-2: The unresolved paradox. Travel Med. Infect.
Dis. 37, 101869 (2020).
5. Young, B. E. et al. Epidemiologic features and clinical course of patients infected with SARS-CoV-2 in Singapore. JAMA. https://
doi.org/10.1001/jama.2020.3204 (2020).
6. Centers for Disease Control and Prevention. Information for Laboratories about Coronavirus (COVID-19). In Centers for Disease
Control and Prevention (2020). https://www.cdc.gov/coronavirus/2019-ncov/lab/guidelines-clinical-specimens.html. Accessed 15
July 2020.
7. To, K.K.-W. et al. Temporal profiles of viral load in posterior oropharyngeal saliva samples and serum antibody responses during
infection by SARS-CoV-2: An observational cohort study. Lancet. Infect. Dis 20, 565–574 (2020).
8. Leung, E. C., Chow, V. C., Lee, M. K. & Lai, R. W. Deep throat saliva as an alternative diagnostic specimen type for the detection
of SARS-CoV-2. J. Med. Virol. https://doi.org/10.1002/jmv.262 (2020).
9. Wong, S. C. Y. et al. Posterior oropharyngeal saliva for the detection of severe acute respiratory syndrome coronavirus 2 (SARS-
CoV-2). Clin. Infect. Dis. 71, 2939. https://doi.org/10.1093/cid/ciaa797 (2020).
Scientific Reports | (2021) 11:3134 | https://doi.org/10.1038/s41598-021-82787-z 7
Vol.:(0123456789)www.nature.com/scientificreports/
10. Zheng, S. et al. Viral load dynamics and disease severity in patients infected with SARS-CoV-2 in Zhejiang province, China, Janu-
ary–March 2020: Retrospective cohort study. BMJ 369, m1443 (2020).
11. Azzi, L. et al. Saliva is a reliable tool to detect SARS-CoV-2. J. Infect. 81, e45–e50 (2020).
12. Williams, E., Bond, K., Zhang, B., Putland, M. & Williamson, D. A. Saliva as a noninvasive specimen for detection of SARS-CoV-2.
J. Clin. Microbiol. https://doi.org/10.1128/JCM.00776-20 (2020).
13. Wyllie, A. L. et al. Saliva is more sensitive for SARS-CoV-2 detection in COVID-19 patients than nasopharyngeal swabs. MedRXiV.
https://doi.org/10.1101/2020.04.16.20067835 (2020).
14. Jamal, A. J. et al. Sensitivity of nasopharyngeal swabs and saliva for the detection of severe acute respiratory syndrome coronavirus
2. Clin. Infect. Dis. https://doi.org/10.1093/cid/ciaa848 (2020).
15. Nagura-Ikeda, M. et al. Clinical evaluation of self-collected saliva by RT-qPCR, direct RT-qPCR, RT-LAMP, and a rapid antigen
test to diagnose COVID-19. J. Clin. Microbiol. https://doi.org/10.1128/JCM.01438-20 (2020).
16. Czumbel, L. M. et al. Saliva as a candidate for COVID-19 diagnostic testing: A meta-analysis. Front. Med. https://doi.org/10.3389/
fmed.2020.00465(2020).
17. Singapore Statutes Online, Government of Singapore. Infectious Diseases Act. Chapter 137 (1977).
18. Centers for Disease Control and Prevention. Research use only 2019-novel coronavirus (2019-nCoV) real-time RT-PCR primers
and probes. In Centers for Disease Control and Prevention (2020). https://www.cdc.gov/coronavirus/2019-ncov/lab/rt-pcr-panel
-primer-probes.html. Accessed 15 July 2020.
19. Han, A. X., Parker, E., Scholer, F., Maurer-Stroh, S. & Russell, C. A. Phylogenetic clustering by linear integer programming (Phy-
CLIP). Mol. Biol. Evol. 36, 1580–1595 (2019).
20. Rambaut, A. et al. A dynamic nomenclature proposal for SARS-CoV-2 lineages to assist genomic epidemiology. Nat. Microbiol.
https://doi.org/10.1038/s41564-020-0770-5 (2020).
21. Hilaire, B. G. S. et al. A rapid, low cost, and highly sensitive SARS-CoV-2 diagnostic based on whole genome sequencing. BioRxiv.
https://doi.org/10.1101/2020.04.25.061499 (2020).
22. Bhoyar, R. C. et al. High throughput detection and genetic epidemiology of SARS-CoV-2 using COVIDSeq next generation
sequencing. BioRxiv. https://doi.org/10.1101/2020.08.10.242677 (2020).
Acknowledgements
We would like to thank S Siva Ranjini and Lenny Indrawati of Saw Swee Hock School of Public Health; the
Department of Hepatopancreatobiliary and Transplant Surgery, SGH; Woodlands Health Campus; and the Sin-
gapore Armed Forces Medical Corps for supporting and facilitating the work at the purpose-built dormitory
and CCF. We are also very grateful for the support and patience of the migrant workers who participated in this
study and acknowledge the uncertainty and difficulties they have experienced as a consequence of COVID-19.
Author contributions
L.Y.H. and M.H.T. conceived the project and obtained funding. I.B.T., L.T.E.C. and S.H.C. facilitated operation-
alization and site setup. L.Y.H. and A.K.J.T. recruited study participants, collected data and samples. Y.C., C.Y.C.,
Z.Y.W., L.L.E.O., K.S.C. and M.H.T. analysed the samples. L.Y.H., A.K.J.T., M.H.T. and Y.C. performed data and
statistical analyses. L.Y.H., Y.C. and M.H.T. drafted the manuscript. All authors participated in reviewing and
editing the manuscript.
Funding
This work was supported by a grant from the Changi Airport Group. Fortitude 2.1 kits were provided by the
Diagnostics Development Hub (DxD Hub), A*ccelerate, Agency for Science, Technology and Research, Singa-
pore. The study sponsor had no role in the design, implementation, analysis or write‐up of the study.
Competing interests
The authors declare no competing interests.
Additional information
Correspondence and requests for materials should be addressed to L.Y.H.
Reprints and permissions information is available at www.nature.com/reprints.
Publisher’s note Springer Nature remains neutral with regard to jurisdictional claims in published maps and
institutional affiliations.
Open Access This article is licensed under a Creative Commons Attribution 4.0 International
License, which permits use, sharing, adaptation, distribution and reproduction in any medium or
format, as long as you give appropriate credit to the original author(s) and the source, provide a link to the
Creative Commons licence, and indicate if changes were made. The images or other third party material in this
article are included in the article’s Creative Commons licence, unless indicated otherwise in a credit line to the
material. If material is not included in the article’s Creative Commons licence and your intended use is not
permitted by statutory regulation or exceeds the permitted use, you will need to obtain permission directly from
the copyright holder. To view a copy of this licence, visit http://creativecommons.org/licenses/by/4.0/.
© The Author(s) 2021
Scientific Reports | (2021) 11:3134 | https://doi.org/10.1038/s41598-021-82787-z 8
Vol:.(1234567890)You can also read