CAPITALAND INTEGRATED COMMERCIAL TRUST - Citi Virtual Global Property CEO Conference 2021 9 and 10 March 2021
←
→
Page content transcription
If your browser does not render page correctly, please read the page content below
CAPITALAND INTEGRATED COMMERCIAL TRUST
Citi Virtual Global Property CEO Conference 2021
9 and 10 March 2021
Disclaimer
This presentation may contain forward-looking statements. Actual future performance, outcomes and results may differ materially from those
expressed in forward-looking statements as a result of a number of risks, uncertainties and assumptions. Representative examples of these factors
include (without limitation) general industry and economic conditions, interest rate trends, cost of capital and capital availability, availability of real
estate properties, competition from other developments or companies, shifts in customer demands, shifts in expected levels of occupancy rate,
property rental income, charge out collections, changes in operating expenses (including employee wages, benefits and training, property
operating expenses), governmental and public policy changes and the continued availability of financing in the amounts and the terms necessary
to support future business.

You are cautioned not to place undue reliance on these forward-looking statements, which are based on the current view of management
regarding future events. No representation or warranty expressed or implied is made as to, and no reliance should be placed on, the fairness,
accuracy, completeness or correctness of the information or opinions contained in this presentation. Neither CapitaLand Integrated Commercial
Trust Management Limited (“Manager”) nor any of its affiliates, advisers or representatives shall have any liability whatsoever (in negligence or
otherwise) for any loss howsoever arising, whether directly or indirectly, from any use, reliance or distribution of this presentation or its contents or
otherwise arising in connection with this presentation.

The past performance of CapitaLand Integrated Commercial Trust (“CICT”) is not indicative of future performance. The listing of the units in the CICT
(“Units”) on the Singapore Exchange Securities Trading Limited (the “SGX-ST”) does not guarantee a liquid market for the Units. The value of the Units
and the income derived from them may fall as well as rise. Units are not obligations of, deposits in, or guaranteed by, the Manager or any of its
affiliates. An investment in the Units is subject to investment risks, including the possible loss of the principal amount invested. Investors have no right
to request that the Manager redeem or purchase their Units while the Units are listed on the SGX-ST. It is intended that holders of Units may only deal
in their Units through trading on the SGX-ST.

This presentation is for information only and does not constitute an invitation or offer to acquire, purchase or subscribe for the Units.

                                                                                                                                                               2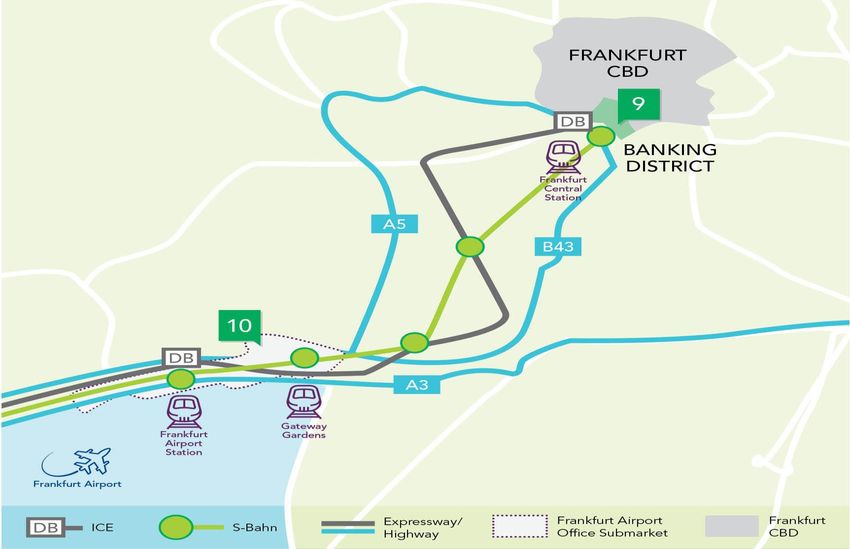
Contents
                                                                                                                                         Slide No.
1.     About CICT                                                                                                                           04
2.     Value Creation Strategies                                                                                                            14
3.     Capital Management                                                                                                                   19
4.     Going Forward                                                                                                                        24
5.     Market Information                                                                                                                   26

 Note:
 For FY 2020 financial information and respective asset type performance, please refer to Investor Presentation dated 2 March 2021 on CICT’s website.

 * Any discrepancies in the tables and charts between the listed figures and totals thereof are due to rounding.

                                                                                                                                                        3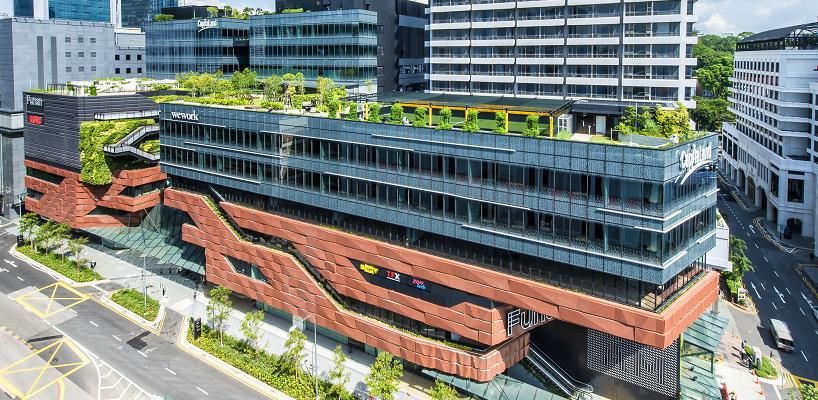
About CICT
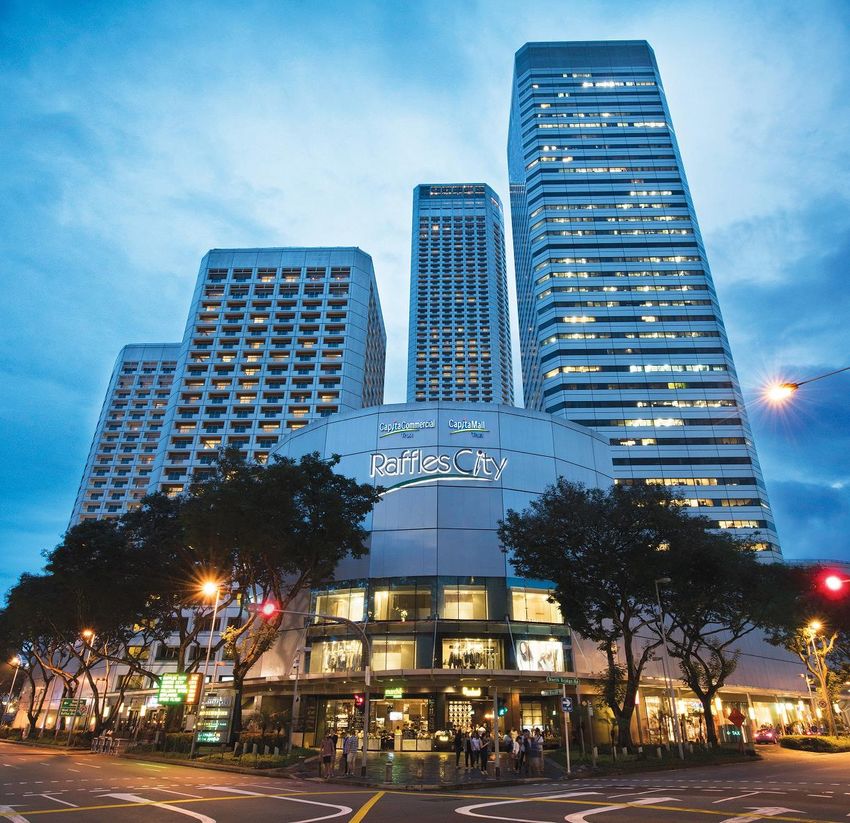
Raffles City Singapore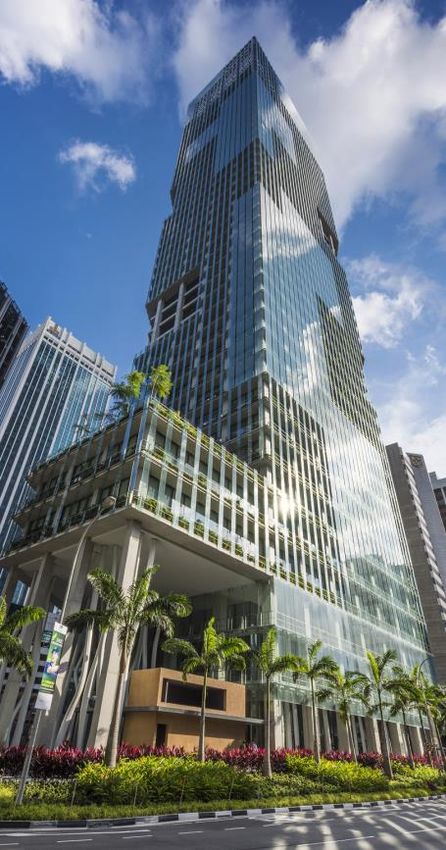
CapitaLand Integrated Commercial Trust
   Largest proxy for Singapore’s commercial real estate market

                                                                                  Market capitalisation                                      Portfolio property value
                                                                                    S$14.0 billion(1)                                           S$22.3 billion(2)
                                                                 Portfolio occupancy rate                                   Total net lettable area                              NAV per Unit
                                                                                    96.4%                                     10.4 million sq ft                                   S$2.00(3)

  Leading integrated commercial REIT underpinned by                                                                                    Predominantly Singapore-focused
  resilience and growth                                                                                                                    Singapore
                                                                                                                                              96%
                                                                                                                                                                 Portfolio
                                                                                                                                                                 property
                                                                                                                                                                value(2) by
                                                                                                                                                                geography

           RETAIL                            OFFICE                     INTEGRATED DEVELOPMENTS                                                                                      Germany
                                                                                                                                                                                       4%
              11                                   8                                               5
Notes:
(1) Based on closing price of S$2.16 as at 31 December 2020.
(2) Based on valuations as at 31 December 2020.
(3) Excludes distributable income; Change in NAV per unit to S$2.00 as at 31 December 2020 from S$2.07 as at 31 December 2019 w as due to a larger total units outstanding as a result of the merger
    and change in valuation of Investment Properties.
                                                                                                                                                                                                       5
Well-located properties across Singapore
                               Integrated Developments                              Office
                           1    CapitaSpring                          1     Asia Square Tower 2

                           2    Funan                                 2     CapitaGreen

                           3    Raffles City Singapore                3     Capital Tower

                           4    Plaza Singapura                       4     One George Street
                           5    The Atrium@Orchard                    5     Six Battery Road
                                                                      6     21 Collyer Quay

                                                                                   Retail
                                                                 1        Bedok Mall
                                                                 2        Bugis+
                                                                 3        Bugis Junction
                                                                 4        Bukit Panjang Plaza
                                                                 5        Clarke Quay
                                                                 6        IMM Building
                                                                 7        JCube
                                                                 8        Junction 8
                                  PROPERTIES IN SUBURBAN AREAS

                                                                 9        Lot One Shoppers’ Mall
                                                                 10       Tampines Mall
                                                                 11       Westgate
                                                                                                   6
Owns 2 properties strategically located in Frankfurt
Airport Office District and Banking District
Excellent connectivity between Frankfurt airport and Frankfurt city centre via a
comprehensive transportation infrastructure network
          Close proximity between
      Frankfurt airport office district and
             Frankfurt city centre

                                                               1
  20 mins by Car

  •    Via A3 / A5 motorways

  11 mins by Train                                                                 1. Gallileo

  •    Inter City Express (ICE) high
       speed trains offer 204 domestic
       and regional connections               2

  15 mins by S-Bahn commuter
  railway

  •    4 stops to Frankfurt city centre
                                                                               2. Main Airport
       (Frankfurt central station)                                                 Center

                                                                                                 7
NPI contribution by Top 5 properties accounts
for 43.7%
           Net Property Income Contribution                                                                  Net Property Income Contribution
                    by Asset Type                                                                                 by Top 5 properties(1)(2)

                                                                                                                                             Plaza Singapura+The
     Integrated                                                                                                                             Atrium@Orchard, 11.6%
   developments,
       25.4%(2)                                                                                                                                        Raffles City
                                                                                                                                                    Singapore, 9.4%
                                4Q 2020                                                                                      4Q 2020
                               Net Property                          Retail ,                                               Net Property
                                Income:                              45.7%                      Other                        Income:                  Asia Square Tower 2,
                               S$191.9 mil                                                    properties,                   S$191.9 mil                       8.1%
                                                                                                56.3%

           Office,                                                                                                                                CapitaGreen,
           28.9%(1)                                                                                                                                   7.6%

                                                                                                                                           IMM Building,
                                                                                                                                              7.0%

  Notes:
  (1) Income contribution from office assets is from 21 October to 31 December 2020 but excludes One George Street, a joint venture.
  (2) Income contribution from Raffles City Singapore is from 21 October to 31 December 2020.
                                                                                                                                                                             8
Portfolio lease expiry profile(1)(2) as at
31 December 2020
                                                                                                 Portfolio                                              3.0 Years
                         Weighted Average Expiry     Retail                                                                                             1.8 Years
                      by Monthly Gross Rental Income Office                                                                                             2.9 Years
                                                                                                 Integrated Development                                 4.7 Years

                                           19.0%
              16.3%
                                                                        13.1%

                                                   9.8%
                      8.5%
                                                                                                                                                                     6.9%
                                                                               5.1%                  5.3% 5.5%                                                              5.2%

                                                                                                                                 1.7% 2.3%                    1.3%

                    2021                         2022                         2023                        2024                         2025                     2026 and
                                                                                                                                                                 beyond
                                                                           Retail        Office         Hospitality
Notes:
(1) Based on the month in which the lease expires and excluding gross turnover rents.
(2) Based on 50.0% interest in One George Street, Singapore and 94.9% interest in Gallileo and Main Airport Center, Frankfurt; and WeWork’s 7-year lease at 21 Collyer Quay which is expected to
    commence by early 4Q 2021.
                                                                                                                                                                                                   9
Top 10 tenants for the month of December 2020
No single tenant contributes more than 6.0% of total gross rental income(1)
                                                                                        % of Total
  Ranking          Tenant                                                                                     Trade Sector
                                                                                        Gross Rent
       1           RC Hotels (Pte) Ltd                                                      5.7%              Hotel
                                                                                                              Supermarket / Beauty & Health / Services / Food &
       2           NTUC Enterprise Co-operative Limited                                     2.1%
                                                                                                              Beverage / Education / Warehouse
       3           Temasek Holdings (Private) Limited                                       2.0%              Financial Services

       4           Commerzbank AG(2)                                                        1.8%              Banking
       5           GIC Private Limited                                                      1.7%              Financial Services
       6           BreadTalk Group Limited                                                  1.7%              Food & Beverage
                                                                                                              Supermarket / Beauty & Health / Services /
       7           Cold Storage Singapore (1983) Pte Ltd                                    1.7%
                                                                                                              Warehouse
                                                                                                              Department Store / Fashion / Beauty & Health /
       8           Al-Futtaim Group(3)                                                      1.6%
                                                                                                              Sporting Goods
       9           Mizuho Bank, Ltd                                                         1.6%              Banking

       10          JPMorgan Chase Bank, N.A.                                                1.2%              Banking

                   Total top 10 tenants’ contribution                                      21.1%
Notes:
(1) Excluding gross turnover rent.
(2) Based on 94.9% interest in Gallileo, Frankfurt.
(3) Includes Robinsons lease which ended on 10 January 2021. About two-thirds of the vacated space will be operational for a short term under the collaboration with BHG and other existing retailers
    who are signing direct leases with Raffles City Singapore.                                                                                                                                          10
Diversified tenants’ business trade mix
IT, Media and Department Store
Telecommunications 3.4%
3.9%
Real Estate and Property Other Retail and Product
Services Trades
Other Retail and Product
4.0% Services 2.9%
Trades
21.7% Gifts & Souvenirs / Toy &
Fashion
Hobbies / Books & Stationery /
5.8%
Sporting goods 2.9%
Supermarket 2.6%
IT & Telecommunications 2.3%
Travel and Hospitality Leisure & Entertainment /
6.0% Music & Video 2.0%
% of Gross Rental Home Furnishing 2.0%
Shoes & Bags 2.0%
Income(1) Electrical & Electronics 1.5%
Beauty & Health
7.6% for December 2020 Jewellery & Watches 1.3%
Other Office Trades
Others 1.2%
10.0%
Education 1.0%
Other Office Trades
Energy and Commodities 2.6%
Manufacturing and
Distribution 2.1%
Banking, Insurance and Government 2.0%
Financial Services Food & Beverage Legal 1.4%
18.6% 19.0%
Maritime and Logistics 1.0%
Others 0.9%
Notes:
(1) Excludes gross turnover rent.
11Valuation largely stable over a six-month period
S$22.3 billion S$22.4 billion(1)
Value as at 31 Dec 2020 Value as at 30 Jun 2020
-0.4%
Valuation Valuation(1) Range of Cap Rates
Variance
as at 31 Dec 20
as at 31 Dec 20 as at 30 Jun 20
S$ million S$ million S$ million % %
Retail Assets 7,379.5 7,357.0 22.5 0.3 4.50 – 6.20
Office Assets(2) 8,516.7 8,544.4 (27.6) (0.3) 3.45 – 3.95
Retail: 4.40 – 4.85
Integrated
6,437.7 6,514.7 (77.1) (1.2) Office: 3.75 – 3.95
Development Assets
Hotel: 4.75
Total 22,333.9 22,416.1 (82.2) (0.4)
Notes: Numbers may not add up due to rounding
(1) For properties acquired as part of the merger, which was completed on 21 October 2020, the amount presented here represents the valuation as at 30 June 2020
(2) Includes CICT’s share in joint ventures (45.0% in CapitaSpring, 50.0% in One George Street and 94.9% respectively in Gallileo and Main Airport Center).
Please see slides 66 to 68 for details.
12Business Update
Capital • Issued HKD426.0 million fixed rate notes due 27 November 2030 which were swapped to S$75.2
management million at 2.156% per annum.
• Issued S$250.0 million fixed rate notes due 7 December 2032 at 2.15% per annum.
• As at end-2020, 96% of CICT’s assets obtained green rating while 52% achieved Green Mark
Platinum, the highest accolade by the Building and Construction Authority. The property
Sustainability which obtained new Green Mark Platinum in 2020 is 21 Collyer Quay with its ongoing
upgrading.
Tenant support • An aggregate S$128.4 million(1) of rental waivers granted in FY 2020 by landlord to tenants
as at 31 Dec 2020 affected by COVID-19. Includes amount of S$22.4 million(1) granted in 4Q 2020.
• Expects to benefit the malls due to:
Phase 3 o Capacity limits in malls and large standalone store increased from 10m2 to 8m2 per
reopening person; and
o Group size for gatherings increased from 5 to 8 person.
Note:
(1) This amount includes rental waivers from properties acquired as part of the merger from 21 October 2020 to 31 December 2020.
13Value Creation
Strategies
14
Asia Square 2Value creation strategy
To deliver stable distributions and sustainable returns to unitholders
AEIs and Prudent Cost and
Organic Growth Acquisition Portfolio Reconstitution
Redevelopment Capital Management
• Driving occupancy • Achieving the • Investing through • Undertaking • Procuring services in
and rents highest and best use property market appropriate bulk and optimising
for properties cycles and across divestment of assets supply chain to
• Harnessing evolving geographies that have reached generate
synergies between • Repositioning or their optimal life operational cost
retail and office repurposing single • Seeking opportunities cycle savings
use assets in line with from both third
• Unifying digital changing real estate parties and • Redeploying • Optimising
platforms to trends and CapitaLand Limited divestment proceeds aggregate leverage
enhance analytics consumers’ into higher yielding and financing costs
capability and preferences properties or other
generate higher growth opportunities • Managing foreign
quality insights • Redeveloping exchange risks
properties from single
• Enhancing tenant use to integrated • Tapping on a wider
stickiness projects range of financing
options to manage
cost of debt
15Sustainability - Environment
Build portfolio resilience & resource efficiency
CMT and CCT achieved 5-Star rating in Global Real Estate Sustainability Benchmark 2020
About 96% of CICT’s properties are at least Green Targets(2) 2020 2021 - 2030
Mark or LEED certified
Low Carbon Transition • Reduce carbon • Reduce carbon emission
Green Mark
emission intensity: intensity: 78%
23% • Reduce energy
Certified, CO2 • Reduce energy consumption intensity: 35%
4.3% LEED Gold,
4.3% consumption • Increase the proportion of
intensity: 20% total electricity
Green
consumption from
Mark
Green renewable sources to 35%
Platinum,
Mark Gold,
52.2% Water Conservation and • Reduce water • Reduce water consumption
17.4%
Number of Resilience consumption to to 45%
Properties: 20%
23(1)
Waste Management and NA • Achieve 25% recycling rate
Green Mark Circular Economy in day-to-day operations
GoldPLUS, • Work towards setting an
21.7% embodied carbon target
Notes:
(1) All properties in Singapore and Germany, except for Main Airport Center. Work is in progress to obtain green certification for Main Airport Center.
(2) Reduction targets are relative to 2008 baseline. The 2021 – 2030 targets were set in 2020 under CapitaLand 2030 Sustainability Master Plan. CICT will report its 2020 reduction achievements in its annual
report 2020 to be released in March 2021
16Sustainability - Social
Enable thriving and future-adaptive
communities
Focus on health and safety of stakeholders, high performance culture for staff and delightful
customer experiences
Note: Photos of activities shown taken pre-COVID 19
17Sustainability - Governance
Uphold high standards of corporate
governance
CICT Manager Board Independence
Non-independent
Director
25% Independent
Director
Board 62.5%
directors
8
Executive
Director
13% • CCT(1) and CMT(1) ranked 1st and 2nd
respectively for the second
consecutive year in the Singapore
CICT Manager Board Diversity
Governance & Transparency Index
Male
Female (SGTI) 2020
Director
Director 25.0%
75%
Board
directors • CCT (1) and CMT(1) ranked 4th and 7th
8
respectively in the Governance
Index for Trusts (GIFT) 2020
Note:
(1) Under the trust scheme of arrangement, CMT acquired all listed units of CCT on 28 October 2020 and is renamed CICT on 3 November 2020
18Capital
Management
IMM BuildingHealthy balance sheet
As at 31 December 2020
S$’000
Non-current Assets 22,143,395 Net Asset Value/Unit
S$2.01
(as at 31 December 2020)
Current Assets 272,983
Adjusted Net Asset Value/Unit
Total Assets 22,416,378 S$2.00
(excluding distributable income)
Current Liabilities 1,333,833
Non-current Liabilities 8,014,607
Total Liabilities 9,348,440
Unitholders’ Funds 13,037,638
Non-controlling interests 30,300
Net Assets 13,067,938
Units in Issue (’000 units) 6,470,704
20CICT debt maturity profile as at 31 December 2020
Facilities in place to refinance debt expiring in 2021
S$ million
1,800
16%
16%
1,600 1,558
1,503
14%
1,400 13% 1,344
13%
1,212
1,184
1,200
900 10%
265 870
1,000 389
916
832 8%
800 761
299
438
350
600
185 418 4%
400 212
290 658 3%
633
481 2%
200 432 407 1%
300 343
250
183 150
75
0
2021 2022 2023 2024 2025 2026 2027 2028 2029 2030 2031 2032
Medium Term Notes (“MTN”) Retail Bonds Secured Bank Loans Unsecured Bank Loans
21Key financial indicators
As at As at
31 December 2020 30 September 2020
Unencumbered Assets as % of Total Assets 95.8% 100.0%
Aggregate Leverage(1) 40.6% 34.4%
Net Debt / EBITDA(2) N.M. 7.6x
Interest Coverage(3) 3.8x 4.0x
Average Term to Maturity (years) 4.1 4.3
Average Cost of Debt(4) 2.8% 3.1%
CICT’s Issuer Rating(5) ‘A3’ by Moody’s ‘A3’ by Moody’s
‘A-’ by S&P ‘A-’ by S&P
Notes:
(1) In accordance with Property Funds Appendix, CICT’s proportionate share of its joint ventures’ borrowings and deposited property values are included when computing aggregate leverage.
Correspondingly, the ratio of total gross borrowings to total net assets is 71.6%.
(2) Net Debt comprises Gross Debt less total cash and EBITDA refers to earnings of CICT Group, before interest, tax, depreciation and amortisation (excluding effects of any fair value changes of
derivatives and investment properties, foreign exchange translation and non-operational gain/loss), on a trailing 12-month basis.
(3) Ratio of earnings of CICT Group, before interest, tax, depreciation and amortisation (excluding effects of any fair value changes of derivatives and investment properties, foreign exchange
translation and non-operational gain/loss) over interest expense and borrowing-related costs, on a trailing 12-month basis.
(4) Ratio of interest expense over weighted average borrowings.
(5) Moody’s Investors Service downgraded CICT’s issuer rating to ‘A3’ on 1 October 2020. S&P Global Ratings assigned ‘A-’ issuer rating to CICT on 30 September 2020.
N.M.: Not meaningful
22Diversified sources of funding and
certainty of interest expense
Borrowings on
Floating Rate
17% Assuming +0.1% p.a.
Unsecured Proforma impact on:
Bank Loans increase in interest rate
32%
Funding Sources Borrowings
as at Estimated additional (2)
(1) MTN & as at +S$1.6 million p.a.
31 December 2020 Retail Bond 31 December 2020
(1)
annual Interest (3)
-0.02 cents per Unit
56% expense
Secured
Bank Loans Borrowings on
12% Fixed Rate
83%
Notes:
(1) Based on CICT Group’s borrowings, including proportionate share of joint ventures’ borrowings.
(2) Computed on full year basis on floating rate borrowings of CICT Group (including proportionate share of joint ventures’ borrowings) as at 31 December 2020.
(3) Based on the number of units in issue as at 31 December 2020.
23Going Forward
24
Plaza SingapuraGoing forward
Singapore • 4Q 2020 GDP contracted by 3.8% year-on-year in 4Q 2020, an improvement from the contraction of 5.6% recorded in
Economy 3Q 2020, according to advance estimates by Ministry of Trade and Industry.
• Commenced phase 3 reopening on 28 December 2020.
• November 2020’s retail sales registered a drop of 2.9% from a drop of 11.2% in October 2020. Online sales as a
proportion of total retail sales was 16.7% in November 2020 based on data by Department of Statistics Singapore.
• While the economy is stabilising and Phase 3 of reopening will be positive for the sector in 2021, hiring sentiments are still
Singapore cautious and uncertainties remain on how the global pandemic is going to pan out. The sector will continue to remain
Retail under pressure, however owners and tenants who are quick to readapt and seize opportunities could establish a head
Sector start in a slow recovery environment. A positive note is that new retail supply coming onstream from 2021 to 2024 is
limited.
(Source: CBRE Singapore)
• Some reduction in space taken by large occupiers resulting in an increase in secondary space. However, this presented
more quality, fitted-out options for potential tenants looking to reduce capital expenditure.
• Demand to come from Chinese technology companies and non-bank financial services firms, albeit subdued in 1H
Singapore
2021
Office
• Poised to benefit from improvement in economic activity and business sentiment on the back of the vaccine rollout.
Sector Alongside improved leasing activity and limited Grade A supply in 2021, there are prospects for rents to turn upwards by
2H 2021.
(Source: CBRE Singapore)
• Germany has extended its current lockdown to 31 January 2021 due to the increase in new infections. The COVID-19
Germany pandemic is impacting the German office market as economic outlook remains uncertain and occupiers are unsure
Office about their space requirements. This benefits office space that can be leased flexibly or on a short-term
basis. Nevertheless, office market rents remained largely stable despite the subdued demand and moderate rise in
Sector
vacancy levels.
25Market
Information
Bedok MallRetail
Singapore retail sales performance
(S$ million)
4,000 30.0%
3,526 3,565
3,500 26.2%
3,138 3,221 25.0%
3,000 2,884
2,785 2,827 2,784
21.0% 2,668
2,615 20.0% 20.0%
2,500
2,290
2,007 16.3%
2,000 15.0%
1,744 12.6% 12.7% 13.4% 12.5%
12.4% 12.1%
1,500
10.5% 10.0%
9.0%
1,000
6.3%
5.0%
500
0 0.0%
Y-o-Y +0.6% -10.2% -9.7% -32.8% -45.2% -24.2% -7.7% -8.4% -12.7% -11.2% -2.9% -4.5% -8.4%
Aug 2020
Nov 2020
May 2020
Feb 2020
Jun 2020
Mar 2020
Jul 2020
Jan 2020
Apr 2020
Sep 2020
Oct 2020
Dec 2020
Jan 2021
Retail Sales (excl. motor vehicles) Online Sales Proportion
Source: Department of Statistics Singapore
27Retail
CICT Market Share
Largest owner of private retail stock in Singapore1
CICT
9.2%
Frasers Centrepoint Trust
4.4%
Mercatus
4.3%
Far East Organization
3.3%
Lendlease
3.0%
Mapletree Commercial Trust
Others/ Unknown 2.4%
65.3% City Developments Limited
2.2%
Changi Airport Group
2.0%
United Industrial Corporation Limited
2.0%
Suntec REIT
1.9%
Notes:
(1) Based on Urban Redevelopment Authority (URA)’s total private stock.
Sources: URA, CBRE Singapore, 4Q 2020
28Retail
Available retail floor space
Total retail supply in Singapore averages approximately 0.3 million sq ft between 2020
and 2023, which is significantly lower than the last 5-year historical average supply of
1.4 million sq ft
Singapore Retail Supply (million sq ft)
0.5
0.4
0.3 0.2
0.2
0.3 0.09
0.1
0.04 0.1
0.03
0 0.03 0.03
2021 2022 2023
Orchard Downtown Core Rest of Central Fringe Suburban
Source: CBRE Singapore, 4Q 2020
2910.0%
15.0%
-15.0%
-10.0%
0.0%
5.0%
-5.0%
Q1 2009
Q2 2009
Retail
Q3 2009
Q4 2009
Q1 2010
Q2 2010
Q3 2010
Q4 2010
Q1 2011
Q2 2011
Q3 2011
Q4 2011
Sources: CBRE, Department of Statistics Singapore.
Q1 2012
Q2 2012
Q3 2012
Q4 2012
Q1 2013
Q2 2013
GDP Q/Q growth
Q3 2013
Q4 2013
Q1 2014
Q2 2014
Orchard
economic environment
Q3 2014
Q4 2014
Q1 2015
Q2 2015
Q3 2015
Singapore Retail Rents and Quarterly GDP Growth
Suburban
Q4 2015
Q1 2016
Q2 2016
Q3 2016
Q4 2016
Q1 2017
Q2 2017
Q3 2017
Q42017
Linear (GDP Q/Q growth)
Q1 2018
Q2 2018
Slight drop in retail rents in view of weak
Q3 2018
Q4 2018
Q1 2019
Q2 2019
Q3 2019
Q4 2019
Q1 2020
Q2 2020
Q3 2020
Q4 2020
$0.00
$5.00
30
$10.00
$25.00
$15.00
$20.00
$30.00
$35.00
$40.00Retail
Known future retail supply in Singapore (2021 – 2023)
Include retail components of mixed developments such as Sengkang Grand Mall, Forest Town, Komo
Shoppes, Central Boulevard Towers and Dairy Farm Residences
Expected Proposed Retail Projects Location NLA (sq ft)
completion
2021 Grantral Mall @ Macpherson (Citimac A&A) Macpherson Road 67,500
2021 Shaw Plaza Balestier(A/A) Balestier Road 68,900
2021 I12 Katong (A/A) East Coast Road 202,400
Subtotal (2021): 338,800
2022 Boulevard 88 Cuscaden Road/Orchard Boulevard 32,000
2022 One Holland Village Holland Road 86,800
2022 Forest Town (Tengah Estate) Bukit Batok Road 74,100
2022 Sengkang Grand Mall Sengkang Central 58,700
2022 Guoco Midtown Beach Road 30,000
2022 Komo Shoppes Upper Changi Road North/Jalan Mariam 24,800
2022 Club Street Retail/Hotel Development Club Street 21,800
2022 Wilkie Edge (A/A) Wilkie Road 21,200
Le Meridien Singapore (A/A) Beach View 20,500
Subtotal (2022): 369,900
2023 Central Boulevard Towers Central Bouelvard 30,000
2023 Dairy Farm Residences Dairy Farm Road 32,300
2023 The Woodleigh Mall Bidadari Park Drive / Upper Aljunied Road 103,800
Subtotal (2023): 166,100
Total forecast supply (2021-2023) 874,800
Sources: URA and CBRE Research
31Office - Singapore
Singapore office stock as at end-2020
Island-wide office stock
Singapore Stock % of Grade A office
(sq ft) total Core CBD
Decentralised, Core CBD, stock
23.23% 50.68%
Core CBD 31.2 mil 50.68% 14.1 mil sq ft
(45.28% of Core
CBD stock)
Fringe CBD 16.1 mil 26.10%
Decentralised 14.3 mil 23.23%
Total 61.6 mil (22.94% of total
Fringe CBD,
island wide stock)
26.10%
Source: CBRE, 4Q 2020
Figures may not add up due to rounding.
32Office - Singapore
Annual new supply to average 0.7 mil sq ft over 5 years;
CBD Core occupancy at 93.8% as at end-Dec 2020
Singapore Private Office Space (Central Area)(1) – Net Demand & Supply
2.5 Forecast average annual gross new supply
2.2
(2021 to 2025): 0.7 mil sq ft
1.9
2.0 1.8 1.9
1.7 Includes
1.6 1.6
CapitaSpring
1.5 1.4
1.3
sq ft million
1.0 0.9 0.9
1.0 0.8
0.7 0.7 0.8
0.6 0.7
0.5 0.3 0.3
0.2 0.2 0.2 0.2 0.2
-0.03 0.0
0.0
-0.5
2010 2011 2012 2013 2014 2015 2016 2017 2018 2019 2020 2021F 2022F 2023F 2024F 2025F
Net Supply Net Demand Forecast Supply
Periods Average annual net supply(2) Average annual net demand
2011 – 2020 (through 10-year property market cycles) 0.8 mil sq ft 0.9 mil sq ft
2016 – 2020 (five-year period post GFC) 1.0 mil sq ft 0.9 mil sq ft
2021 – 2025 (forecast gross new supply) 0.7 mil sq ft N.A.
Notes:
(1) Central Area comprises ‘The Downtown Core’, ‘Orchard’ and ‘Rest of Central Area’.
(2) Supply is calculated as net change of stock over the quarter and may include office stock removed from market due to conversions or demolitions.
Source: Historical data from URA statistics as at 4Q 2020; Forecast supply from CBRE Research as at 3Q 2020.
33Office - Singapore
Known future office supply in Central Area (2021 – 2024)
No commercial sites on Government Land Sales Confirmed List (24 Jun 2020); Three white sites (1) on
reserve list, namely Marina View (Central Area), Kampong Bugis and Woodlands Ave 2 (Fringe Area)
Expected Proposed Office Projects Location NLA (sq ft)
completion
2021 Afro-Asia I-Mark Shenton Way 140,000
2021 CapitaSpring(2) Raffles Place 635,000
2021 Hub Synergy Point Redevelopment Anson Road 131,200
Subtotal (2021): 906,200
2022 Guoco Midtown City Hall 650,000
Subtotal (2022): 650,000
2023 Central Boulevard Towers Raffles Place/Marina 1,258,000
Subtotal (2023): 1,258,000
2024 Keppel Towers Redevelopment Tanjong Pagar Road 522,800
2024 Shaw Towers Redevelopment Beach Road / City Hall 407,000
Subtotal (2024): 929,800
Total forecast supply (2021-2024) 3,744,000
Notes:
(1) Details of the three white sites: (a) Marina View: Site area of 0.78 ha, gross plot ratio of 13.0; estimated 905 housing units, 540 hotel rooms and 2,000 sqm commercial space (on reserve list since 4Q
2018); (b) Kampong Bugis: GFA of 390,000 sqm; up to 4,000 housing units and commercial GFA of 10,000 sqm (on reserve list since 4Q 2019);
(c) Woodlands Ave 2: Site area of 2.75 ha, gross plot ratio of 4.2; estimated 440 housing units, 78,000 sqm commercial space (on reserve list since 4Q 2018)
(2) CapitaSpring reported committed take-up for 38% of the development’s NLA as at 19 January 2021
Sources: URA, CBRE Research and respective media reports
34Office - Singapore
Grade A office market rent down 2.8% Q-o-Q and
down 10.0% in 2020
1Q 18 2Q 18 3Q 18 4Q 18 1Q 19 2Q 19 3Q 19 4Q 19 1Q 20 2Q 20 3Q 20 4Q 20
Mthly rent (S$ / sq ft ) 9.70 10.10 10.45 10.80 11.15 11.30 11.45 11.55 11.50 11.15 10.70 10.40
% change 3.2% 4.1% 3.5% 3.3% 3.2% 1.3% 1.3% 0.9% -0.4% -3.0% -4.0% -2.8
$20
S$18.80
$18
Monthly gross rent by per square foot
$16
S$11.55
$14
S$11.06 S$11.40
$12
$10
S$10.40
$8
$6
S$9.55 S$8.95
$4
S$8.00
$2 S$4.48 Global financial Euro-zone
Post-SARs, Dot.com crash crisis crisis
$0
1Q02
2Q02
4Q02
1Q03
2Q03
3Q03
4Q03
1Q04
3Q04
4Q04
1Q05
2Q05
3Q05
4Q05
2Q06
3Q06
4Q06
1Q07
2Q07
3Q07
1Q08
2Q08
3Q08
4Q08
1Q09
2Q09
4Q09
1Q10
2Q10
3Q10
4Q10
1Q11
3Q11
4Q11
1Q12
2Q12
3Q12
4Q12
2Q13
3Q13
4Q13
1Q14
2Q14
3Q14
1Q15
2Q15
3Q15
4Q15
1Q16
2Q16
4Q16
1Q17
2Q17
3Q17
4Q17
1Q18
3Q18
4Q18
1Q19
2Q19
3Q19
4Q19
2Q20
3Q02
2Q04
1Q06
4Q07
3Q09
2Q11
1Q13
4Q14
3Q16
2Q18
1Q20
3Q 20
4Q 20
Source: CBRE Research (figures as at end of each quarter).
35Office - Singapore
Drivers for new office demand
• CBD Core remains the preferred location, with good quality office space and access to well-
connected transportation nodes
• Companies exploring office-based, remote working, or a combination of both.
FY 2020 Demand Future Demand
Drivers • Renewals Drivers • Renewals
• Relocations as firms continue to • Displaced tenants affected by
reassess their footprint redevelopment of their existing office
buildings
• MNCs setting up regional
Sectors • Banking headquarters
• Legal • Space expansion requirements
• Technology
• Financial services Sectors • Technology
• Professional services sectors • Financial services (excluding banking
• Diversified businesses
Source: CBRE Research
36Office - Germany
Information on Frankfurt and two submarkets
('000 sqm) Frankfurt Office (%)
800.0 16.0
700.0 14.0
600.0 12.0
500.0 10.0
400.0 8.0
300.0 6.4 6.0
200.0 4.0
100.0 2.0
0.0 0.0
2015 2016 2017 2018 2019 2020
Demand ('000 sqm) New Supply ('000 sqm) Vacancy rate (%)
(‘000 sqm) Banking District (%) Airport Office District (%)
(‘000 sqm)
800 16.0 800 16
700 14.0 700 14
600 12.0 600 12
500 10.0 500 10
400 8.0 400 8
300 6.0 300 6.2 6
4.7
200 4.0 200 4
100 2.0 100 2
0 0.0 0 0
2015 2016 2017 2018 2019 2020 2015 2016 2017 2018 2019 2020
Source: CBRE Research, 4Q 2020
Note: Demand for Banking District and Airport Office District is as at 1H 2020
37Office - Germany
New office supply in Frankfurt
About 68% and 35% of 2021F and 2022F new supply are owner-occupied or committed
1,000 sqm
300
Actual New Supply Forecast New Supply
250
200
5-Year (2016-2020) Average: 145,960 sqm
150
100
50
0
2012 2013 2014 2015 2016 2017 2018 2019 2020 2021F 2022F
Banking District New Supply Airport Office District New Supply Rest of Frankfurt New Supply
Source: CBRE Research, Frankfurt 4Q 2020
38Office - Germany
Rental range in Frankfurt
Rental range by submarket(1)
Frankfurt
West City CBD
(€ / square metre / month)
C
Westend B
44.0 44.0
D Gallileo
27.0 40.4
Banking
District
23.1
21.7
A5
B43
Niederrad
South
18.0 19.0
7.0
MAC A3 Frankfurt Frankfurt
Airport Office Frankfurt Total
Banking District
District
A (Region D)
(Region A)
ICE S-Bahn Expressway / Highway Weighted average
Source: CBRE Research, 4Q 2020
39Thank you
For enquiries, please contact: Ms Ho Mei Peng , Head, Investor Relations, Direct: (65) 6713 3668
Email: ho.meipeng@capitaland.com
CapitaLand Integrated Commercial Trust Management Limited (http://www.cict.com.sg)
168 Robinson Road, #25-00 Capital Tower, Singapore 068912
Tel: (65) 6713 2888; Fax: (65) 6713 2999You can also read