Q1 2020 Operational Update - 12 May 2020 - City Developments Limited
←
→
Page content transcription
If your browser does not render page correctly, please read the page content below
Q1 2020
Operational Update

12 May 2020
Agenda
General Overview & Operations Review
COVID-19 Impact - Singapore Operations
- Hospitality
Capital Management
Strategic Investments
General Overview

Overview – Q1 2020
Operating Performance Affected by COVID-19 Global Pandemic
• Business segments impacted to varying extents by
containment measures to combat the outbreak:
Lockdowns
Travel restrictions
Safe distancing measures
Grand Millennium Beijing
• Retail and hospitality sectors most impacted:
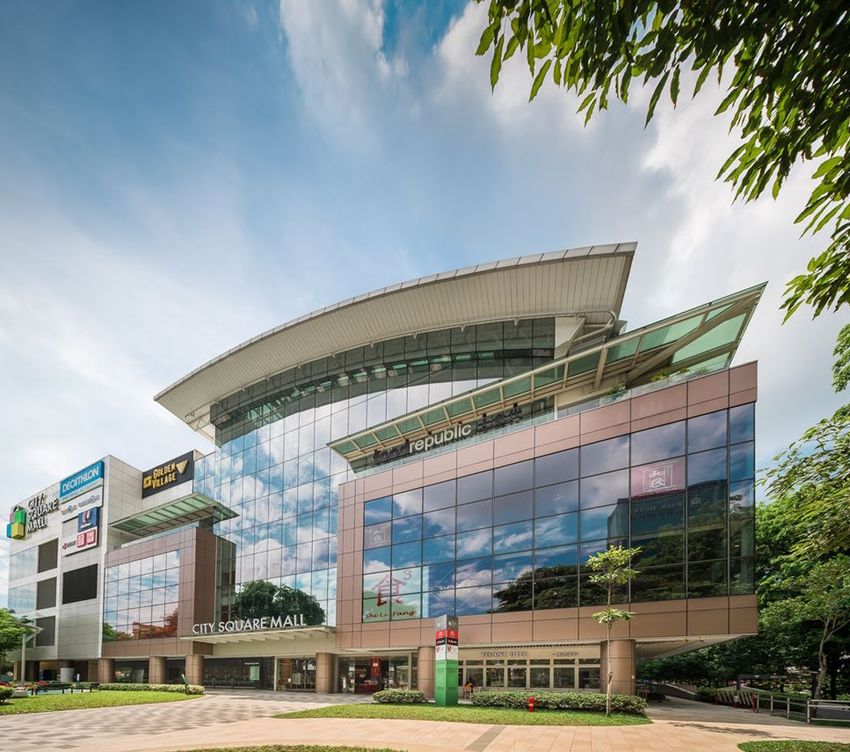
Retail: Approx. 80% of CDL's retail tenants in Singapore closed due to
enhanced circuit breaker measures
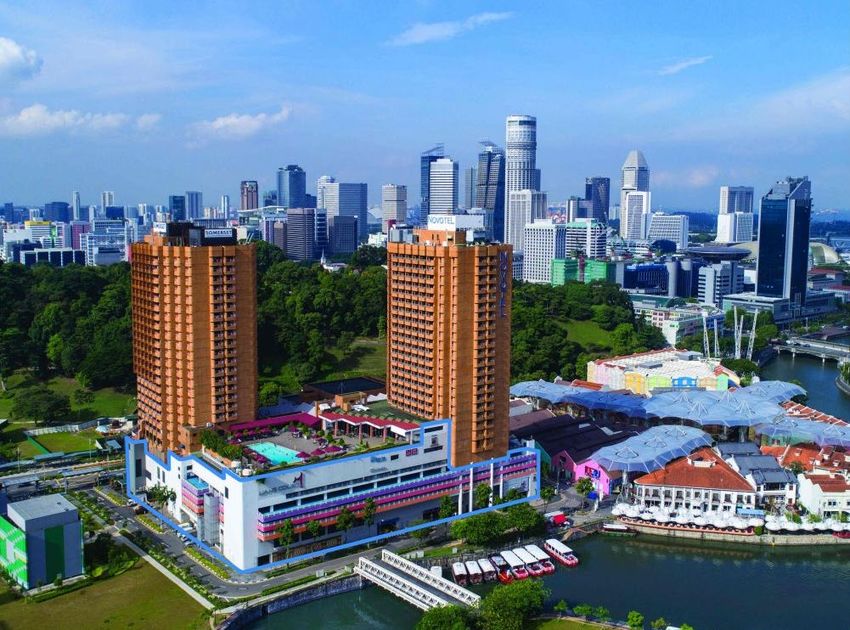
Hotel operations: Around 30% of global hospitality portfolio closed due
to government-mandated shutdowns
Strong capital position; well-positioned for new opportunities:
City Square Mall
• Safe distancing measures implemented
Cash reserves of $3.3B as well as undrawn and committed credit lines of $2.3B
Debt expiry profile remains healthy
• Mitigation measures implemented to address near-term uncertainty:
Cost-efficiency and cash preservation initiatives
Tap on economic stimulus packages, wage and tax reliefs provided by governments across operating
regions (e.g. Singapore, the UK and New Zealand)
Rental relief and support measures for tenants
4
Global Portfolio Overview
Recurring Income Assets comprise 64% of Global Portfolio
Diversified portfolio provides ‘cushion’ from impact of macroeconomic challenges:
Development assets: Lower transaction volumes mitigated by healthy pre-sales in 2018 and 2019,
with profit contribution expected progressively
Recurring income assets: Investment properties comprise 29% of total assets
Total Assets: Recurring
Income
$23.7B Segments
China Others
64%
3% 4%
Others UK
4% Singapore
18%
23%
US
7% Singapore Singapore
48% 25%
UK
10%
China
13%
China
Others 10%
UK US
14% 14%
7%
5
COVID-19
IMPACT
Operational Performance Impact
Unprecedented Disruption Across All Business Segments
PROPERTYDEVELOPMENT
Lockdowns across several regions have affected sales and development works:
Residential sales affected by showflat closures
Construction works affected
ASSET MANAGEMENT
Retail and F&B sector hard hit:
Widespread business closures in Singapore from enhanced circuit breaker
measures – approx. 80% of retail tenants closed
Support initiatives amounting to over $30MM of property tax and rental rebates for
tenants in Singapore and overseas
HOSPITALITY
Sector severely impacted by hotel closures:
Government-mandated closures in multiple regions – approx. 30% of 152 hotels
worldwide temporarily closed
All regions recorded declines in RevPAR driven primarily by a drop in occupancies
6
COVID-19
         IMPACT
                           Property Development – Singapore
 Residential Sales & Development Progress Impacted by Circuit Breaker Measures
 (7 Apr – 1 Jun)

         Singapore

Closure of 6 sales galleries & construction
works on development sites affected
                                                                                                   CDL Homes
                                                                                                   www.cdlhomes.com.sg
• Stepped up digital marketing efforts:
  − Virtual tours and digital collaterals
  − Online sales presentations to potential homebuyers
  − Remote assistance with sales process
  − Achieved increase of over 30% in online traffic
     views for launched projects in April
• Registered residential sales in April for Amber Park,
  Boulevard 88, Coco Palms, Piermont Grand,
  Sengkang Grand Residences, South Beach
  Residences, The Jovell and The Tapestry
• Works at development sites affected:
  − TOPs for most projects expected only in 2022 /
    2023; sufficient buffer to accommodate the current
    delay
  − Forest Woods on schedule for completion by Q3
    2020

                                                          Haus on Handy I 2-bedroom virtual tour

                                                                                                                         7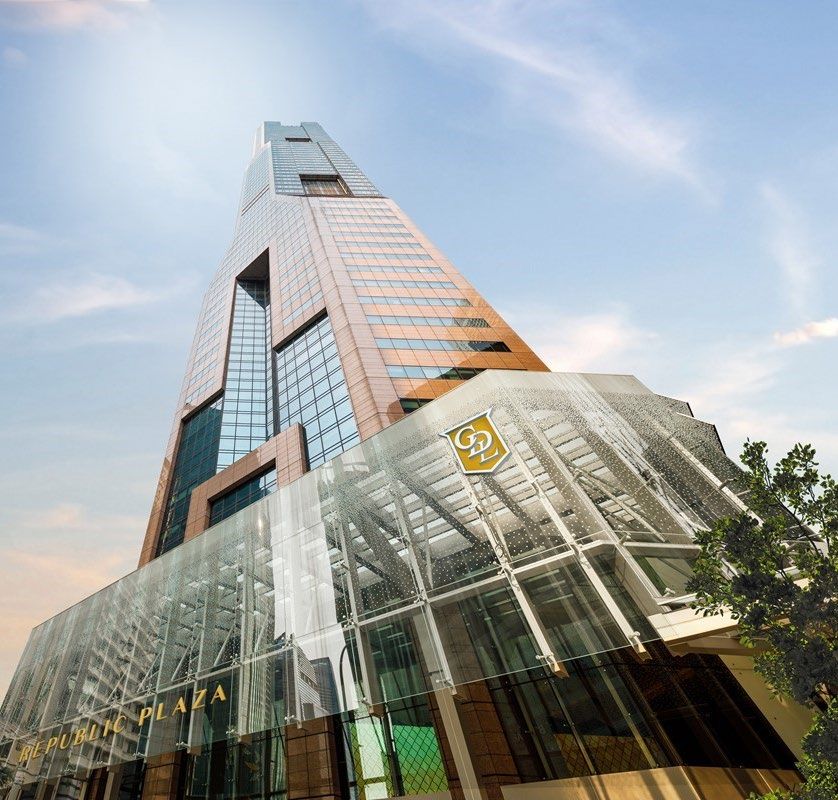
COVID-19
IMPACT
Property Development – Overseas
Sales impacted by lockdowns & restrictions in multiple regions
Showflat closures
Construction works stalled or slowed from site closures
Current Situation
Nationwide travel restrictions Lockdown measures have eased
China (23 Jan – 8 Apr)
Nationwide lockdown A conditional plan to review current lockdown restrictions
UK (Since 24 Mar) announced, subject to the development of the outbreak
Nationwide lockdown Easing of measures (varies across different states)
Australia (Since 23 Mar)
Emerald, Chongqing The Marker, Melbourne
Artist’s Impression Artist’s Impression
Teddington Riverside I Virtual tour
Note: In view of the evolving situation, dates and measures may change
8
COVID-19
IMPACT
Asset Management
Tenants Impacted by Global Shutdown of Non-essential Businesses
Widespread business closures in Singapore till 1 Jun 2020: Over $30MM rental relief & support
Approx. 80% of retail tenants (of non-essential services) closed to tenants in Singapore & overseas
Singapore China
Retail segment hard hit by Month Ave. Sharp decrease in retail sales in Q1
Rental
circuit breaker extension Rebate 2020; recovery underway
• Over $23MM of rental and property • Rental rebates to tenants at Suzhou HLCC mall in
April 100% Majority of Q1 2020
tax rebates to be provided to retail Singapore retail
and commercial tenants May 100% tenants to receive • Advertising & Promotion assistance available to
• Additional assistance available to >2.8 months* retail tenants to drive sales
June 50%
tenants with cashflow issues of gross rental
July 30% rebates Thailand
State of emergency till end May;
Implementation of precautionary & safe distancing measures Phuket hardest hit region
across commercial & retail portfolio in Singapore
• Rental rebates to tenants at Jungceylon Shopping
Mall (Phuket) and Mille Malle (Bangkok)
UK
Portfolio shows resilience
• UK government has mandated no eviction of tenants
during this period
Thermal temperature scanning &
safe distancing markers Safe distancing markers at retail and F&B outlets and taxi stand • Any rental deferments and repayment plans need to
be negotiated and agreed upon between landlords
* Includes property tax rebates for qualifying commercial properties from the Government that will be and tenants
fully passed through to tenants
9
COVID-19
         IMPACT
                              Hotel Operations
Overview of the Group’s Hotel Inventory (as at 31 March 2020)

Around 30% of 152 Hotels Worldwide Closed

                                         Hotels
                                     Total    Closed
Hotel Count
By region:
● New York                                4        1
● Rest of US                             14        -
● London                                  8        4
● Rest of Europe                         22       17   The Biltmore Mayfair
● Middle East*                           43        4
● Singapore                              10        -
● Rest of Asia                           27        1
● Australasia                            24       17

Total:
 Artist’s Impression
                                       152        44
 Artist’s Impression

           * All franchised hotels                     M Social Auckland

                                                                              10
COVID-19
IMPACT
Hotel Operations
Q1 2020 Performance Severely Impacted
Global occupancy: 52.1% (▼ 17.9% yoy)
Global RevPAR: $90.60 (▼ 27.0% yoy)
Rest of Asia
Global ARR: $173.90 (▼ 2.0% yoy)
1 hotel closed
UK & Europe RevPAR $59.10 (▼ 45.2%)
US
Occupancy 41.2% (▼ 25.2%)
21 hotels closed
1 hotel closed • Government-mandated shutdown
• Hotels focus on supporting frontline • Only a few hotels open to support stays Singapore
workers (hospitals / police) and for key essential workers
students who are unable to travel home
RevPAR $83.30 (▼ 25.2%) All 10 hotels operational
• Occupancy impact partially mitigated with
RevPAR $99.50 (▼ 20.7%)
Occupancy 48.4% (▼ 19.6%) focus on corporate & public-sector business:
- Housing of Malaysian workers due to border
Occupancy 52.3% (▼ 7.6%) closure
- Government-designated facilities for residents
serving their Stay-Home Notices
RevPAR $103.60 (▼ 28.8%)
Occupancy 54.5% (▼ 31.1%)
17 hotels closed New Zealand
• Country-wide lockdown in New Zealand since 19
March RevPAR $128.50 (▼ 15.5%)
• Most hotels closed, except for a handful designated to
support aircrew and essential workers Occupancy 77.2% (▼ 14.1%)
Note: Excludes franchised hotels, such as the Middle East portfolio
11COVID-19
IMPACT
Cost Management
Implementation of Business Optimisation and Cost Reduction Measures
Mitigate revenue impact through cost management initiatives:
Board Fees & Board of Directors: Voluntary 25% reduction of director’s fees
Management Top management: 20% pay cuts
Cost Senior personnel: 15% pay cuts
Effective since 1 April 2020
Value Maximise value engineering across all projects
Engineering Leverage existing resources
Manage working capital
Capex Defer non-essential capex and operating costs
Initiatives to reduce costs across asset portfolio in place
Capital Conserve cash
Management Maintain adequate liquidity
12COVID-19
IMPACT
Community Initiatives
Supporting Vulnerable Individuals, Families and Communities Affected by COVID-19
Donated $488,000 to Support Vulnerable Individuals, Families & Migrant Workers
$400,000 donation to The Invictus Fund
Donation made by CDL, together with contributions from entire Board and
the key management team
Supports Singapore’s social service agencies to continue delivery of critical
social services to vulnerable individuals, families and communities during
COVID-19 period
$88,000 donation to workers at CDL development projects
Dollar-for-dollar match by CDL for contributions made by CDL employees
Provide workers with necessities during circuit breaker period
Supporting Frontline Workers on the COVID-19 ‘Battlefield’ through M&C
Hotels in most regions open to support medical personnel, key
workers, infrastructure workers and government employees
Singapore hotels offer discounted accommodation to affected
Malaysian employees impacted by Malaysia’s Movement Control
Order
“We Clean. We Care. We Welcome.” global campaign – initiatives to
ensure guests have a pleasant and safe hospitality experience
Orchard Hotel Singapore
Welcoming Malaysian bus captains from SBS Transit
13Sustainability Performance Highlights
Achieved Over $28MM Energy Savings for 8 Commercial Properties (from 2012 – 2019)
Integrated Publication of 13th
dedicated
2019 Environmental
Sustainability sustainability report Performance Highlights
Report Highlights ESG
performance outcomes
against CDL’s Future Achieved energy savings of
Value 2030 blueprint
View & download the report from
>$28MM
www.cdlsustainability.com for 8 CDL commercial properties from
2012 to 2019 from energy-efficient
retrofitting and initiatives implemented
Latest ESG Milestones
38%
reduction in Carbon Emissions Intensity
from 2007 levels*
110 Green Mark
Only real estate Only company in Southeast Ranked world’s top real estate, Only Singapore
company listed for Asia & Hong Kong to achieve top Singapore company, and company to win
3rd consecutive this double ‘A’ honour for 1st & only Singapore company multiple accolades
year both climate change and listed on Global 100 at the 5th Asia developments and office interiors
water security for 11 consecutive years Sustainability Highest amongst local developers
Reporting Awards
*On track to achieving enhanced carbon emissions intensity reduction target of 59% reduction by 2030
14Capital Management
Capital
Management
Strong Balance Sheet & Liquidity Position
Sufficient Financing Balanced
Gearing
Liquidity Flexibility Debt Profile
% of
Net Gearing Total Cash Interest Cover Ratio Fixed Rate Debt
62% $3.3B 6.2x 42%
FY 2019: 61% FY 2019: $3.1B FY 2019: 14.0x FY 2019: 40%
Net Gearing 1 Undrawn Average Average
(include fair value) & Committed Borrowing Cost Debt Maturity
Credit Facilities
44% $2.3B 2.3% 2.3 years
43% in FY 2019 FY 2019: $2.2B FY 2019: 2.4% FY 2019: 2.4 years
1 After taking in fair value on investment properties
16Capital Management
Prudent Capital Management
Balanced debt expiry profile
Balanced debt currency mix – adopting a natural hedging strategy
Average borrowing cost kept low
Well-Spread Debt Maturity Profile
Others (2.1%)
4,000 38% RMB (5.1%)
213
3,600
100 Bond Bank Loan JPY (5.2%)
518
521
3,200 USD (11.6%)
2,800
1,173 Debt
2,400
Currency
Debt $MM
20%
2,000 18%
1,600 300
325 3,754 Mix 4,455 SGD (44.1%)
13%
1,200 3,221
800 1,680 6% 890 5%
1,515 GBP (31.9%)
400 400 481 69
191 396
0
$10.1B
2020 2021 2022 2023 2024 2025
onwards
17Strategic Investments
Transformational China Platform Deal
Acquisition of initial 51.01% stake in Sincere Property Group, an established China Real Estate
Developer for RMB 4.39B ($0.88B) – Deal completion expected by Q2 2020
Renegotiated transaction includes a Call Option exercisable in 2022 for another 9.00% stake at RMB 0.77B
($0.16B)
Upon exercise of the Call Option, CDL will have sole control and a stake of 60.01% in one of China’s Top 100
Developers 1
Top 50 9.2MM
5 Attractive China
Commercial
sqm2
Regions entry valuation Development
Real Estate Properties
RMB
18 RMB 8.6B Developer
21.4B2 Land Bank
Cities Almost 50% below ($4.3B)
>2,000 Beijing
Sincere Property’s
audited FY 2019 Top 10
2019
Contracted Comprehensive
Employees4 NAV of Sales
Tianjin
RMB 16.1B China Business Capabilities
Yantai Park Developer & across multiple
Zhengzhou Qingdao Operator asset types
Luoyang
Zhenjiang Changzhou
Chengdu
Wuxi Suzhou
Development
64
Shanghai
Chongqing projects
Hangzhou
Ningbo Properties
Changsha
Kunming
9 retail 13 office3
Shenzhen Investment
Properties
Notes: Data as of 31 Dec 2019, subject to further due diligence
serviced
1.
2.
2019 Ranking by China Real Estate Association (中国房地产业协会)
On 100% basis
4 hotels 1 residence
3. Includes 2 self-use offices in Shanghai and Chongqing
4. Includes staff from property development, asset management and Starlight Retail
19Strategic Increase in IREIT Global Stake
Acquisition of Additional 8% Effective Stake in IREIT Global Units for $25.5MM
Post-acquisition, CDL holds a 20.9% stake in IREIT Global’s units:
Joint acquisition by CDL and Tikehau Capital* at a unit price of $0.49^ in
April 2020
Collectively, CDL and Tikehau Capital hold over 50% of IREIT’s units
Sant Cugat Green, Barcelona
• Transaction reflects CDL and Tikehau Capital’s commitment to
IREIT’s growth despite COVID-19 pandemic in Europe
• IREIT Global remains focused on growth and asset
diversification on two fronts:
Geography: Portfolio expansion in key European countries –
France, Spain, Italy, Netherlands, Belgium and Germany
Asset class: Office and logistics sectors
IREIT Global’s Asset Portfolio
• Germany 5 freehold office properties
• Spain 4 freehold office properties
Total Lettable Area~ Approx. 230,000 sqm
Darmstadt Campus Bonn Campus Total Valuation~ €630.2MM
* CDL owns 50% of the REIT Manager for IREIT Global while Tikehau Capital owns the remaining 50%
^ As at 30 Apr 2020, IREIT’s share price was $0.685 ~ Based on IREIT’s proportionate interest in the respective properties
20Singapore Operations Property Development
Singapore Property Market
Property Price Index – Residential (2014 – Q1 2020)

                          All Residential

180
                                                          Price decrease
                                                           (-1.0% QoQ)
                                                       First quarterly decline after        Q1 20:
                                                       three consecutive quarterly
                                                                increase                     152.1
160

140

120
      Q1 Q2 Q3 Q4 Q1 Q2 Q3 Q4 Q1 Q2 Q3 Q4 Q1 Q2 Q3 Q4 Q1 Q2 Q3 Q4 Q1 Q2 Q3 Q4 Q1
      14 14 14 14 15 15 15 15 16 16 16 16 17 17 17 17 18 18 18 18 19 19 19 19 20

                                                                               Source : URA, Q1 2020

                                                                                                       22
Singapore Property Market
• Private residential prices decreased by 1.0% in Q1 2020 as compared to Q4 2019
• Primary home sales remained healthy in Q1 2020 with a total of 2,149 units sold, marking a 12%
decline against Q4 2019
Price
Sales volume vs Price growth growth%
25,000 20.0%
17.6% 22,197
Price growth of 4.5% over
15.0%
20,000 the 5-year period from
16,292 15,904
Q1 2015 – Q1 2020
10.0%
15,000 14,688 14,948
5.9% 7.9%
10,566 2.7% 5.0%
2.8%
10,000 1.7% 1.1% 8,795 9,912
7,972 1.1%
7,316 7,440 0.0%
-4.7% -1.0%
5,000 -3.1%
-4.0% -3.7% 2,149 -5.0%
4,264
- -10.0%
2008 2009 2010 2011 2012 2013 2014 2015 2016 2017 2018 2019 Q1
2020
CCR RCR OCR Price growth (year on year)
Source : URA Statistics
23Singapore Property Development
Residential Units Sold by CDL
Q1 2019 Q1 2020
Majority of units
sold were mass &
Q1 2020
185
185 units sold
$516,293 mid-market projects
173
210,292
176,526 (▲7% ) yoy
with sales value of
$278.1 million
$278,099
Lower sales value as:
Q1 2020: Majority of units sold were
mass and mid-market projects like
Piermont Grand, Whistler Grand and
The Tapestry, as well as Amber Park,
a luxury project
Q1 2019: Mainly ultra-luxury projects
sold, like Boulevard 88 and South
Beach Residences
No. of Units* Sales Value* Total Floor Area*
($'000) (sq ft)
* Includes Executive Condominiums (ECs) and share of JV partners, excludes Nouvel 18
24Singapore Property Development
Steady Sales for 2019 Launched Projects
Sold 185 units with total sales value of $278MM in Q1 2020^
Continued steady sales for projects launched in 2019
Project Location Tenure Equity Total Units Achieved
Stake Units Sold* Average
Selling
Price (ASP)
Orchard
Boulevard 88 Freehold 40% 154 92 >$3,790 psf
Boulevard
Piermont Grand
Amber Park Amber Road Freehold 80% 592 204 >$2,480 psf Sengkang Grand (July)
Residences
Haus on Handy Handy Road 99 years 100% 188 33 >$2,870 psf (November)
Piermont Grand Sumang Walk 99 years 60% 820 510 >$1,090 psf
Sengkang Grand Sengkang
99 years 50% 680 238 >$1,730 psf
Residences Central
Anderson
Nouvel 18~ Freehold - 156 27 >$3,460 psf
Road
Amber Park
(May)
Artist’s Impression
Haus on Handy Boulevard 88
(July) (March)
Nouvel 18~
(July)
* As of 31 March 2020
^ Includes Executive Condominiums (ECs) and share of JV partners, excludes Nouvel 18 ~ Divested project marketed by CDL 25Singapore Property Development
Inventory of Launched Residential Projects – As of 31 Mar 2020
CDL’s Share of
Total Unsold
Project Equity Stake Total Units Units Sold Unsold
Inventory
Inventory
Cuscaden Residences 25% 75 74 1 0.3
St. Regis Residences 33% 173 161 12 4.0
The Oceanfront @ Sentosa Cove 50% 264 263 1 0.5
One Shenton 100% 341 327 14 14.0
Cliveden at Grange** 100% 110 43 67 67.0
UP@Robertson Quay 100% 70 61 9 9.0
Echelon 50% 508 506 2 1.0
The Venue Residences 60% 266 265 1 0.6
Coco Palms 51% 944 940 4 2.0
Forest Woods 50% 519 516 3 1.5
New Futura 100% 124 124 0 0.0
The Tapestry 100% 861 733 128 128.0
Whistler Grand 100% 716 495 221 221.0
Boulevard 88 40% 154 92 62 24.8
Amber Park 80% 592 204 388 310.4
Haus on Handy 100% 188 33 155 155.0
Piermont Grand 60% 820 510 310 186.0
Sengkang Grand Residences 50% 680 238 442 221.0
South Beach Residences 50% 190 134 56 28.1
The Jovell 33% 428 120 308 101.6
TOTAL: 8,023 5,839 2,184 ~1,476
The Venue Shoppes – sold 16 units out of 28 sold, 12 units unsold with 3 units leased
** Leasing strategy implemented
26Diversified Residential Launch Pipeline
Singapore Pipeline comprises Mass Market and Mid-Tier segments
Launch Pipeline Irwell Bank Road
>1,800 units*
(Est 580 units)
GLS site near
upcoming
Great World
Upcoming Launches MRT station
awarded in
Penrose (Sims Drive)^ 2H 2020
Jan 2020
Irwell Bank Road TBA
Land cost: $583.9MM
Liang Court redevelopment^ TBA ($1,515 psf ppr)
Liang Court redevelopment^
(Est 700 units) Sims Drive^
(566 units)
GLS site near
Aljunied MRT
awarded in
Apr 2019
Land cost: $383.5MM*
Est GFA: 60,158 sqm
($732 psf ppr)
* Includes JV partners share ^ JV project
27Singapore Operations Asset Management
Singapore Commercial Market
Property Price Index – Commercial (2014 – Q1 2020)

 150
                                                                            Q1 20: 132.6
                            Office   Retail                                 (-4.0% QoQ)
 140

 130

                                                                            Q1 20: 110.5
 120
                                                                            (-3.1% QoQ)

 110

 100

 90

 80
       Q1 Q2 Q3 Q4 Q1 Q2 Q3 Q4 Q1 Q2 Q3 Q4 Q1 Q2 Q3 Q4 Q1 Q2 Q3 Q4 Q1 Q2 Q3 Q4 Q1
       14 14 14 14 15 15 15 15 16 16 16 16 17 17 17 17 18 18 18 18 19 19 19 19 20

                                                                    Source : URA, Q1 2020
                                                                                            29
Singapore Commercial Market
Property Rental Index – Commercial (2014 – Q1 2020)
250
Office Retail
Q1 20: 168.7
200
(-0.8% QoQ)
150
Q1 20: 98.7
(-2.3% QoQ)
100
50
0
Q1 Q2 Q3 Q4 Q1 Q2 Q3 Q4 Q1 Q2 Q3 Q4 Q1 Q2 Q3 Q4 Q1 Q2 Q3 Q4 Q1 Q2 Q3 Q4 Q1
14 14 14 14 15 15 15 15 16 16 16 16 17 17 17 17 18 18 18 18 19 19 19 19 20
Source : URA, Q1 2020
30Singapore Commercial Portfolio
Strong Committed Occupancy and Positive Rental Reversion for Office & Retail
Portfolio (As at 31 March 2020) (1)
Office Retail
13 properties 9 properties
90.9% 94.4%
Committed Occupancy Committed Occupancy
2.2MM sq ft 733,000 sq ft
Net Lettable Area REPUBLIC PLAZA
Net Lettable Area
CITY SQUARE MALL
Lease Expiry Profile 21.1%
by % of NLA 16.9%
3.8%
Income stability from well- 14.8%
spread lease expiry profile 7.7%
7.3%
6.3% 5.4% 5.5%
Engagement of tenants well 5.2%
1.5% 4.2%
ahead of lease expiries
further strengthens risk 4.9% 0.7%
management
2020 2021 2022 2023 2024 2025 & beyond
Office - Completed Retail - Completed Office Retail
(1) Includes all Singapore assets under management (including JV project South Beach), in accordance to CDL’s proportionate ownership.
31Singapore Commercial Portfolio
Trade Mix of Office & Retail Space by % of Total Gross Rental Income
(As at 31 March 2020)*
Office Retail
Supermarkets Electrical, Electronics
Sporting & Value Store, & Telecommunications,
Banking, Insurance & Goods, 3.0% 6.2% 2.1%
Technology &
ICT, 16.6% Financial Services,
21.6% Others, 2.7% Fashion &
Accessories, 9.5%
Medical & General
Retail Products
Services, 9.3%
& Services,
9.3% Energy, Commodities,
Maritime & Logistics,
10.5% Leisure &
Entertainment, 9.3%
Real Estate, Government, 0.2%
15.0% Kids & Food &
Manufacturing & Beverage,
Education, 5.5%
Distribution, 3.8% 36.8%
Jewellery, Optical &
Others, 2.1%
Professional Watches, 1.6%
Services, Health & Beauty,
20.9% Home, Lifestyle & Gifts, 5.1% 8.9%
• Diverse and well-spread tenant mix across both office and retail segments:
Office: Representation across varied industries provides stability. Demand in Q1 sustained by Banking,
Insurance and Financial Services.
Retail: Strategically review vacant spaces arising from the impact of COVID-19
* Includes all Singapore assets under management (including JV project South Beach), in accordance to CDL’s proportionate ownership and excludes retail
gross turnover rent.
32Hospitality
Hotel Operations Performance
 Hotel Occupancy, Average Room Rate, and RevPAR by Region for CDL/M&C Hotels
                               Room Occupancy                            Average Room Rate                                   RevPAR
                           Q1             Q1           Incr /          Q1            Q1            Incr /         Q1             Q1         Incr /
                          2020           2019         (Decr)          2020         2019 *         (Decr)         2020          2019 *      (Decr)
                           %              %            % pts            $            $               %             $             $            %
Singapore                    54.5           85.6         (31.1)        190.3          170.0           11.9         103.6           145.6     (28.8)

Rest of Asia                 41.2           66.4         (25.2)        143.3          162.6          (11.9)          59.1          107.9     (45.2)

Total Asia                   46.3           73.3         (27.0)        164.4          165.7            (0.8)         76.1          121.1     (37.2)

New Zealand                  77.2           91.3         (14.1)        166.4          166.4             -          128.5           152.0     (15.5)

London                       47.3           73.7         (26.4)        225.8          198.8           13.6         106.8           146.5     (27.1)

Rest of Europe               49.6           62.8         (13.2)        118.8          126.5            (6.1)         58.9           79.5     (25.9)

Total Europe                 48.4           68.0         (19.6)        172.1          163.7             5.1          83.3          111.3     (25.2)

New York                     58.5           76.9         (18.4)        229.4          263.4          (12.9)        134.2           202.6     (33.8)

Regional US                  48.6           51.5           (2.9)       161.5          165.9            (2.7)         78.5           85.5      (8.2)

Total US                     52.3           59.9           (7.6)       190.3          209.3            (9.1)         99.5          125.4     (20.7)

Total Group                  52.1           70.0         (17.9)        173.9          177.4            (2.0)         90.6          124.1     (27.0)

         * For comparability, Q1 2019 Average Room Rate and RevPAR had been translated at constant exchange rates (31 Mar 2020).

                                                                                                                                                      34
CDL Hospitality Trusts
Trading Performance
Q1 2020 Q1 2019 Change
$MM $MM %
Gross Revenue 33.0 46.3 (28.7)
Net Property Income
19.6 33.8 (42.1)
(NPI)
Gross Revenue and NPI decreased mainly due to:
Raffles Maldives Meradhoo
• Global COVID-19 fears directly impacting travel demand as well
as strict lockdown measures including quarantines, safe
distancing, travel bans and complete lockdown of cities. These
disruptions caused CDLHT's properties to either close on a
temporary basis or operate at low occupancies.
• Postponement and cancellations of major MICE and social
events (such as weddings) reducing demand for venue and
function spaces.
Pullman Hotel, Munich
35CDL Hospitality Trusts
Trading Performance
% Change
Country Remarks
in RevPAR
Experienced 30% occupancy rate decline, despite accommodation demand
Singapore (39.8) from foreign workers affected by border closures and returnees serving out
Stay-Home Notices in hotels
Decline in Angsana Velavaru RevPAR. Gestation of Raffles Maldives
Maldives (31.2) Meradhoo disrupted due to the COVID-19 situation and closed on 1 April
2020 to contain costs ahead of low season
New Strong occupancy prior to 19 March lockdown reduced magnitude of
(15.0)
Zealand RevPAR decline
Fewer trade events during the quarter, coupled with occupancy plunge from
Germany (37.0)
the COVID-19 situation
Temporary closure of Hotel Cerretani Firenze – MGallery from 13 March
Italy (37.9)
Despite healthy occupancies in Q1 2020, flexible pricing in the face of
Japan (33.6)
significantly decreased international demand weighed on RevPAR
United Corporate demand hit by COVID-19 concerns, followed by mandatory hotel
(27.3)
Kingdom closures on 24 March
36Disclaimer: This document may contain forward-looking statements that involve assumptions, risks and uncertainties. Actual future performance, outcomes and results may differ materially from those expressed in forward-looking statements as a result of a number of risks, uncertainties and assumptions. Representative examples of these factors include (without limitation) general industry and economic conditions, interest rate trends, cost of capital and capital availability, availability of real estate properties, competition from other developments or companies, shifts in customer demands, customers and partners, expected levels of occupancy rate, property rental income, charge out collections, changes in operating expenses (including employee wages, benefits and training costs), governmental and public policy changes and the continued availability of financing in the amounts and the terms necessary to support future business. You are cautioned not to place undue reliance on these forward-looking statements, which are based on the current view of management on future events. Numbers in tables and charts may not add up due to rounding.
Artist’s impression
                 Amber Park, Singapore
www.cdl.com.sg
You can also read