2020 Interim Results Presentation - For the six months ended 30 September 2019 31 October 2019 - Z Energy

Page created by Dwight Graham
 
CONTINUE READING
2020 Interim Results Presentation - For the six months ended 30 September 2019 31 October 2019 - Z Energy
2020 Interim Results Presentation
For the six months ended 30 September 2019

31 October 2019
Mike Bennetts
Lindis Jones
2020 Interim Results Presentation - For the six months ended 30 September 2019 31 October 2019 - Z Energy
Disclaimer
Please read this page before the rest of the presentation

Please do not read this presentation in isolation
This presentation supplements our half year results announcement dated 31 October 2019. It should be read subject to and in conjunction with the additional information in that
announcement and other material which we have released to NZX and ASX. This material is available on our website, https://investors.z.co.nz. All references in $ are to New Zealand
dollars unless otherwise stated

Forward looking statements are inherently fallible
This presentation contains forward-looking statements and projections. These reflect our current expectations, based on what we think are reasonable assumptions. For any number of
reasons the future could be different – potentially materially different. For example, assumptions may be wrong, risks may crystallise, unexpected things may happen. We give no warranty
or representation as to our future financial performance or any future matter. Consistent with the NZX and ASX listing rules we will communicate with the market if there is a material
change, however we will not update this presentation

Understand our non‐GAAP information
Some of the financial information in this presentation has not been prepared in accordance with generally accepted accounting practice (“GAAP”). In particular, we show results
calculated on the basis of “replacement cost accounting” a widely used and understood Industry measure. It is very important that you understand how this non-GAAP information relates
to our GAAP results. So please read the explanation in the appendices

There is no offer or investment advice in this presentation
This presentation is for information purposes only. It is not an offer of securities, or a proposal or invitation to make any such offer. It is not investment advice or a securities
recommendation, and does not take into account any person’s individual circumstances or objectives. Every investor should make an independent assessment of Z Energy on the basis of
expert financial advice

Please observe any applicable legal restrictions on distribution
Distribution of this presentation (including electronically) may be restricted by law. You should observe all such restrictions which may apply in your jurisdiction

Disclaimer
To the maximum extent permitted by law, we will not be liable (whether in tort (including negligence) or otherwise) to you or any other person in relation to this presentation, including
any error in it

                                                                                                                                                                                             2
2020 Interim Results Presentation - For the six months ended 30 September 2019 31 October 2019 - Z Energy
Headline financials
Full year earnings forecast to be within revised guidance

        Key financials                                                                                                                    1H FY20                                                               1H FY19                                                               Change

        Historical cost net profit after tax (HC NPAT)1                                                                                     $28m                                                                  $139m                                                                (80%)

        Replacement cost EBITDAF (RC EBITDAF) 2                                                                                            $182m                                                                  $175m                                                                  4%

        Replacement cost Net Profit After Tax (RC NPAT) 1                                                                                  $22m                                                                    $72m                                                                (69%)

        Net operating cashflow                                                                                                            $(31m)                                                                   $111m                                                                  

        Interim Dividend                                                                                                                16.5 cents                                                            12.5 cents                                                                 32%

• RC EBITDAF increased by $7m compared to PCP due to increased gross refining margin (GRM) contributions and an accounting adjustment associated
  with the adoption of NZ IFRS 16 - Leases. Offset by an increase in Opex driven by the launch of Z’s new loyalty programme “Pumped”
• RC NPAT decreased due to $35m impairment of Z’s investment in Flick and increased amortisation expense relating to Intangible digital assets
• Net operating cash flow decreased $142m from PCP due to the timing of crude and product payables, Z paying the Fixed Price Option (cash settlement)
  for the CY18 ETS obligation and holding the units for future use given regulatory uncertainty around ETS
• Fully imputed interim dividend record date 22 November 2019 with a payment date of 10 December 2019

 Note 1: HC NPAT has been calculated in accordance with NZ GAAP. RC NPAT and RC EBITDAF have been calculated on the basis of “replacement cost accounting”. In this presentation we show results calculated in accordance with NZ GAAP and results calculated on the basis of “replacement cost accounting”. It is very important   3
 that you understand how the “replacement cost” results relates to our NZ GAAP results. Please read the explanation and consider the reconciliation information in the appendices

 Note 2: 1H FY20 RC EBITDAF has been adjusted for a lag of $2m to remove the volatility associated with moving crude prices
2020 Interim Results Presentation - For the six months ended 30 September 2019 31 October 2019 - Z Energy
HSSE
Focus on zero harm and creating a generative safety culture

• Continued safe management of expanded supply chain with     Total Recordable Case Frequency (TRCF)
  11 terminals under direct Z control
• Robberies declined PCP with no employees harmed

People safety:
• 9 LTIs were a mixture of slips, trips and falls
                                                              0.99
                                                              1H FY19: 1.87
• 6 Robberies is a 45% drop over PCP (1H FY19: 11)
• 8 Life Saver breaches (1H FY19: 26)                         Z Employees: 0.00 (1H FY19: 0.47)
                                                              Retailers and Mini-Tankers: 1.25 (1H FY19: 2.24)
Process safety:
• Tier 1 or Tier 2 process safety incidents: 1 (1H FY19: 0)
• Spills to Ground (loss of containment): 3 (1H FY19: 0)      Tier 1 or Tier 2 process safety incidents
• Executive safety “walk and talks”: 18 (1H FY19: 21)

                                                              1
                                                              1H FY19: 0

                                                                                                                 4
2020 Interim Results Presentation - For the six months ended 30 September 2019 31 October 2019 - Z Energy
Trading conditions
   Reducing economic activity indicated from declining YoY Industry growth

                                       Monthly Industry Volumes - millions of litres 1                                                                 Group Monthly Market Share1
               350                                                                                                                50%
               300
               250                                                                                                                45%
               200
               150
                                                                                                                                  40%
               100
                50
                 0                                                                                                                35%

                                                                                                                                        Oct‐17
                                                                                                                                        Nov‐17

                                                                                                                                         Jan‐18
                                                                                                                                        Feb‐18

                                                                                                                                        Apr‐18
                                                                                                                                        May‐18
                                                                                                                                         Jun‐18
                                                                                                                                          Jul‐18
                                                                                                                                        Aug‐18
                                                                                                                                        Sep‐18
                                                                                                                                        Oct‐18
                                                                                                                                        Nov‐18

                                                                                                                                         Jan‐19
                                                                                                                                        Feb‐19

                                                                                                                                        Apr‐19
                                                                                                                                        May‐19
                                                                                                                                         Jun‐19
                                                                                                                                          Jul‐19
                                                                                                                                        Aug‐19
                                                                                                                                        Sep‐19
                                                                                                                                        Dec‐17

                                                                                                                                        Mar‐18

                                                                                                                                        Dec‐18

                                                                                                                                        Mar‐19
                          Oct‐17
                          Nov‐17

                           Jan‐18

                            Jul‐18
                          Feb‐18

                          Apr‐18
                          May‐18
                           Jun‐18

                          Aug‐18

                           Jan‐19
                          Feb‐19

                          Apr‐19
                          May‐19
                           Jun‐19
                            Jul‐19
                          Aug‐19
                          Dec‐17

                          Mar‐18

                          Sep‐18
                          Oct‐18
                          Nov‐18
                          Dec‐18

                          Mar‐19

                          Sep‐19
                                                  Regular                Premium                  Diesel                 Jet                  Total Petrol    Total Diesel   Total Other Product

   • Industry Petrol volumes are down 9% on PCP, although estimated                                                            • Jet volumes flat on PCP due to a slowdown in visitor arrivals, and an
     to be flat when allowing for Gull’s move to directly importing from                                                         expected consolidation of flight schedules. This is expected following a
     their parent company                                                                                                        period of strong tourism growth and strong jet demand, and has seen
   • Industry Diesel volumes are down 2% on PCP due to slowing                                                                   airlines both cease operations to NZ and reduce the number of flights or
     economic activity in particular forestry, roading infrastructure and                                                        seek more fuel efficient aircraft options
     property development                                                                                                      • Industry Marine Fuel Oil up 2% on PCP due to an increase in shipping
                                                                                                                                 activity to major NZ ports

                                                                                                                                                                                                            5
Note 1: Source is Industry Exchange data at September 2019. This does not include ‘Supply – Industry and Export’ sales
2020 Interim Results Presentation - For the six months ended 30 September 2019 31 October 2019 - Z Energy
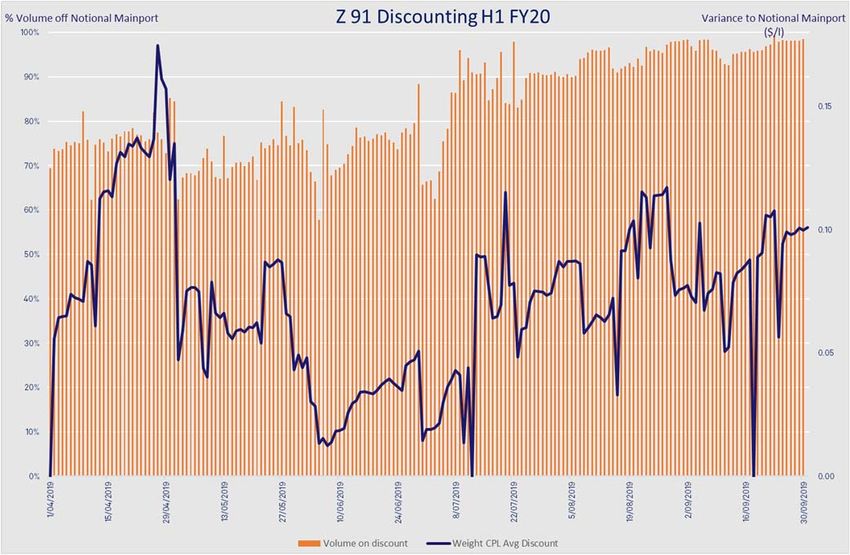
RC EBITDAF variances to FY19
Fuel margins impacted by commodity price movements and RNZ shutdown

                      Refining                                                     Fuels and non fuel                                              Operating expenses and other
•   Refining margin has increased due to the PCP                 •   Drop in Fuel volumes, due to continued competitor                       •     Other revenue from Refining dividends and
    including Refining NZ’s unplanned extended                       investment in new sites (NTI) and slowing economy                             Strategy benefits ($2m) offset by the impacts of
    shutdown, with refinery throughput increasing                •   Increased contribution from Strategy 3.0 following                            IFRS 16 leases adjustment ($1m) and share of
    1.3m bbl, up 15% on PCP                                          refinery optimisation initiatives                                             associate losses ($1m)
•   NZD per barrel margin up 17% due to the refining             •   Non fuel margin declined from the expiry of a legacy                    •     Opex increase as a result of Z’s investment in CX
    NZ shutdown which de-optimised the refining                      Caltex asset lease                                                            capability and implementation of Z’s Pumped
    process in the PCP                                                                                                                             loyalty programme offset by move in lease costs
•   Weaker NZD/USD exchange rate to PCP (0.69 to                                                                                                   to below EBITDAF
    0.66)

        250

        200                                                                                             10                 2                  13
                                         15              7                              8                                                                        4

        150

        100
                     175                                               183                                                                                                       183

         50

          ‐
               1H FY19 EBITDAF   IFRS 16 adjustment   Lead/Lag   1H FY19 EBITDAF   Fuel margin    Refining margin   Non-fuel margin   Operating expenses       Flick       1H FY20 EBITDAF
                Reported ($m)                                          ($M)                                                                                                      ($m)
                                                                                                                                                                                                       6
2020 Interim Results Presentation - For the six months ended 30 September 2019 31 October 2019 - Z Energy
Fuel contribution +3% to PCP
Marketing volume impacted by continued Retail competition and slowing of economy

Sales Volumes (ml)         1H FY20        1H FY19       Change
                                                                                    Fuel Gross Margins (Replacement Cost)
Petrol                       615           626           (2%)               ($m)                                                 cpl
                                                                            800                        700                        17
Diesel                       761           806           (6%)                          685
                                                                            600
                                                                                                       395                       16
Other                        545            537           1%
                                                                            400         347
Total marketing volume       1,921         1,969         (2%)                                                                    15
                                                                            200         335            305              314
Supply sales and exports      26            227          (88%)                 -                                                 14
                                                                                       FY18            FY19            FY20
Total volume                1,947          2,196         (11%)
                                                                                          1H      2H      Fuels cpl margin

• Petrol volumes impacted by competitors continued investment in   • Supply sales and exports down due to arrangement to sell fuel oil to the
  NTI sites, pricing offers and marketing activity                   domestic market rather than export
• Diesel volumes impacted by the general slowing down of the       • Fuel unit margin of 16.5cpl up from PCP 15.5cpl driven by increased cost
  economy                                                            associated with Refining NZ outage in PCP and a change in sales mix
                                                                     between the Z and Caltex retail brands
                                                                   • Loyalty costs increased on retail volume mainly driven by the
                                                                     implementation of discount fuel docket programme (September 2018) 7
2020 Interim Results Presentation - For the six months ended 30 September 2019 31 October 2019 - Z Energy
Retail fuel pricing
Highly competitive market environment with the expansion of differing operating models

                                                                                                                                                                                                              91 Margin YTD FY201
                                                                                                                                                                                                         42

                                                                                                                                                                                                         37

                                                                                                                                                                                 Importer Margin (cpl)
                                                                                                                                                                                                         32

                                                                                                                                                                                                         27

                                                                                                                                                                                                         22

                                                                                                                                                                                                         17

                                                                                                                                                                                                         12

                                                                                                                                                                                                               Z Margin       MBIE Margin

•        In the past year, the percentage of Z’s volume discounted has grown from 70% to almost 100%, another indicator of increased competition from existing or
         new to industry sites
•        The growth of differing models in the market has changed how participants reflect their input costs into their pumped prices

                                                                                                                                                                                                                                            8
    Note 1: Source is https://www.mbie.govt.nz/building-and-energy/energy-and-natural-resources/energy-statistics-and-modelling/energy-statistics/weekly-fuel-price-monitoring
2020 Interim Results Presentation - For the six months ended 30 September 2019 31 October 2019 - Z Energy
Non fuel margin -5% to PCP
Decline in non fuel margin driven by the end of a legacy Caltex rental agreement ($2m pa)

 Operational Metrics                  Tier 1         Tier 2        Tier 3
                                                                                                              Non Fuel Margin
 Number of stores      1H FY20          95            77             28               ($m)
                                                                                       80
                       1H FY19          94            73             34
                                                                                       60           38                 43
 Average weekly shop sales             $48k          $29k           $18k
                                                                                       40
 Sales growth                           7%            7%            8%
                                                                                       20           38                 38                36
 Total transaction count YoY           (2%)          (2%)           (2%)
                                                                                        -
 Store transaction count YoY            1%            1%            (1%)                           FY18               FY19              FY20
                                                                                                                 1H             2H

• Average weekly shop sales growth driven by increase in Food and Drink categories (e.g. Z Food and Coffee, beverages and snacks), excise tax on
  Tobacco products
• Focus on building credibility in food and coffee through investment in new coffee equipment, pre-order app to include additional chilled drinks
• Pre-order App revenue equal to 7% of total coffee sales, with 40% of first time customers converted to repeat customers
• During September, Z has teamed up with Habitual Fix to trial a new food offer At Z Royal Oak (Auckland)
• Non-Fuel margin has decreased due to the end of a Caltex legacy rental agreement ending 31 December 2018 ($2m per annum)

                                                                                                                                                    9
2020 Interim Results Presentation - For the six months ended 30 September 2019 31 October 2019 - Z Energy
Refining margin +43% to PCP
Refining margins recover following the RNZ shutdown in 1H FY19

Regional markets and Refining NZ

• Regional refining margins were lower than the PCP by $2.16 per                          Refining Margin                Per Barrel
                                                                           ($m)
  barrel, although this was more than offset by the negative impact of                                                      ($)
  the extended refinery shutdown in 1H FY19                                 90
                                                                                   77                                            14
• Improved refining availability compared to PCP resulted in               70                                                    12
  optimisation benefits and increased throughput                                   36            54                              10
• Average NZD/USD FX rate of 0.66 compared to PCP rate of 0.69             50
                                                                                                                                 8
                                                                                                 31
                                                                           30                                                    6
                                                                                   41                                 33         4
                                                                            10                     23
Z Performance                                                                                                                    2
                                                                           (10)   FY18         FY19                 FY20         -
• Processing volumes increased to 10.2m barrels from 8.9m barrels in
  the PCP largely due to an extended refinery shutdown in 1H FY19                        1H   2H        $/bbl GRM
• Refining margin makes up 9% of total gross margin, up from 6% in PCP
• Average refining margins up $1.59 per barrel compared to PCP mainly
  due to extended shutdown in 1H FY19
• The refinery joint venture with Mobil generated increased efficiencies
  compared to PCP
                                                                                                                                      10
Capital management
  Interim dividend consistent with current earnings guidance
             Metrics                                                       1H FY20                     1H FY19                         Change               Capex ($m)                    1H FY20    1H FY19            Change

             Gross debt1                                                    $906m                        $946m                         ($40m)               Growth4                         14          17                3

             Gross Debt/EBITDAF2                                                2.1x                        2.4x                           0.3x             Integrity                       25         15                (10)

             Gross Debt/EBITDAF                                                                                                                             Divestment Proceeds            (30)        (7)                23
                                                                                2.6x                            -                            
             (NZ IFRS16 adjusted)3
             Cost of debt                                                      5.2%                         5.4%                        (0.2%)              Net capex                       9          25                 16

    • Gross debt made up of $480m domestic retail bonds, $378m USPP
                                                                                                                                                                           Dividends and RC Earnings per Share
      notes and $48m bank term debt, $135m of retail bonds maturing                                                                                        CPS                                                                   EPS
      November 2019 to be refinanced via existing bank term debt facility                                                                                   40                                                                    60
    • 32% increase in the interim dividend to 16.5 cps ($66m) compared to                                                                                   30                              30.5                                  40
      FY19 12.5 cps ($50m)                                                                                                                                  20           21.9
    • Capex spend reflects Z’s commitment to fund growth capex with                                                                                         10
                                                                                                                                                                                                                                  20
                                                                                                                                                                                            12.5                 16.5
      divestments                                                                                                                                                        10.4
                                                                                                                                                             -                                                                    -
                                                                                                                                                                         FY18               FY19                 FY20
                                                                                                                                                                                Interim      Final           RC EPS
Note 1: Gross is defined as the sum of gross domestic retail bonds, gross USPP issuance, bank debt and excludes working capital funding and cash on hand
Note 2: Debt coverage is calculated as gross debt divided by 12 months RC EBITDAF. Covenants calculated under the frozen GAAP method                                                                                                  11
Note 3: Debt coverage adjusted for impact of NZ IFRS 16 – Leases accounting standard
Note 4: Growth Capex excludes investment in Flick Energy Limited $47m
Flick performance
Impairment of Investment ($35m) reflects performance to date and challenging outlook

• Flick business re-focussed on developing sustainable products that
  leverage Z channel

• Costs managed in year to offset lower revenue, product
  development costs and higher than forecast energy prices

• Write down of Z’s investment based upon lower income from new
  customers over the short to medium term

• Electricity Price Review favourable to certain extent, however no
  certainty of competitive power prices in the next 12 months

• Bundled Z offers being trialled in market from September to identify
  the best proposition to scale

                                                                                       12
 Note: Information sourced from Flick Energy Limited
Strategy 3.0
Cumulative Strategy 3.0 delivery expected to exceed guidance of $30‐35m of EBITDAF

 Business Unit                              Work Streams                                            FY20 Forecast

                                            •   Consolidate terminal network in-house
 Supply                                     •   Single hired carrier outsourced
                                                                                                      $14-15m
 Optimising scale                           •   Renegotiate industry structures
                                            •   Change partner to Mobil for refinery optimisation
                                            •   Jet to import parity
 Commercial
                                            •   SME technology and offer development
 Integrating offers while moving to                                                                   $24-26m
                                            •   Leveraging Distributor partnerships
 common platforms
                                            •   Consolidate Truckstop network and card platforms

 Retail                                     • Capital release from next best alternative
 Differing brand positions and segmenting   • Data and loyalty solution                                 $2m
 customers for ‘true’ loyalty               • Convenience retail initiatives

 EBITDAF contribution                                                                                 $40-43m

                                                                                                                    13
Net promoter score (NPS)
  Focus on delivering initiatives to lift customer experience by solving pain points

                                                       +46 Target

                                                       +41 1H FY20
                                                                     Drivers of NPS                    Delivery in 1H

                                                                                                        • Continued App development for Z and Caltex customers,
                                                                     Speed – feel like I can get in       e.g. multiple forms of loyalty cards (Fly Buys, Airpoints)
           Apr 19 May 19 Jun 19   Jul 19   Aug-19 Sep-19             and out quickly. It’s easy.          into App
                                                                                                        • Pre-order platform scaled to 172 Z sites
                                                                                                        • Pumped and Z Business being implemented into Fastlane
                                                                     Recognise me and my loyalty
                                                                                                        • Airpoints into Pumped program
                                                                     – personalised recognition for
                                                       +22 Target                                       • Pumped launched across both Z and Caltex networks
                                                                     choosing us and rewarded for
                                                       +21 1H FY20                                      • Sharetank MVP into pilot with launch end October
                                                                     their efforts.
                                                                     Service – friendly and
           Apr 19 May 19 Jun 19   Jul 19   Aug-19 Sep-19             efficient service (in person or    • Habitual Fix pilot at Z Royal Oak to test fresh food offer
                                                                     via technology), anticipating      • Development of Digital B2B portal
                                                                     their needs.
                                                                                                        • Z Business replaces separate legacy Z and Caltex
                                                                     Value – producing value for
                                                                                                          platforms
                                                       +21 1H FY20   money and value me and my
Business
                                                                                                        • Customer transition for Z Business on track for completion
                                                                     business.
                                                       +15 Target                                         by end December

           Apr 19 May 19 Jun 19   Jul 19   Aug-19 Sep-19                                                                                                               14
Government relations
Engagement with Government across multiple areas

Market study                                                        RAP Inquiry
• Draft report revealed profitability calculated on a starkly       • 21 recommendations in report to Minister: protecting the RAP and
  different basis, with more than 40% of Z’s balance sheet not        other infrastructure; better planning and preparation for a crisis;
  included in Commission’s analysis                                   timely investment in infrastructure

• That higher returns have not persisted is a key distinction in    • Recommends building new infrastructure for diversity of supply and
  considering any regulatory response                                 operating minimums for storage and inventory

• Conference confirmed the complexity of the industry and           • Recommends the Government legislates to put regulatory options in
  potential for regulation to increase costs to customers             place, in case the sector does not make the necessary progress by
                                                                      30 June 2020
• Z has a preference for clear recommendations as opposed to
  recommending further work                                         • Industry’s current actions focused on a feasibility study (pre FEED)
                                                                      for additional tankage at WOSL (~$30m) and upgrading WAP
• Z’s final submission completed on 16 October 2019, final report     capacity by 10-50% ($2-8m) over the next three years, while
  due 5 December 2019                                                 advancing alternative supply chain options

                                                                                                                                             15
Margins and returns continue to decline
Competition predictably lowers returns

                                                                                                • Profit per litre is based on Z’s NPAT, including non fuel
                          Two ways to assess the effects of competition                           revenues, divided by fuel litres sold

 CPL                                                                                            • Z’s ROACE (return on average capital employed) is
       7                                                                                  30%     calculated as
       6                                                                                            • Earnings: RC NPBT + lease expense + net interest
                                   24%                                                    25%
                                                    23%                                               expense – tax (on this revised profit figure)
       5
                   19%                                                                    20%       • Capital Employed: Total assets (including right-of-
       4                                                     17%
                                                                                                      use assets) + fair value adjustment of terminal
                                                                                          15%
       3           12%             12%                                        12%                     assets + D&R provision – net derivative financial
                                                    10%                                   10%
       2                                                      8%                                      instruments, less current liabilities excluding. short
                                                                              7%
       1                                                                                  5%          term borrowings and accounts payable relating to
                    3.8            4.5               4.7      4.1             3.5                     inventory
       -                                                                                  0%
                  FY16            FY17             FY18      FY19         1H FY20*
                                                                                                • 1H FY20 ROACE is based on the 1H FY20 earnings
                                                                                                  extrapolated for 12 months (less Flick’s results), while
           Profit per litre          Z's approach to ROACE     Commissions approach to ROACE
                                                                                                  average capital employed is the average of FY19 and
                                                                                                  1HFY20

                                                                                                • 1H FY20 Profit per litre is based on 1H RC NPAT less
                                                                                                  Flick’s results divided by fuel litres sold

                                                                                                                                                               16
Looking forward for 2H
Very difficult to accurately assess the margin outlook for Retail

• 90% of the YTD gap to the original RC EBITDAF guidance arises from Retail, where the
    gap is split between volume (35%) and unit margin (65%)
•   Assumptions for 2H remain unchanged from original guidance for Brent crude price of
    US$70/bbl and an FX rate of 0.68
•   Market consensus is that the impact of IMO 2020 to be more limited than the original
    guidance for GRM upside offset by fuel oil pricing downside
•   Divestments of $30m YTD to be supplemented by a further $5-15m in 2H, funding
    growth capex while underwriting a further debt repayment of $20m
•   Deliverables and milestones in 2H include implementation of Sharetank MVP, scaling up
    of Fastlane, marketing automation, and Caltex app development
•   Continue to evolve brand and price positioning of Z to BP, with Caltex to Mobil and Gull
•   Major risks to financial delivery include Retail unit margins and IMO 2020 impacts
•   Guidance retained at $390-430m of RC EBITDAF and fully imputed dividend of 48-50
    cents per share
•   If Retail margins do not change from the August to October actuals, then this would
    indicate the bottom of the range, with the mid point dependent on an improvement on
    recent months

                                                                                               17
Appendices
1.   Financial results
2.   Profit and loss
3.   Operating Expenses
4.   Items below RC
     EBITDAF
5.   Balance sheet
6.   Working capital
7.   Operational Data
Financial Results
Basis of preparation

•   Z adopted NZ IFRS 16 Leases from 1 April 2019

Non-GAAP Accounting Measure - Replacement Cost (RC) earnings:

• Is a non-GAAP measure used by the downstream fuel industry to measure and report business performance

• RC earnings adjusts purchases of crude and product as if the product sold in a month had been purchased in that month, rather than the Historical Cost
  (HC) which reflects the prices actually paid

• RC earnings exclude the impact of changes in crude oil and refined product prices on the value of inventory held by Z, thus it is a better measure of
  underlying performance

• The difference between HC earnings and RC earnings is the Cost of Sales Adjustment (COSA) and the foreign exchange and commodity gains and
  losses. Refer to the reconciliation between HC NPAT and RC NPAT in these appendices

• From FY20 onwards commercial pricing lead/lags on product sales will be removed from RC results. Pricing lead/lags occur on product sales when
  product cost movements are not correlated with contracted customer contracts

                                                                                                                                                           19
Profit and Loss
$(m)                                                           1H FY20   1H FY19   Change
Revenue                                                         2,461     2,674     (8%)
 - Fuel margin                                                   314      304       3%
- Non Fuel margin                                                36        38       (5%)
- Refining margin                                                33        23       43%
- RNZ Dividend and Flick                                          2         1       100%
RC gross margin                                                  385       366      5%
Operating expenses                                              (202)     (191)     (6%)
RC Operating EBITDAF                                             183       175
Share of (loss)/earnings of associate companies (net of tax)     (1)        -       (1)
RC EBITDAF                                                       182       175      4%
Depreciation and amortisation                                   (74)      (57)     (30%)
Net financing expense                                           (24)      (26)      8%
Other                                                            (8)       (3)       
Impairment                                                      (35)        -
Taxation                                                        (19)       (17)    (12%)
RC NPAT                                                          22        72      (68%)
Reconciliation from RC NPAT to statutory NPAT
Tax on COSA                                                      (5)      (38)
COSA (difference between RC and HC Gross Margin and EBITDAF)     18        136      87%
Foreign exchange and commodity losses                            (7)       (31)     87%
Net profit per the statutory financial statements                28        139      74%
HC gross margin                                                 403       502      (80%)
                                                                                            20
HC EBITDAF                                                       193      280
Operating expenses
$(m)                                                                           1H FY20                      1H FY19                      Change
 Employee benefits                                                               42                           36                          17%
 Secondary distribution                                                          35                           33                           6%
 Administration and other                                                        32                           33                          (3%)
 Selling commissions                                                             31                           30                           3%
 On-site                                                                         18                           28                          (36%)
 Marketing                                                                       17                            7                           
 Professional fees                                                               14                           12                          17%
 Storage and handling                                                            9                            9                            0%
 Insurance                                                                       4                             3                          33%
Total operating expenses (excluding FX on fuel purchases)                       202                           191                          6%

• Employee benefits increased $6m due to investment in CX capability and increase in staff bonus accruals from FY19
• On-site costs decreased to PCP due to the introduction of NZ IFRS 16 Leases, rental expense is now reported below the line as financing expense
• Marketing costs increased $10m to PCP due to introduction of Pumped Stacking replacing AASF in FY20, re-launch of Good in the Hood and Brand
  campaign

                                                                                                                                                    21
Items below RC EBITDAF
$(m)                                                             1H FY20                          1H FY19                          Change

 Depreciation (including leases)                                   41                               32                              28%

 Impairment                                                        35                                -                               

 Amortisation                                                      33                               25                              32%

 Net financing expenses                                            24                               26                              (8%)

 Taxation (including tax impact of COSA)                           19                               17                               12%

 Lease Interest income/expense                                      8                                -                               

 Fair value movements on interest rate derivatives                  5                                5                               0%

 Gain on sale of fixed assets                                      (2)                              (2)                              0%

 Movements in decommissioning and restoration provision            (3)                               -                               

Total items below RC EBITDAF                                      160                               103                             55%

• Depreciation increased by $9m to PCP due to the introduction of NZ IFRS 16 Leases, increase in depreciation expense on the right of use assets
• Impairment increased by $35m due to the write off the Flick Goodwill
• Amortisation increased by $8m to PCP due to Flick intangibles acquired FY19, Z Business card platform and Pumped software

                                                                                                                                                   22
Balance sheet
$(m)                                                              1H FY20                             1H FY19                             Change

Shareholders equity                                                  832                                941                                (12%)
Total current assets                                                1,021                               1,359                              (25%)
Total non current assets                                            2,114                               1,714                               23%
Total assets                                                        3,135                               3,073                               2%
Total current liabilities                                            933                                1,018                               8%
Total non current liabilities                                       1,370                               1,114                              (23%)
Total liabilities                                                   2,303                               2,132                               (8%)
Net assets                                                           832                                941                                (12%)

Net asset movement explained by:
• Current assets decreased due to lower inventory and lower accounts receivable. Inventory has normalised from the high levels of the PCP which were
  due to the extended RNZ shutdown resulting in delays in processing crude. Accounts Receivable has decreased from the PCP due to lower commodity
  prices
• Non current assets have increased due to the adoption of NZ IFRS 16 leases. As a result of the new leases standard Z has recognised a right of use assets
  associated with its leases of $286m. Intangible assets have also increased due to Z paying the fixed price offer for the CY18 ETS obligation and holding
  the units for future use given regulatory uncertainty around the ETS
• Current liabilities have decreased on the PCP due to a decrease in Accounts payable associated with lower levels of inventory on hand, this has been
  partially offset by an increase in short term debt as Z has $135m of retail bonds maturing November 2019 to be refinanced via bank term debt facility
• Non current liabilities have increased due to the recognition of the lease liability of $286m associated with the adoption of NZ IFRS 16 leases         23
Working capital
                                                                    1H FY20                            1H FY19                             Change

Accounts receivable and prepayments                                  $293m                              $381m                               (23%)

Average receivable days                                              25 days                           20 days                              5 days

Closing Inventory balance                                            $680m                              $846m                               (20%)

Closing barrels on hand                                               5.3m                              6.4m                               1.1m bbls

Average inventory days on hand                                       77 days                           74 days                              3 days

Accounts payables, accruals and other liabilities                    $621m                              $851m                               (27%)

• Average receivable days are up 5 days due to a large ETS receivable in 1H FY20 following the leasing of Z’s ETS units to a third party
• Inventory has normalised from the high levels of the PCP which were due to the extended RNZ shutdown resulting in delays in processing crude
• Average inventory days has increased due to a fall in sales volumes partly offset by a decrease on average inventory on hand (bbl) for the period
• Accounts payable has decreased as Inventory has normalised from the high levels of the PCP which were due to the extended RNZ shutdown resulting in
  delays in processing crude

                                                                                                                                                       24
Operational Data
For the half year ended 30 September 2019

Health, safety, security and environment (HSSE)                                                                        September 2019   September 2018   June 2019

Lost time injuries                                                                                                           3                6             6

Spills to ground                                                                                                             1                0             2

Robberies1                                                                                                                   2                6             4

Fuel quality incidents                                                                                                       0                0             0

Process safety incidents                                                                                                     0                0              1

Food safety incidents                                                                                                        0                1              1

Total recordable case frequency                                                                                             0.6              1.8            1.4

Motor vehicle incidents frequency                                                                                            0                0             1.2

Refining                                                                                                               September 2019   September 2018   June 2019

USD GRM per barrel                                                                                                          7.102            6.86           6.63

NZD GRM per barrel3                                                                                                         10.82            10.20          9.78

1    Robberies reported only relates to Z Retail sites. Caltex sites are owned and operated by independent retailers
2    This number is from Refining NZ published data for the July/August period                                                                                       25
3    The NZD conversion is calculated by Z
Operational Data
For the half year ended 30 September 2019

Fuels ‐ All fuels in millions of litres                        September 2019   September 2018   June 2019

Total industry volumes (all fuels)4                                 2,165            2,271         2,159

Z Group total fuel volumes                                          970              1,145         978

Petrol - Z Retail5                                                  180               171           188

           - Caltex Retail                                           85              106            99

Diesel - Z Retail                                                    73               72            74

         - Caltex Retail                                             34               38            37

         - Commercial                                               186              197            191

Other fuels                                                         261              279           259

Supply - Domestic                                                   127              127            128

           - Industry & Export                                       24              155            2

 4 Excludes “Supply – Industry & Export” sales
 5 Z Retail volumes include volumes from 53 Foodstuffs sites                                                 26
Operational Data
For the half year ended 30 September 2019

Customer Experience                                                                  September 2019   September 2018   June 2019

Z Retail customer satisfaction6                                                            93%              90%           92%

Total Z Retail transaction count                                                       13.6 million     13.8 million   13.9 million

Z Retail: fuel-only transactions                                                        6.9 million      7.2 million   7.2 million

Z Retail: fuel and store transactions                                                   1.5 million      1.6 million   1.5 million

Z Retail: store only transactions                                                       5.2 million      5.0 million   5.2 million

Z Average weekly store sales                                                             $36,286          $33,870       $36,679

Z Average weekly store sales like-for-like                                               $36,450          $34,346        $37,173

Number of Z branded service stations                                                       201              203            201

Number of EV charging stations                                                              8                8              8

Caltex Retail customer satisfaction6                                                       83%              80%           79%

Number of Caltex branded service stations                                                  138              140            139

Number of truck stops7                                                                     154              155            155

 6    Customer satisfaction determined using ongoing internal customer measurement
 7    This figure represents the combined Z and Caltex branded truck stops                                                            27
You can also read