2Q19 Investor Presentation

Page created by Victoria Thomas
 
CONTINUE READING
2Q19 Investor Presentation
Investor
2Q19   Presentation

                      1
2Q19 Investor Presentation
Disclaimer
The information contained in this presentation is only a summary and does not purport to be complete. This presentation has been prepared solely for informational purposes and should not be construed as financial,
legal, tax, accounting, investment or other advice or a recommendation with respect to any investment. This presentation does not constitute or form part of any offer or invitation for sale or subscription of or
solicitation or invitation of any offer to buy or subscribe for any securities, nor shall it or any part of it form the basis of or be relied on in connection with any contract or commitment whatsoever.

This presentation includes estimates and forward-looking statements within the meaning of the U.S. federal securities laws. These estimates and forward-looking statements are based mainly on our current
expectations and estimates of future events and trends that affect or may affect our business, financial condition, results of operations, cash flow, liquidity, prospects and the trading price of our preferred shares,
including in the form of ADSs. Although we believe that these estimates and forward-looking statements are based upon reasonable assumptions, they are subject to many significant risks, uncertainties and
assumptions and are made in light of information currently available to us.

These statements appear throughout this presentation and include statements regarding our intent, belief or current expectations in connection with: changes in market prices, customer demand and preferences and
competitive conditions; general economic, political and business conditions in Brazil, particularly in the geographic markets we serve as well as any other countries we currently serve and may serve in the future; our
ability to keep costs low; existing and future governmental regulations; increases in maintenance costs, fuel costs and insurance premiums; our ability to maintain landing rights in the airports that we operate; air
travel substitutes; labor disputes, employee strikes and other labor-related disruptions, including in connection with negotiations with unions; our ability to attract and retain qualified personnel; our aircraft utilization
rate; defects or mechanical problems with our aircraft; our ability to successfully implement our growth strategy, including our expected fleet growth, passenger growth, our capital expenditure plans, our future joint
venture and partnership plans, our ability to enter new airports (including certain international airports), that match our operating criteria; management’s expectations and estimates concerning our future financial
performance and financing plans and programs; our level of debt and other fixed obligations; our reliance on third parties, including changes in the availability or increased cost of air transport infrastructure and
airport facilities; inflation, appreciation, depreciation and devaluation of the real; our aircraft and engine suppliers; and other factors or trends affecting our financial condition or results of operations, including those
factors identified or discussed as set forth under “Risk Factors” in the prospectus included in our registration statement on Form F-1 (No. 333-215908) filed with the Securities and Exchange Commission (the
“Registration Statement”).

In addition, in this presentation, the words “believe,” “understand,” “may,” “will,” “aim,” “estimate,” “continue,” “anticipate,” “seek,” “intend,” “expect,” “should,” “could,” “forecast” and similar words are intended to
identify forward-looking statements. You should not place undue reliance on such statements, which speak only as of the date they were made. We do not undertake any obligation to update publicly or to revise any
forward-looking statements after we distribute this presentation because of new information, future events or other factors. Our independent public auditors have neither examined nor compiled the forward-looking
statements and, accordingly, do not provide any assurance with respect to such statements. In light of the risks and uncertainties described above, the future events and circumstances discussed in this presentation
might not occur and are not guarantees of future performance. Because of these uncertainties, you should not make any investment decision based upon these estimates and forward looking statements.

In this presentation, we present EBITDAR for limited purposes solely as a valuation metric. EBITDAR is defined as EBITDA further adjusted to exclude expenses related to aircraft and other rent. EBITDA, which is
defined as EBITDA adjusted to exclude foreign currency exchange, net, derivative financial instruments, net, other financial expenses, other financial income, and result from related parties, net (as applicable).
EBITDA, which is defined as net income (loss) minus interest income (comprised of interest on short-term investments), plus interest expense (comprised of interest on loans and interest on factoring credit card and
travel agencies receivables), current and deferred income tax and social contributions, and depreciation and amortization.

EBITDAR is included as supplemental disclosure because (i) we believe EBITDAR is traditionally used by aviation analysts and investors to determine the equity value of airlines and (ii) EBITDAR is one of the
metrics used in our debt financing instruments for financial reporting purposes. We believe EBITDAR is useful for equity valuation purposes because (i) its calculation isolates the effects of financing in general, as
well as the accounting effects of capital spending and acquisitions (primarily aircraft) which may be acquired directly subject to acquisition debt (loans and finance leases) or by operating leases, each of which is
presented differently for accounting purposes and (ii) using a multiple of EBITDAR to calculate enterprise value allows for an adjustment to the balance sheet to recognize estimated liabilities arising from off-balance
sheet operating leases. However, EBITDAR is not a financial measure in accordance with International Financial Reporting Standards (“IFRS”), and should not be viewed as a measure of overall performance or
considered in isolation or as an alternative to net income, an alternative to operating cash flows, a measure of liquidity, or the basis for dividend distribution because it excludes the cost of aircraft and other rent and is
provided for the limited purposes contained herein. As for the use of EBITDAR in our debt financing instruments, see “Management’s Discussion and Analysis of Financial Condition and Results of Operations—Loans
and Financings” in the prospectus included in the Registration Statement.

The valuation measure EBITDAR has limitations as an analytical tool. Some of these limitations are: (i) EBITDAR does not reflect our cash expenditures, or future requirements, for capital expenditures or contractual
commitments; (ii) EBITDAR does not reflect changes in, or cash requirements for, our working capital needs; (iii) EBITDAR does not reflect the significant interest expense, or the cash requirements necessary to
service interest or principal payments, on our debts; (iv) although depreciation and amortization are non-cash charges, the assets being depreciated and amortized will often have to be replaced in the future and
EBITDAR does not reflect any cash requirements for such replacements; and (v) EBITDAR is susceptible to varying calculations and therefore may differ materially from similarly titled measures presented by other
companies in our industry, limiting its usefulness as a comparative measure. Because of these limitations EBITDAR should not be considered in isolation or as a substitute for financial measures calculated in
accordance with IFRS. Other companies may calculate EBITDAR differently than us. For a calculation of EBITDAR and a reconciliation to net income (loss), see “Summary Financial and Operating Data” and
“Selected Consolidated Financial Information” in the prospectus included in the Registration Statement. The concept of EBITDAR presented herein is the same as the concept of Adjusted EBITDAR presented in the
Registration Statement.

This presentation and its contents are proprietary information and may not be reproduced or otherwise disseminated in whole or in part without Azul’s prior written consent.
.

                                                                                                                                                                                                                                    2
2Q19 Investor Presentation
Azul at a Glance
The fastest-growing, most profitable and best positioned airline in Brazil

 #1     in destinations served
        (100+)

 #1     in 84% of
        markets served

 #1     in domestic departures

 #1     in on-time performance and
        customer satisfaction

 #1     Profitability and balance sheet

                                                                             3
2Q19 Investor Presentation
Azul Milestones
                                                                                                           R$9.2 Bn revenue
    Fastest airline                                                              TAP and HNA               US$3 Bn market cap
    to one million    2011                    2014                               partnership
    passengers        Launch of               Order of 63 A320neos
                      ATR fleet               and 33 Embraer E2s                 Transferred 15 aircraft
        2009                                                                     to TAP during crisis
                                              Launch of international flights
                                                                                    2016                         2018

2008
Raised US$
250 million in                                                                               2017
start-up capital             2012
                                    Acquisition of Trip, largest                             IPO
Launched Azul                       regional airline in South                                US$ 643 million
in 10 months                        America

                                                                   2015
                                                                   United partnership
                                                                   TudoAzul dedicated management

                                                                                                                           4
2Q19 Investor Presentation
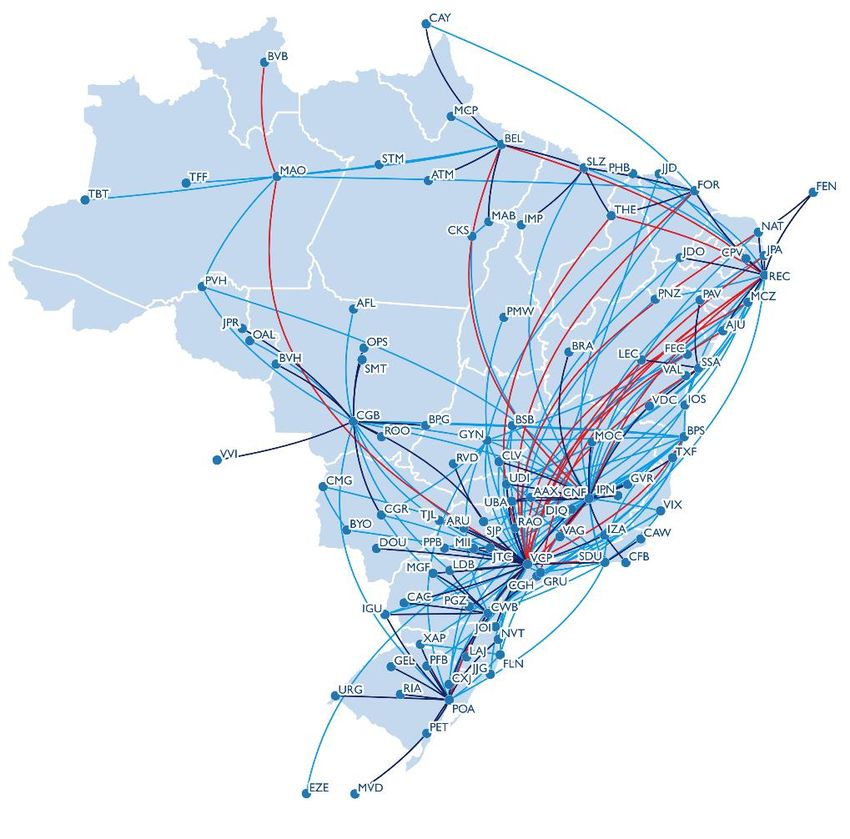
Positive Fundamentals Driving the Brazilian Aviation Market
Growth in the Brazilian middle class supported by rising per capita income, leading
to more passengers and flights per capita in Brazil
       Brazil Domestic Passengers by Year
                                                                                Domestic Flights Per Capita
                   (in millions)

           2007-2018

   Brazil GDP CAGR +1.5%                                                                                             2.7
    Real depreciation 89%
     131
                                                    126
                              CAGR
                               +7%

                               94
                              21
                        21                                                                                    1.3
                                                  131

                                                                                                    0.8
           44                                                                             0.8
                              68
                               72                                                0.5
           47
                                                                        0.3

           2007                2018                2022E               Brazil   Brazil   Mexico   Colombia   Chile   US
                                                                       2007     2018      2018      2018     2018    2018

           Source: Azul, ANAC, IATA, CEBR, ABEAR, IBGE and Bloomberg
                                                                                                                            5
2Q19 Investor Presentation
Sustainable, Defensible Business Model

1                                        2
    Largest network with multiple hubs       Unparalleled network connectivity

3                                        4
     Diversified fleet                       Renowned Customer Service

                                                                                 6
2Q19 Investor Presentation
Market and Route Leadership
Azul is strongly positioned in Brazil, with strong presence in underserved markets…

               Most Relevant Airline by City                                       Azul Route Position
                     (December 2018)                                              (Domestic, June 2019)

                                                                   Domestic
                                                                                         Cities           Number of Daily
                                                                    Cities
                                                                                        Where #1*           Departures
                                                                    Served

                                                                                                           822
                                                                  104

                                                                                                                 664
                                                                                       75
                                                                                                                       596

                                                                        54
                                                                             45

                                                                                             16

                                                                                                  6

 • Strong penetration in underserved markets
 • Hubs located in Campinas (VCP), Belo Horizonte (CNF) and
   Recife (REC), three of the largest airports and metropolitan
                                                                              Azul          Gol       LATAM
   areas in the country

            Source: Azul, ANAC and Companies
            * Considers leadership by number of departures                                                                   7
2Q19 Investor Presentation
Limited Route Overlap with Competitors
Azul’s limited overlap with other Brazilian carriers gives it significant pricing
advantage
                         Azul Routes Leadership
                                                                                        Route Overlap
                                      (2Q19)

             Up from 56% in 2012                                                                          86%

                                                     Frequency advantage
                                               12%
                   Only carrier 72%
                                               16%
                                                     Other

                                                                                            28%
                              Leadership Share
                                                                              21%
     % of routes                                             84%

     % Revenues                                              83%

                                                                           Azul-Latam      Azul-Gol     Latam-Gol

                                                                                                                    8
2Q19 Investor Presentation
Leader in 8 Out of Company’s Top 10 Airports
…making the Company the leader on most of the routes it serves

                 Nonstop Domestic Destinations by Airport
                                                                                                             Flights per day on Selected Routes
                                                    (June 2019)

                                Azul           LATAM        Gol              Departure   Destination
                                                                               Rank        Rank        Top Routes by # of Flights     Azul    Gol    TAM
                                                                        51
 1. Campinas        1                                                          1st           1st       Campinas–Rio de Janeiro        14x     2x      -
                         4
   2. Belo                                                         40
                                7                                              1st           1st       Campinas-Belo Horizonte        11x      -      -
  Horizonte                      8
                                                       26                                              Campinas–Curitiba               9x      -      -
  3. Recife             3                                                       1st          1st
                             6
                                               17                                                      Campinas–Porto Alegre           9x      -      -
  4. Cuiabá          2                                                          1st          1st
                     2
                                                                                                       Belo Horizonte–Vitória          7x      -      -
   5. Porto                               14
                            5                                                   1st          1st
    Alegre                      7                                                                      Campinas–Cuiabá                 5x      -      -
                                          14
 6. Curitiba                5                                                  1st          1st
                                7                                                                      Campinas–Ribeirao Preto         5x      -      -
                                        12
 7.Rio (SDU)                5                                                  3nd          1st        Belo Horizonte-Montes Claros    4x      -      -
                                7

   8. São                               12
                                                            33                  3th          4th
 Paulo (GRU)                                                  35
                                     10
  9. Goiânia                5                                                                             Higher frequency attracts business travelers,
                        3                                                       1st          1st
                                                                                                                    who value convenience
                                     10
  10. Belém                  6                                                  1st          1st
                                    9

               Source: Azul, ANAC and Companies                                                                                                            9
2Q19 Investor Presentation
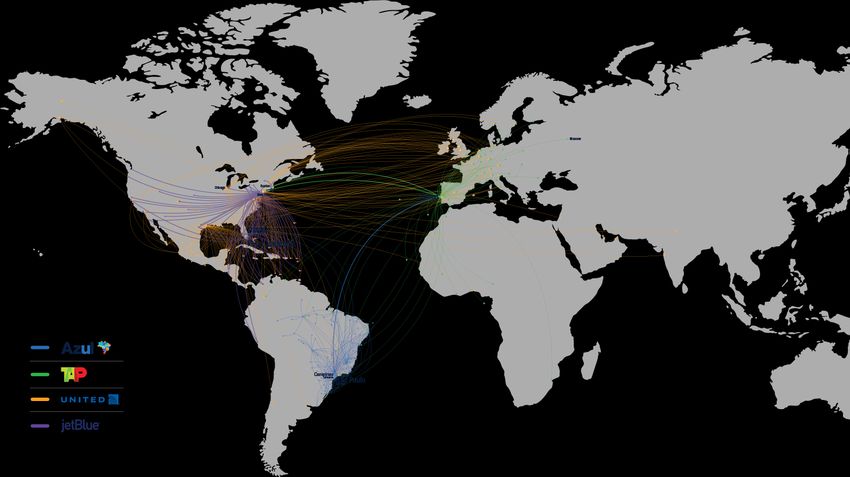
Exclusive Provider on Key Routes
Limited number of local passengers means individual routes cannot sustain new
entrants
                                                 Spoke Example: Ribeirão Preto–Campinas

                                                                                                              Connection Breakdown

                                                                                                                           Local
                                                                                                                            6%

                                                                                        DOU     Dourados

                                                                                                               Connecting
                                                                                                                 94%
                                                                                  TJL
                                                                                          Três Lagoas
  Exclusive destination      Non-exclusive destination                     +43

                                                   Hub-to-Hub Example: Cuiabá–Campinas

                                                                                                              Connection Breakdown

                                                                                                                           Local
                                                                                                                           12%

                                                                                         DOU       Dourados

                                                                                               DOU

                                                                                                              Connecting
                                                                                   TJL                          88%
                                                                            +43               Três Lagoas

              Source: Azul                                                                                                           10
Fortress Hub at Campinas Airport
Campinas Airport (VCP) is located about one hour from São Paulo in Campinas,
one of the wealthiest and most populated regions in Brazil
             Campinas Airport Influence Area                Campinas Airport Catchment Area

                                               Campinas Metropolitan Region
                                                      VCP is the primary airport serving Campinas metropolitan
                                                       region
                                                      Population: 3.1 million; economic output: R$ 139B

                                               Campinas Catchment Area
                                                      Convenient and fast highway access to VCP
                                                      Population: 5.2 million; economic output: R$ 187B
                             VCP
                            Airport

                                               São Paulo Metropolitan Region
                                                      São Paulo: largest city and economic hub in Brazil
                                                      Population 17.6 million; economic output: R$ 662B

                                               VCP vs. GRU Competition
                                                      Only 4% of VCP passengers reside in São Paulo city
                                                      Easy access through high-capacity freeways:
                                                   -     VCP: 60-75 min drive from São Paulo during peak hours
• Total population in region: 26 million
                                                   -     GRU: up to 180 minutes to GRU
• Total economic output from region: R$ 988B

            Source: Azul and IBGE                                                                                 11
Fortress Hub at Campinas Airport

                                   12
Strong Connectivity at Multiple Hubs
                                                            Daily             Cities Served        Connecting
                                                           Flights             (non-stop)          Passengers
        Campinas
        Strong local demand, runway and                      148                  58
        terminal capacity, focus on North-South
                                                                                                           62%
        and secondary São Paulo cities traffic

        Belo Horizonte
        Mid-continent hub, strong local demand                92                  42
                                                                                                           59%
        from the secondary cities in Minas
        Gerais, shorter flight times to the
        Northeast

        Recife
        Newest hub connecting all capitals in the             63                  30                       57%
        Northeast, strongest local and corporate
        demand in the region, convenient launch
        point to U.S. and Europe

         Focus cities:                           Belem is the newest North focus city
         Belem, Cuiabá, Porto                    Cuiaba serves the Midwest agro-business region where Azul is no.1
         Alegre, Curitiba                        Curitiba and Porto Alegre connect smaller secondary cities in the
                                                  South

                                                                                                                      13
Appropriately-Sized Aircraft for the Brazilian Market
With a diversified fleet configured with 70 to 174 seats, Azul is best positioned to
match capacity to demand
                                                 Passengers per Domestic Flight in Brazil
                                                                              (2018)

                  52% of flights in Brazil have
                  less than 120 passengers                                             30%
                  onboard
                                                                        24%
   % of Flights

                                                      14%                                                15%
                                     12%

                    1%                                                                                             3%
                                                                                                                             1%

                   1-29             30-59             60-89           90-119       120-149          150-179      180-209   210-240
                                                                           Passengers

                                      33 ATRs
                                      70 seats

                                                              58 E-Jets
                                                              96-136 seats

                                                                                             28 A320neo family
                                                                                             174 seats

                   Source: Azul, ANAC and companies
                                                                                                                                     14
Azul Operating Fleet Projection

                                              170
                                       165
                              160
                      151
             143                               46
                      20          32    41
              6
    123
                                                     Embraer E2
              38
     20                                              A320neo family
                      52
     7                            61                 A330
              9
                                        70           ATRs
                                               80
     33                                              E-Jets
              33      12
                                  12
                      33                12
                                  33           12
     63       57                        32
                      34                       32
                                  22
                                        10
    2018     2019    2020     2021     2022   2023

                                                                      15
A320neo: Key Driver of Future Profitability
The addition of A320neos to Azul’s fleet is further enhancing profitability in long-haul
markets
                      Cost Comparison: A320neo vs. E195
                             (Campinas–Salvador)*                                                                                                                   A320neo Highlights

         Trip cost (R$)                                                     Seat cost (R$)
                                                                                                                                                 Burns ~15% less fuel than previous
                                             +5%                                                                            -29%                  A320 model

                                                                                                                                                 Also supports further growth of
                                                                                                                                                  TudoAzul, Azul Viagens and Azul
                                                                                                                                                  Cargo
        E195          A320neo
                                                                     E195                      A320neo
                                                      Seats          118                         174

                                                                           A320neo Seat Map
                                     DE F

                                                                                                                                                                                                                   WC
                                     ABC
                               WC

                                                                                                                                                                                                                   WC
       A320neo

                                                                                                                                                          20
                                            01

                                                 02

                                                      03

                                                           04

                                                                05

                                                                      06
                                                                           07
                                                                                08
                                                                                     09
                                                                                          10

                                                                                                      11

                                                                                                                  12

                                                                                                                       13
                                                                                                                            14
                                                                                                                                 15
                                                                                                                                      16
                                                                                                                                           17
                                                                                                                                                18
                                                                                                                                                     19

                                                                                                                                                               21
                                                                                                                                                                    22
                                                                                                                                                                         23
                                                                                                                                                                              24
                                                                                                                                                                                   25
                                                                                                                                                                                        26
                                                                                                                                                                                             27
                                                                                                                                                                                                  28
                                                                                                                                                                                                       29
                                     Exit

                                                                                                           Exit
                                                                                               Exit

                                                                                                                                                                                                            Exit
  A320neo provides 56 additional seats at virtually no additional cost per flight compared to previous aircraft used in
   long-haul missions, significantly reducing cost per seat

           * Assuming 1,458-km range flight from Campinas to Salvador                                                                                                                                                   16
Azul’s Fleet Transformation
The addition of next-generation aircraft is the cornerstone of Azul’s margin
expansion strategy going forward
                   CASK Advantage                                   Trip Cost vs CASK

                         -26%          -29%                Custo x Número de assentos
                                                 50
                                                 45
                                                 40
         E195             E2         A320neo     35
       118 seats       136 seats
                                                 30
                                     174 seats
                                                 25
                                                 20
               Trip Cost Advantage
                                                 15
                                                 10
                                       +5%
                                                  5
                        -14%                      0
                                                      50     70     90     110    130    150     170

                                                            CASK (cents)         Trip cost (R$ thousand)

        E195             E2          A320neo
       118 seats       136 seats     174 seats

                                                                                                           17
Strategically Consistent Growth
Azul Route Leadership Position

                                           Only Carrier
Before                              62%
A320neos          Other 24%

                            14%
              Most frequencies

                                          Only Carrier
                                    72%
Today
                          16%
                  Other
                              12%
              Most frequencies

                                          Only Carrier
                                    70%

2019E                     18%
                  Other                                   New destinations

                             12%
              Most frequencies

                                                                             18
Appropriately-Sized Aircraft for the Brazilian Market
…allowing Azul to fly to markets which its competitors cannot serve sustainably

                                         Targeted Routes by Fleet Type

                                 ATR
                               70 seats
                      Avg. Stage Length: 422 km
                      Cost Per Trip (R$ 000): 13.9

                       Campinas–Ribeirão Preto
                        Belo Horizonte–Ipatinga
                         Recife–João Pessoa

                                E-Jets
                            106-118 seats
                      Avg. Stage Length: 793 km
                      Cost Per Trip (R$ 000): 25.8

                          Campinas–Curitiba
                        Campinas–Porto Alegre
                       Rio de Janeiro–Campinas

                               A320neo
                               174 seats
                      Avg. Stage Length: 1,487 km
                      Cost Per Trip (R$ 000): 43.2

                          Campinas–Manaus
                           Campinas–Recife
                       Belo Horizonte–Campinas

       Source: Azul                                                               19
The A320neo Effect: Strengthening the Network

                                            Campinas–Recife Growth
                                               (Replaced E-Jet with A320neo
                                                    starting Dec. 2016)

                                                                   4Q16 vs. 4Q17

                                       Number of seats/week             +56%

                                       Daily flights                    +33%

                                       Load factor                    +2.0 p.p.

                                       Local passengers                 +26%

                                       Downline revenue                 +68%

                                       Connecting passengers            +77%
                          A320neo
                                       Non-A320neo flights
                          E-Jets                                      +3.0 p.p.
                          ATRs
                                       load factor

                                                                                   20
Market Share in Corporate Market

     RPK and Corporate Revenue Share                                                        Average Corporate Ticket Price
                         (2Q19)                                                                         (Roundtrip)

                                                                               R$

                                                                                          Avianca overlap effect

                                                                                                                             +12%
             25%                                                                      +27%                  +17%
                                          33%
                                                                                                                                 831
                                                                                                797                801
                                                                                                                           745
                                                                                                          685
                                                                                    626
             34%
                                          27%

             38%                          39%

         RPK Shares              Corporate Revenue                                        Gol               Latam            Azul

               Azul         Latam          Gol                                                          1Q19        2Q19

       Source: Abracorp (Association of Brazilian corporate travel agencies)
                                                                                                                                       21
Focused International Expansion
Connecting where we are strong to where our partners are strong to maximize
passenger traffic

                                                                              22
High Quality Customer Experience
Customer-oriented culture and innovative service providing an enjoyable customer
experience
                                  New Cabin Interior
                                      (A330s)

                                                                                   23
Service-Oriented Company Culture
Highly productive workforce of passionate and friendly people who provide our
customers with the best flying experience
      Full-time employees per aircraft¹                                                             Awards

                                                                                                                                   Best Loyalty
                                                                                                                                 Program in Brazil
                                                                                                Best airline in Brazil

                                                       129
                              121
                                                                3rd Best Airline in the World

       94
                                                                                                        Best Regional Carrier in South America

                                                                   Most on-time LCC in the
                                                                         Americas

                                                                                                               Best Staff in            Fastest Check-in
                                                                                                              South America                 in Brazil

                                                                 Best Airline in South America
      Azul                 Airline 1                Airline 2

                                                                                                                         Most efficient check-in and
                                                                Ranked #1 budget airline in the world                      baggage claim in 2018
                                                                                                                         (Ministry of Transportation)

       Source: Azul, Gol and Latam’s 2Q19 earnings release
       1 Considers operating fleet                                                                                                                         24
Strong Brand Recognition
High quality product and exceptional service significantly enhance customer loyalty
and brand recognition
                                                                                                           On-Time Performance
                   Net Promoter Score
                                                                                                                  (A15*)

     64%
                     61%              61%                                                            86.5%
                                                      55%
                                                                                                                              84.1%

                                                                                                                                                        79.5%

     Netflix         Azul          Amazon           Iphone                                            Azul                   Airline 1                 Airline 3

    89% of customers would strongly recommend
     or recommend Azul to a friend or relative

                                                                               * Considers arrival within 15 minutes of scheduled time (Flightstats) - 2018

         Source: Azul NPS data and NPS benchmarks (npsbenchmarks.com) - 2018
                                                                                                                                                                   25
TudoAzul: Fastest Growing Loyalty Program
Rapidly gaining share in a growing industry

                         TudoAzul Members
                                                                                     Gross Billings
                             (millions)

                                                                                       29%

                                                                       11.4
                                                                10.8

                                                          9.0                 2017            2018

                                                    7.0                                18%
                                 +36%
                                              5.9

                                      4.5

                              3.1                                             2017            2018
                       2.2
               1.8
       1.2                                                                             2%
 0.7

 2009 2010 2011 2012 2013 2014 2015 2016 2017 2018 2Q19

                                                                              2017            2018

             Source: Azul, Smiles and Multiplus
                                                                                                      26
High Growth But Still Below Fair Share
TudoAzul has gained significant share but still has ample room to grow

                     Market Share
                                                                  TudoAzul Growth Potential
                (Gross billings ex-airline)

                                                            Market share                  Market share
                                                          airline passenger           gross billings ex-airline
                              2017
                                                           revenue (4Q18)                      (4Q18)
                                              Multiplus
                                      16%
                                              Smiles            29%
                                              TudoAzul                                       18%
                   38%

                                        46%

                                                           Voted Best Loyalty Program in Brazil
                              2018

                                       18%

                  40%
                                                                                      Voted Best
                                                                               Loyalty Program in Brazil
                                                                1st              by Melhores Destinos
                                        42%                                     in 2016, 2017 and 2018

       Source: Azul, Smiles and Multiplus
                                                                                                                  27
Azul Cargo Update
Only logistics provider in Brazil with air service to more than 100 destinations

                                                               Cargo Revenue
                                                                Net (R$ million)

                                                                      47%

 Air-service to 115+ destinations and 240+ stores
  nationwide serving 3,700 cities:
                                                            2Q18                 2Q19
     -   Franchise model based on commissions
     -   Door to door deliveries                                     Volume
     -   Smaller items with high aggregate value                   (tons, 000)

                                                                      55%
 Domestic share increase from 12% to 20%

• E-commerce segment represented 17% of 2Q19 cargo          2Q18                 2Q19
  revenue, up 10 p.p. YoY
                                                           E-Commerce Revenue Growth
                                                                  (R$ million)
 Two dedicated freighter aircraft to support increasing
  demand for palletized service
                                                                      314%

                                                            2Q18                 2Q19

                                                                                        28
Multi-Year Margin Expansion Story
Operating Margin Growth Breakdown

                                               TudoAzul          Cargo and           Macro
                        A320neo / E2
                                            Loyalty Program   ancillary revenue   Environment

                                                   % Complete

        Pre IPO                                                                                 2020

• On track to deliver IPO promise of 5-point margin expansion over three years

• Continued upside for equity story
    -    Less than 50% done on margin expansion drivers
    -    New strategic alternatives from e-commerce
    -    TAP investment upside
    -    Remaining potential from Brazil macro

                                                                                                       29
2Q19 Highlights

        ASK                                   EBITDA                                    Operating Margin                         Net Income
       (million)                             (R$ million)                                                                        (R$ million)

       +16%                                        40%
                                                                                                      13.0%
                                                         733                               10.0%                                         345
             8,156
   7,062                                     522

                                                                                                                                 -791
   2Q18      2Q19                           2Q18       2Q19                                2Q18        2Q19                      2Q18   2Q19

 Revenue of R$2.6 billion, up 31.3% YoY

 13.6% RASK increase YoY; up 15.1% stage-length adjusted

 Operating income of R$340 million, up 70% YoY
   -       Fuel price per liter increase of 18.6%
   -       Brazilian real devaluation of 8.7%
   -       R$31 million net impact from payroll tax

 Net income of R$345 million

             * All figures in IFRS16 accounting standard. Excludes non-recurrent items related to the sale of 6 e-Jets in 2Q18                  30
2Q19 vs. 2Q18 Operating Margin
 Margin expansion year over year:
      -      Fuel, currency and net payroll tax impact accounted for 7.2 point reduction in margin
      -      Recovery of 11.6 points from higher revenue, margin expansion and favorable competitive
             dynamics

R$ million

                                                                                                                                   ~11.6 margin
                                                                                                                                      points
                                                                                                                                                        13.0%
                                                 ~7.2 margin points

             10.0%

                                                                                                                                         304
                                                                                                                                                         340
                                             133
             200

                                                                              53
                                                                                                             22

     EBIT Adj. 2Q18*                     Fuel & FX                      Payroll tax            Payroll tax revenue relief         Revenue recapture    EBIT 2Q19
                                                                      salaries impact                                             & Margin Expansion

                   * All figures in IFRS16 accounting standard. Excludes non-recurring items related to the sale of 6 E-Jets in 2Q18                               31
2Q19 EBITDA Margin (IFRS 16) –Azul vs. Peers
  28.0%

                    25.9%

                                           23.9%                  23.7%

                                                                                        19.7%

                                                                                                               17.9%
                                                                                                                                    16.5%
                                                                                                                                              15.1%

  2Q19              2Q19                   2Q19                   2Q19                   2Q19                   2Q19                2Q19       2Q19

                                                                                                                                            Global Legacy
                                                                                                                                               Airlines*

          Source: Company public filings
          * Global Legacy Airlines calculated as average EBITDAR margin of American Airlines, United Airlines and Delta Air Lines                           32
Strong Liquidity Position
Azul maintained a strong cash position while protecting all of its non-aircraft debt foreign currency
exposure

                         Cash Balance                                                                         Total Debt ²
                            (R$ million)                                                                       (R$ billion)

                                                           42% of TTM                    Capitalized Leases
      Accounts receivables                                   revenue
      Cash¹                                                                              Loans and Financing

                                                                                                                              12.1
                                              4,212                                                                                  Net addition
                                                                                                   10.9
              3,841                                                                                                                  of 10 aircraft

                                              1,405
              1,176
                                                                                                                              9.3
                                                                                                    8.3

              2,666                           2,807

                                                                                                    2.6                       2.8

              2Q18                            2Q19                                                 2Q18                       2Q19

                                                                                                  3.3x                        3.1x

                                                                                                    Leverage (Net Debt / EBITDA)

          1   Includes cash and cash equivalents, short-term and long-term investments
          2   Adjusted for currency hedges
                                                                                                                                                  33
Free Cash Flow Generation

                                    Free Cash Flow
                                      (R$ million)

         1,039

                             224
                                          815

                                                         428

                                                                     387

Cash flow from operations   CAPEX         FCF        Rent Payment   Adj FCF

                                                                              34
2Q19 Liquidity –Azul vs. Peers

              Cash + Receivables                                                                   Leverage
                 (% of LTM revenue)                                                        (Adjusted Net Debt / EBITDA)

  42%

                                                                                                                              5.3
         34%           34%

                                                                                                            4.4      4.5

                                    26%
                                                  22%                                              3.4
                                                                                           3.1

                                                               11%
                                                                                    1.4

  Azul   Copa        Volaris        Gol          Latam       Avianca               Copa   Azul     Gol    Volaris   Latam   Avianca
  2Q19   2Q19        2Q19          2Q19*         2Q19         2Q19                 2Q19   2Q19    2Q19*   2Q19      2Q19     2Q19

                                                                                  23.7%   28.0%   25.9%    23.9%    16.5%     4.6%

                                                                                                  EBITDA Margin

         Source: Company public filings
         Cash includes cash, cash equivalents, short- and long-term investments
         * Excludes cash from minority shareholders
                                                                                                                                      35
Strong Liquidity and Debt Profile
                                 Debt Profile                                                                      Average Cost of Debt

R$ Million
              Total Debt                              Working Capital Debt
                                                                                                                        U.S. Dollar           Real
                 664
                   2,168                                                   691

                                                           1,315                               Lease Liabilities              8.2%             -
         9,282                                                             162

      Aircraft leases                                      Senior notes
                                                                                               Other Loans                    5.8%            6.8%
      Other aircraft liabilities                           Debentures
      Loans and financing                                  Others

                                                                               Debt Maturity Profile

R$ Million              Liquidity          BRL          USD             Senior Notes

    4,212

                                                                                                                                      1,417
                                                                                                                                       103

                                                                        419             462                                           1,315
                                                                                                        267            190
                         56                    18                        394           438
                                                                                                          247
                        7 49                  6 12                        25            24             20             12 178                            3
  Liquidity             3Q19                  4Q19                      2020           2021             2022           2023           2024         After 2024
                Note: Considers the effect of currency hedges on debt                                                                                           36
Limited Foreign Exchange Exposure

                                Successful Issuance of Unsecured Bond

  US$ 400 million unsecured bond

  Swapped to 99% of risk-free rate with cap at 4.75 BRL/USD

 Corp. Ratings                  Ba3 by Moody’s (BB-) / B+ by S&P / BB- by Fitch

 Issue Ratings                  B1 by Moody’s (B+) / B+ by S&P

 Size                           US$400 million

 Maturity                       October 2024

 Issuance                       October 2017

 Yield                          6.000%

 Coupon                         5.875%

                                                                                  37
Foreign Currency and Fuel Hedge Policy
Three lines of defense:                                       Oil and Foreign Currency Correlation
                                                                             (WTI and R$/US$)
                                                0.9
• Strong negative correlation between
  oil and Brazilian real                        0.6

                                                0.3
• Fuel and FX hedge policy
   -   Up to 50% of next quarter’s              0.0
       consumption, then 35%, 25% and                  Jan-08 Jul-09 Jan-11 Jul-12 Jan-14 Jul-15 Jan-17 Jul-18 Jan-20
       15% for next quarters
                                                -0.3
   -   Protect up to 100% of next twelve
       months’ financial cash flow in foreign
       currency                                 -0.6

                                                -0.9
• High revenue recapture
   -   Alone in 72% of markets                  -1.2
   -   Active revenue management strategy

                                                                                                                        38
Azul Unique Assets
Besides higher margins and a stronger balance sheet, Azul also has valuable
assets not found in other airlines

  R$ million
                                                          Convertible bond
                                                           (up to 47% of
                                                            TAP equity
                                                              value)
                                      Pre-paid
                                     maintenance
                                      expenses
                                                                1,332

                 100% owned
               loyalty program
                                         1,478

                  TudoAzul       Security Deposits and       TAP Bond
                                 Maintenance Reserves

                                                                              39
TAP Investment
TAP’s convertible bond and network connectivity to further boost Azul’s results

                                                                                           TAP Investment

   Leader in traffic between Brazil and Europe (26%)                 € 90M strategic investment in TAP bonds convertible
                                                                       into up to 41.25% of economic interest
   Fleet of 93 aircraft
                                                                      2025 maturity with 7.5% annual interest
   Service to 10 cities in Brazil
                                                                      Secured by TAP’s frequent flyer program Victoria
   C-level suite formed by former Azul executives
                                                                      Acquired 6.1% economic stake in TAP for US$ 25M

                                                                                  TAP Economic Interest After
        ASK                   Revenues                  EBIT                          Bond Conversion
       (billion)              (€ million)             (€ million)
                                                                               Parpública
       +13%                       +10%
                                                                              & Employees
                                                 93
                   47                    3,245                                              21%
 42                     2,960
                                                               66
                                                                                                            47% Azul

                                                                                           32%
                                                                                Atlantic
                                                                       Gateway (ex-Azul)

2017           2018        2017          2018    2017         2018

                                                                                                                          40
Successful Conclusion of Azul’s IPO and Follow On
Azul to further strengthen its balance sheet with its IPO proceeds

                                                                        Azul IPO Summary

   IPO total offer of R$2,021 million (US$644 million):
     ‒ R$1,288 million (US$406 million) of net proceeds to Azul
     ‒ R$21 per preferred share, US$20.06 per ADS*
   Follow On total offer of R$ 1,250M (US$400 million)
     ‒ Significant increase in daily liquidity
   HNA Follow On total offer of US$313 million
     ‒ US$ 16.15 per ADS*

                                                                                                                Preferred
As of June 30th, 2019                                                  Common                  Preferred                         Economic Interest
                                                                                                               Equivalent**

David Neeleman                                                            622,406,638             11,432,352        19,731,107               5.8%

Trip former shareholders                                                  306,558,420             18,231,040        22,318,486               6.5%

United Airlines, Inc. (Calfinco)                                                                  26,995,316        26,995,316               7.9%

Others                                                                                           272,023,694      272,023,694               79.7%

Treasury                                                                                             432,981          432,981                0.1%

Total                                                                     928,965,058            329,115,383      341,501,584              100.0%

             *Each ADS corresponds to three preferred shares
             **Assuming the conversion of common shares to preferred shares at a 75:1 ration                                                         41
Environmental, Social andGovernance (“ESG”) Responsibility
Aviation is a key driver of sustainable development, bringing together people,
businesses and communities
           Environmental                                               1H19      1H18      %∆
                                         GHG (Kg of CO2, million)     1,779.8   1,592.4   11.8%
                   Total fuel consumed per ASK (kg / ASK, million)     34.3      35.5     -3.4%

                                    Average age of operating fleet      5.9       5.8     2.0%

            Governance
                                        Independent directors (%)      81.8       83.3    -1.8%
                         Percent of board members that are women        9.1       8.3     9.1%
                                             Director average age      49.6       43.2    14.8%
                                  Director meeting attendance (%)       85        95      -10.5%
                                                        Board size      11.0      12.0    -8.3%
                 Participation of woman in leadership positions (%)    39.4       39.8    -1.1%

              Social
                                        Employee gender: (%) male        57        57      0.0%
                                                      (%) female         43        43      0.0%

                                    Employee monthly turnover (%)       1.06      0.80    32.5%
                                          Employees unionized (%)       100.0    100.0     0.0%
                                                         Volunteers     2,034    1,553    31.0%

                                                                                                   42
2019 Outlook

                    Announced        New

ASK growth          18% to 20%    20% to 22%

    Domestic        16% to 18%    23% to 25%

    International   20% to 25%    10% to 15%

CASK                 -1% to -3%    0% to 2%

Operating Margin    18% to 20%    18% to 20%

                                               43
Investor Relations
   +55 11 4831 2880
invest@voeazul.com.br

                        44
You can also read