Investor Presentation - 8 December 2018 - ESR-REIT
←
→
Page content transcription
If your browser does not render page correctly, please read the page content below
Investor Presentation
8 December 2018
Contents

A    Overview of ESR-REIT

B    Industrial Sector Outlook

C    ESR-REIT Growth Strategy

D   Key Financials Snapshot

E   Why ESR-REIT

F   Appendix

                                 2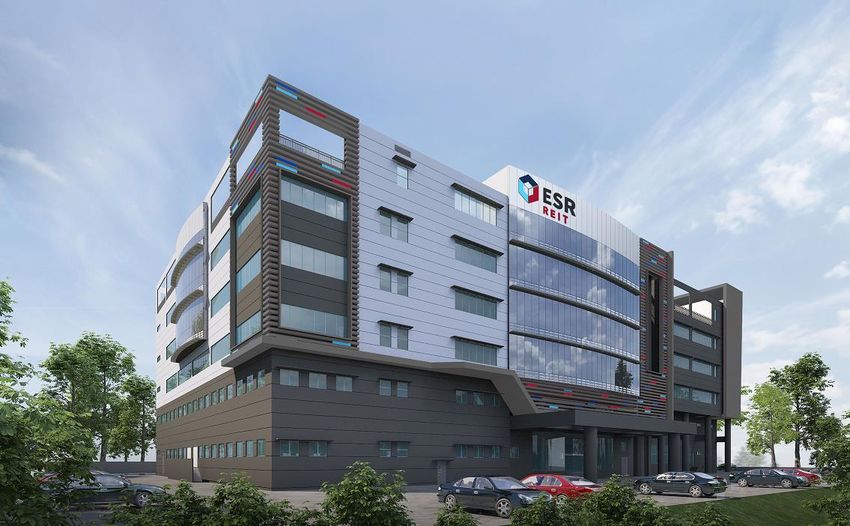
Overview of
ESR-REIT
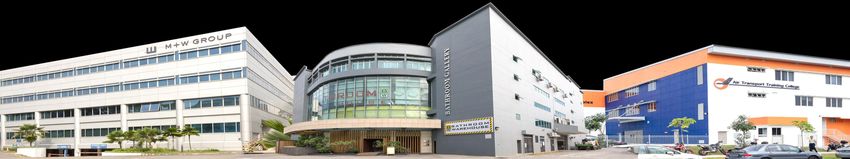
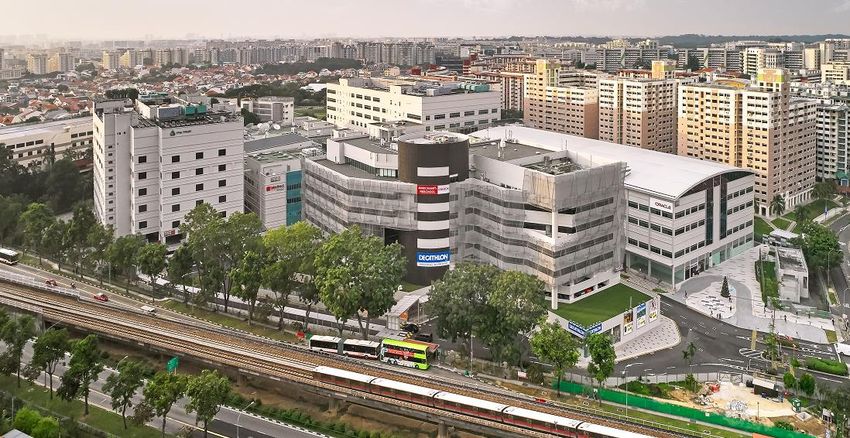
Top: 7000 Ang Mo Kio Avenue 5
Bottom: 750-750E Chai Chee Road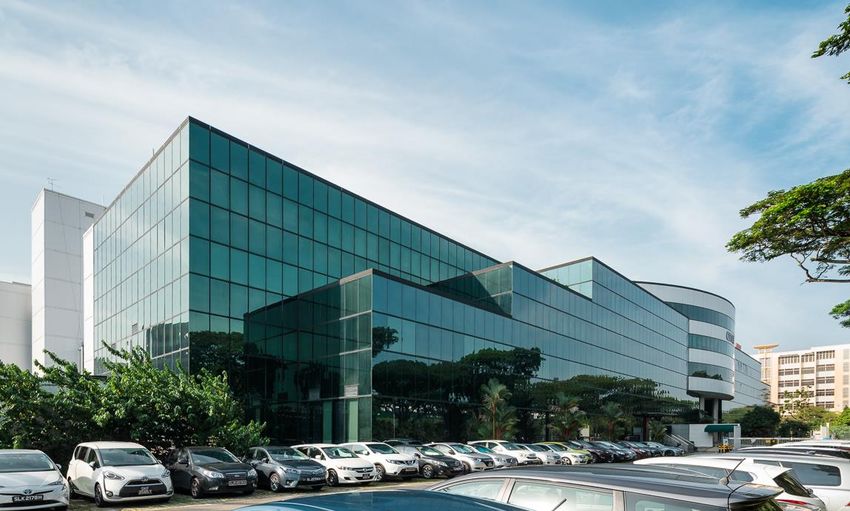
Overview of ESR-REIT
Listed on the SGX-ST, Backed By Strong Developer-Sponsor ESR

 ▪   Listed on the SGX-ST since 25 July 2006 (formerly known as Cambridge Industrial Trust)
 ▪   Current market capitalization of S$1.57bn(1)
 ▪   Total assets of S$3.1 billion(3) with 57(2) quality income-producing industrial properties across 5 sub-sectors

                                                                                                                                                                                        Located close to major
                                                                                                                                    c.350 tenants                                      transportation hubs and
 Diversified portfolio of                                                         Portfolio
                                                                                                                                      From different                                     key industrial zones
                                                                                occupancy of
                                                                                                                                      trade sectors

          57     (2)
                                                                                  >90%
     properties across                 Total GFA of                               Above JTC
                                                                                                                                                           Total assets of
        Singapore                     approximately                                Average
                                       14.1m sqft(2)                              of 89.1%(4)                                                                    S$3.1 billion(3)

     General Industrial                         Light Industrial                          Logistics/ Warehouse                             Hi-Specs Industrial                                Business Park

                  Notes:
                  (1) As at 30 Nov 2018. (2) This is the enlarged portfolio after the merger of ESR-REIT and Viva Industrial Trust (where Viva Industrial Trust is currently a sub-trust under ESR-REIT. The name has been
                      amended to Viva Trust (“VT”)). It also includes 15 Greenwich Drive which was acquired on 25 Oct 2018. (3) As at 30 Sep 2018, includes VT assets (total assets of S$1.32bn as at 30 Jun 2018) and the   4
                      c.S$95.8m acquisition of 15 Greenwich Drive completed on 25 Oct 2018. (4) Based on 3Q2018 data from JTC.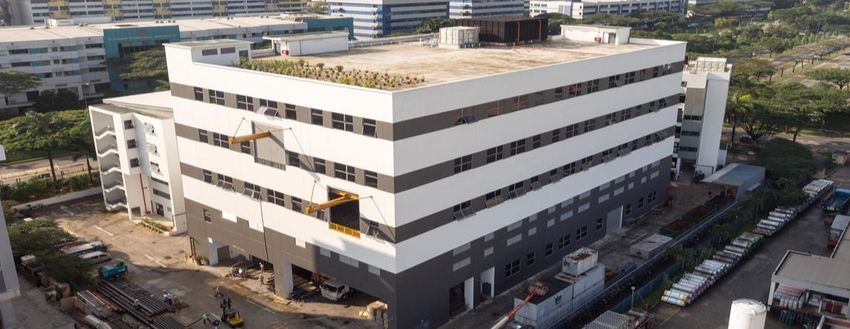
Strategically Located Portfolio of Assets
57(1) assets located in key industrial zones across Singapore and close to major transportation hubs

                                                                                          Woodlands/
                                                       6 Chin Bee Avenue
                                                                                         Kranji/Yishun
                                                                                                                                11 Lorong 3 Toa Payoh
                                                                                                                                                           7000 Ang Mo Kio Ave 5

                                                                                                                                                                                   15 Greenwich Drive

                                     30 Pioneer Road
                                                                                                         Ang Mo Kio /                                   29 Tai Seng Street

                                                                                                       Serangoon North

                                                                                      International                                                                                            19 Tai Seng Ave
                                                  Jurong / Tuas
                                                                                        Business
                                                                                          Park
                                                                                                                                              Tai Seng / Ubi
        81 Tuas Bay Drive

                                                                                                          Alexandra /                                                                      2, 4, 6 & 8 Changi
                                                                                                          Bukit Merah                                                                        Business Park

                                                                                                                                                                            Changi
                                                                                                                                                                         Business Park

                                                                                                                                                                                  750-750E Chai Chee Road
                                                                                                                                            11 Ubi Road 1

                                    Tuas Mega Port                                                                       Business Park            High Specs Industrial              General Industrial
                                                                                             Major Industrial Cluster    Light Industrial         Logistics and Warehouse             Major Highways

                            Note:
                            (1) Includes VT assets and 15 Greenwich Drive which was acquired on 25 Oct 2018.
                                                                                                                                                                                                                 5
Current Ownership Structure
ESR has 67.3% stake in the REIT Manager, 100% stake in the Property Manager and is the REIT’s second largest unitholder with
a c.9.3% REIT stake

                                                                                            ESR(1)

                                                                                                  100%

                                                                                    ESR Investment                         Mr. Tong               Mitsui & Co.
                                                                                   Management Pte Ltd                      Jinquan(1)                 Ltd

                                                                                     100%         67.3%                          25.0%                   7.7%

                                                            ESR Property Management                        ESR Funds Management (S)
                                                             (S) Pte. Ltd. (“ESR-PM”)                         Limited (“ESR-FM”)
                                                               (Property Manager)                               (REIT Manager)

                                                            Property            Property             Management        Management
                                                         management             management              services       and other
                                                            services            and other                              fees
                                         Acts on                                fees
                                         behalf of
               RBC Investor             Unitholders
               Services Trust                                                                   ESR-REIT
             Singapore Limited                                                                                                           c.9.3%
                 (Trustee)             Trustee fees

                                                                                                 Assets

              Note:
              (1) Includes direct interests and/or deemed interests through holding entities.
                                                                                                                                                                 6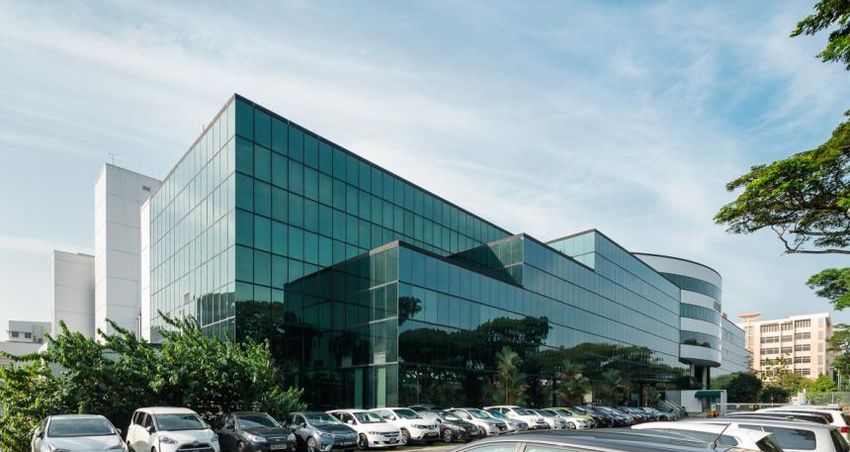
ESR-REIT is Currently the 4 th Largest Industrial S-REIT
Total Asset Size (S$bn)(1)

                           Developer-backed S-REITs

    11.3    (2)

                      7.9     (3)

                                                  4.3

                                                                             3.1      (4)                3.1     (5)

                                                                                                                                     1.5                         1.5                         1.3                         1.2                         0.9

   A-REIT            MLT                          MIT                                                    FLT                    ECWREIT                      AA-REIT                         CLT                     Soilbuild                   Sabana

                  Source: Latest company filings. Notes: (1) As at 30 Sep 2018, adjusted for acquisitions and divestments completed before 30 Nov 2018. (2) Includes the c.S$451.7m portfolio acquisition of 26 logistics properties located in the UK completed
                  on 4 Oct 2018. (3) Includes the c.S$102.2m acquisition of Coles Distribution Centre completed on 28 Nov 2018, the c.S$46.4m acquisition of Wonjin Logistics Centre completed on 29 Nov 2018 and the c.S$22.4m divestment of 531 Bukit
                  Batok Street 23 completed on 18 Oct 2018. (4) As at 30 Sep 2018, includes VT assets (total assets of S$1.32bn as at 30 Jun 2018) and the c.S$95.8m acquisition of 15 Greenwich Drive completed on 25 Oct 2018. (5) Assumes exchange              7
                  rate based on AUD:SGD of 0.986:1.000 as at 30 Sep 2018. Includes the c.S$39.9m acquisition of a logistics property located in the Netherlands completed on 31 Oct 2018.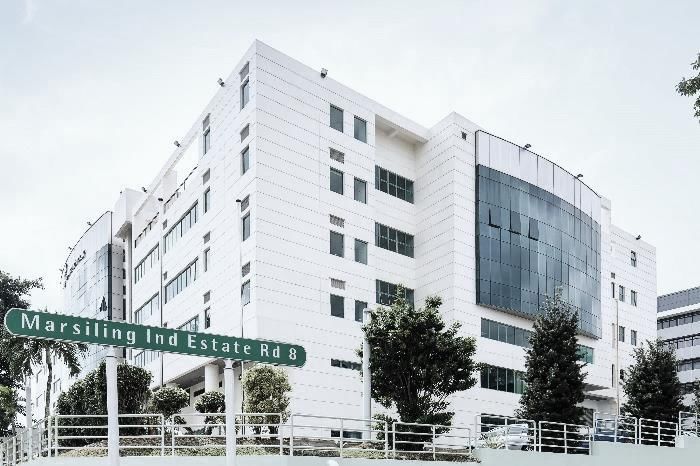
Attractive Distribution Yield with Potential Upside

       Attractive Distribution Yield…                                                                           …With Potential Upside From…
       8%                    (1)
                      7.5%
                                                                                                                            Operational Synergies

                                                                                                                1
       7%
                                                                                                                            and Economies of Scale
                                                                                                                            via Integration of
       6%                                     5.6%                                                                          Enlarged Portfolio
                                                                     c.500
       5%                                                              bps
                                                                    spread

                                                                                                                2
       4%
                                                                                                                            Flexibility to Accelerate
                                                                                                                            AEI to Optimize Value
       3%                                                             2.6%

       2%

       1%

       0%
                Ann. 3Q18 YTD FTSE ST REIT 12M
                  Dist. Yield       Yield
                                                                Singapore Govt
                                                                   10Y Bond
                                                                                                                3           Value-Enhancing Asset
                                                                                                                            Acquisitions

            Note:
            (1) Based on closing price of S$0.51 on 30 Sep 2018 and annualised 3Q2018 YTD DPU of 3.80 cents .
                                                                                                                                                        8
Industrial Sector
         Outlook

Top: 7000 Ang Mo Kio Avenue 5

Bottom: 750-750E Chai Chee Road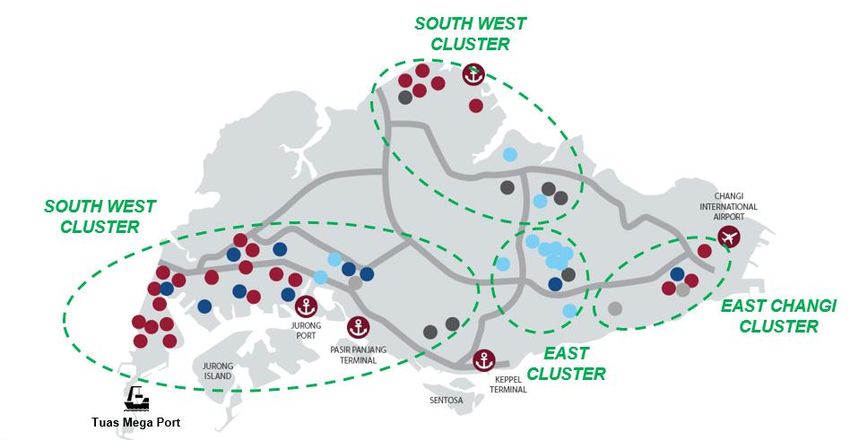
Limited Future Pipeline Supply
                                                                           All Industrial Property(1)
▪   The moderating level of supply in 2018 will enable
    the market to absorb the significant amount of                         25.0
                                                                                                                                                                      Forecast
    space from the past 6 years, said CBRE                                 20.0
                                                                                                     10y Average Supply
                                                                                                         c.15.0m p.a
    ‒ Leasing market is expected to remain competitive                     15.0

                                                                           10.0
▪   Over next 3 years, average business park annual                                                                        10y Average Demand
                                                                            5.0                                                c.12.3m p.a
    pipeline supply will be at a historical low and this
    should help support overall occupancy                                   0.0
                                                                                   2008   2009    2010     2011     2012    2013     2014    2015    2016    2017    2018F 2019F 2020F
    ‒ Prospects largely stemming from a strong office                                                                                                               Potential Average Supply
      rental recovery                                                                     Factory Supply          Warehouse Supply          Business Park Supply          c.10.0m p.a

                                                                           Business Parks(1)
▪   Increased institutional interest in acquisition of
    industrial spaces in 1H2018, especially for data                         2.5                                                                                    Forecast

    centre, high-specs facilities and modern ramp-up                         2.0                                  10y Average Supply
                                                                                                                                                                        Gap between
    logistics buildings                                                                                               c.1.3m p.a
                                                                                                                                                                        Demand and
                                                                             1.5                                                                                         Supply of
    ‒ Colliers predicts capital values of prime industrial                                                                                                             Business Parks
      spaces with freehold or long lease tenures will                        1.0
                                                                                                 10y Average Demand
      continue to rise in light of rising demand amongst                     0.5                      c.1.1m p.a
      limited supply
                                                                             0.0
                                                                                   2008   2009    2010     2011     2012    2013   2014     2015    2016    2017    2018F 2019F 2020F
                                                                                          Business Park Supply                                                 Potential Average Supply
                                                                                                                                                                      c.0.6m p.a
                 Note: Source: ETC,CBRE, Colliers and JTC
                 (1) Based on 2Q2018 data from Knight Frank Consultancy.
                                                                                                                                                                                      10
Market Outlook Stabilising with Rents Remaining Flat
▪ Industrial market is showing signs of stabilisation Average Industrial Rents (S$ / sq ft / month)(1)
‒ Monthly rents in all market segments remaining
flat q-o-q 4.50
4.08
4.00
▪ In Q3, leasing enquires driven mostly by medical
technology and petrochemical sectors
3.50
‒ Occupier activity includes expansion of existing
premises as well as takeup for new business set-ups 3.15
3.00
▪ Over next three years, volume of new industrial supply 2.50
seems stable
2.00
‒ CBRE expects industrial rents to hold steady for the
1.57
rest of 2018 with potential for growth in 2019
1.50 1.58
‒ Future market performance will depend on the 1.20
adoption of automated technologies and how it affects 1.00 1.23
spatial requirements of end-users
0.50
1Q13 1Q14 1Q15 1Q16 1Q17 1Q18
Business Park High-Specs Factory (Ground Floor)
Warehouse (Ground Floor) Factory (Upper Floor) Warehouse (Upper Floor)
Note: Source: ETC, CBRE, Colliers and JTC
(1) Based on 3Q2018 data from CBRE, JTC.
11Sub-Sectors Demand and Supply
▪ Supported by the Government, more advanced All Industrial New Supply, Demand and Occupancy Rate(1)
manufacturing industries may contribute towards
(In ‘000 sq ft) (%)
demand for space
8,000 90.5%
‒ Greater incentive from Government for firms to
innovate as part of national Industry 4.0 plans to
7,000
improve industrial market value chain 90.0%
6,000
▪ Change in business models of industrials may shift 89.5%
demand towards high-tech developments and 5,000
business parks
4,000 89.0%
‒ ESR-REIT is well-diversified with majority of
portfolio made up of Business Park/High-Specs
3,000 88.5%
properties; poised to benefit from limited supply
‒ Logistics/ Cargo Lift Warehouses and factory 2,000
space to remain subdued going into 2019 88.0%
1,000
87.5%
0
4Q2017
1Q2016
2Q2016
3Q2016
4Q2016
1Q2017
2Q2017
3Q2017
1Q2018
2Q2018
-1,000 87.0%
Net New Supply Net New Demand Occupancy Rate
Note: Source: ETC,CBRE, Colliers and JTC
(1) Based on 1H2018 data from Colliers International Singapore Research, JTC.
12Industry 4.0 Initiative
▪ Industry 4.0: a new trend of automation and data exchange in manufacturing technologies
‒ Sees end-users embracing technologies such as big data and data analytics, augmented reality and additive manufacturing
▪ Singapore Government’s focus is on moving towards higher value-added manufacturing activities since 2016
▪ Infrastructure needs to keep up with trends and technologies, space owners need to continue innovating for “Factories of
the future”
Industry 1.0 Industry 2.0 Industry 3.0 Industry 4.0
Introduction of Mass production fuels Use of electronics and Adoption of cyber
mechanical production the second industrial IT systems to automate physical systems and
facilities facilitated by revolution with the help the production process technology such as
water and steam power of electrical power data analytics, 3D
printing
13Industry 4.0 Initiative
ESR-REIT Tenant Case Study: Meiban Group
✓ ESR-REIT’s portfolio is well-aligned with government initiatives and
push towards high-specs sector
✓ Recent AEIs like 30 Marsiling Ind Est Road 8 are aimed at attracting
tenants from high-value added manufacturing trade sectors
Tenant Case Study: Meiban Group
✓ Meiban is a company focused on industrial design, tooling design and
fabrication,precision molding and contract manufacturing
✓ Launched the Meiban Innovation Center in October 2016
‒ Minister for Trade and Industry Mr. S Iswaran launched the Precision
Engineering Transformation Map at the Meiban Innovation Center
✓ First to digitise factory operations through its iSmart Factory Project
‒ Factory of the future based on Industry 4.0 technologies and principles
‒ Development of Smart Technology like Robotics to support various aspects of
its operations
14ESR-REIT
Growth Strategy
Top: 7000 Ang Mo Kio Avenue 5
Bottom: 750-750E Chai Chee RoadOur Long-Term Strategy to Optimise Returns
Our three-pronged strategy focuses on optimising Unitholder returns while mitigating risks
Organic Growth
Acquisition
Capital and Development
Management Growth
Acquisition and
Organic Growth Capital Management
Development Growth
▪ AEIs to unlock value and ▪ Yield-Accretive, scalable and ▪ Long-term Debt to Total
attract high-valued tenants value-enhancing acquisition Assets of between 30 to ±40%
▪ Pro-active asset opportunities in Singapore ▪ 100% unencumbered portfolio
management to optimise ▪ Potential pipeline of assets ▪ Well-staggered debt maturity
returns for investors from ESR profile
▪ Divest non-core assets and ▪ Exploring opportunities to ▪ Diversify funding sources into
redeploy capital to higher participate in development alternative pools of capital
value-adding properties projects, either individually
or in JV with ESR ▪ Broaden and strengthen
▪ Enhance tenant base by banking relationships
leveraging Sponsor
networks
16Organic
Growth
Top: 7000 Ang Mo Kio Avenue 5
Bottom: 750-750E Chai Chee RoadOrganic Growth Strategies
1 Leveraging on Real Estate Supply and Demand Trends
▪ Favourable demand-supply dynamics, especially Business Park and High-Specs
sector
▪ In Business Park/ High-Specs sectors with potential to achieve higher rentals
▪ Optimal STB/MTB ratio creates flexibility to ride on real estate cycle uptrends
▪ Active lease management to secure value-added “tenants of tomorrow”
2 Operational Synergies and Economies of 3 AEIs to Unlock Value
Scale via Integration of Enlarged Portfolio ▪ Up to 7 properties identified for AEI
▪ Wider product suite for tenants and over next 3 years
leasing ▪ c.1m sq ft of unutilised plot ratio
▪ Clustering and moving towards self- identified
management of properties
▪ Bulk tendering of property services
181A Favourable Demand-Supply Dynamics
▪ Industrial market supply outlook over the next 3 years forecasted to be much lower than the 10-year average supply and
demand
▪ In particular, Business Park sector’s potential supply (c.0.6m p.a over the next 3 years) is half of the 10-year average supply
(c.1.3m p.a) and demand (c.1.1m p.a)
‒ Business Park/High-Specs sector constitutes c.45% of ESR-REIT’s portfolio
Historical and Future Pipeline – All Industrial Property (Net Floor Area m sqft)(1)
25.0
10y Average Supply Forecast
20.0 c.15.0m p.a
15.0
10.0
10y Average Demand
5.0
c.12.3m p.a
0.0
2008 2009 2010 2011 2012 2013 2014 2015 2016 2017 2018F 2019F 2020F
Factory Supply Warehouse Supply Business Park Supply Potential Average Supply
c.10.0 m p.a
Historical and Future Pipeline – Business Parks (Net Floor Area m sqft)(1)
2.5 Forecast
10y Average Supply
2.0 c.1.3m p.a
Gap between Demand and Supply of
1.5 Business Parks
1.0
0.5 10y Average Demand
c.1.1m p.a
0.0
2008 2009 2010 2011 2012 2013 2014 2015 2016 2017 2018F 2019F 2020F
Business Park Supply Potential Average Supply
c.0.6m p.a
Note:
(1) Based on 2Q2018 data from Knight Frank Consultancy.
191B In Sub-Sectors with Potential to Achieve Higher Rentals
▪ c.45% of properties in Business Parks/High-Specs Sector which has higher average rents
‒ Favourable demand-supply dynamics amplify potential to achieve higher rentals
▪ Provides additional flexibility to conduct AEIs on ESR-REIT’s existing identified assets
‒ Targeting higher-paying industrialists requiring high-specs space requirements
Average Industrial Rents (S$ / sq ft / month)(1) Asset Class Breakdown by Valuation(2)
4.50
Business Park / Business Park /
4.00 4.08 High-Specs c.44.9% High-Specs
Average Monthly Rents
3.50
S$3.80 – S$5.80 psf
3.00
3.15
30.3%
2.50
14.6%
Logistics(3)
2.00
Average Monthly Rents
S$1.20 – S$1.58 psf
1.50
1.57 18.9%
1.58 20.6%
1.00
1.20 Light and General
1.23 15.7%
Industrial(3)
0.50
1Q13 4Q14 3Q16 2Q18 Average Monthly Rents
Business Park High-Specs Factory S$1.23 – S$1.57 psf
(Ground Floor)
High-Specs Industrial Business Park Logistics
Warehouse Factory Warehouse
(Ground Floor) (Upper Floor) (Upper Floor) General Industrial
Light Industrial
Notes: (1) Based on 3Q2018 data from CBRE and JTC. (2) Based on the portfolio valuation of ESR-REIT and VT as at 31 Mar 2018 and 15 Greenwich Drive as at 9 Apr 2018.(3) Logistics based on
“Warehouse (Ground Floor)” and “Warehouse (Upper Floor)”, while Light and General Industrial is based on “Factory (Ground Floor)” and “Factory (Upper Floor)” as defined by JTC.
201B ESR-REIT Business Parks Poised to Ride on Potential Upside
▪ Rents for Rest of Island submarket grew 1.3% q-o-q in 3Q2018(1)
‒ ESR-REIT Business Park rents are well-positioned to ride on potential demand and rental upside
Asking Rents Across Key Business Parks in Singapore (S$ / sq ft / month)(2)
1 Cleantech Park
2 International Business Park
S$5.00
3 One North
4 Science Park
2,4,6,8 Changi Business Park
1 S$2.77 – S$3.81
S$3.00 – S$5.50
2 S$3.50 – S$4.40
Business
Parks –
3 S$5.00 – S$6.50 East Region
4 S$3.90 – S$6.80
750 – 750E Chai Chee Road
S$3.00 – S$3.70
Note:
(1) Based on 3Q2018 data from CBRE.
(2) Based on CBRE Singapore Industrial & Logistics Asking Rental Guide, Sep 2018. 211C Higher Proportion of MTB vs STB Provides Flexibility
Near Optimal Proportion of MTB vs STB(1) (by Rental Income)
▪ ESR-REIT has embarked on a STB to MTB conversion
strategy since 2012, which is near completion
32.6%
67.4%
▪ Currently, the portfolio’s near optimal proportion of
MTB vs STB provides flexibility to capture rental
upside in an increasingly stabilised market
Multi-Tenanted Single-Tenanted
WALE by Rental Income
As at 31 Dec 2012 As at 30 Sep 2018
30.0% 30.0%
25.0% 11.1%
25.0% 7.3%
20.0% 20.0%
1.1% 14.4%
15.0% 0.8% 15.0%
4.4%
2.5% 0.9% 17.9%
10.0% 21.9% 10.0% 20.4%
16.5% 10.4%
10.8% 13.3% 5.0% 9.7% 4.7%
5.0% 11.0%
9.5%
3.6% 2.3% 3.3% 2.2%
0.0% 0.0%
2013 2014 2015 2016 2017 2018+ 2018 2019 2020 2021 2022 2023+
Single-Tenanted Multi-Tenanted
Note:
(1) As at 31 Mar 2018, From Circular dated 7 Aug 2018.
221D Active Leasing Strategy to Attract Value-Added Tenants
▪ In 3Q2018, ESR-REIT secured 2 new master leases
▪ Keito Engineering & Construction (21B Senoko Loop)
‒ Provider of integrated manpower, logistics, and accommodation needs for the building and construction industry
▪ Virogreen (31 Tuas Avenue 11)
‒ Specialises in certified E-Waste recycling, computer recycling, data destruction services
21B Senoko Loop 31 Tuas Avenue 11
Gross Floor Area 195,823 square feet Gross Floor Area 75,579 square feet
Asset Class General Industrial Asset Class General Industrial(1)
Keito Engineering & Construction Tenant Virogreen (Singapore) Pte Ltd
Tenant
Pte. Ltd.
Lease Term 3 years (commencing Oct 2018) Lease Term 5 years (commencing Sep 2018)
Valuation(2) S$26.5 million Valuation(2) S$12.2 million
Note:
(1) Property has been reclassified from Logistics & Warehouse to General Industrial.
(2) As at 31 Mar 2018. 232 Operational Synergies and Economies of Scale
A Clustering of Property Management Services B Bulk Tender Contracts for Property Services
▪ Clustering of assets by region for better on-site ▪ Larger portfolio creates economies of scale
management
▪ Stronger bargaining power with service providers
▪ Move towards self-management of properties
▪ Third-party Integrated Facility Management contracts at ▪ Bulk tender contracts for property services to reduce
selected properties will not be renewed operational maintenance cost
Examples of Bulk Contracts
Cleaning Security Landscaping
✓ Cost savings from direct self-management model
✓ On-site clusters encourage faster response time and better service quality to tenants
243 Flexibility to Optimize Assets Through AEIs
Up to 7 ESR-REIT assets have been identified for AEIs over the next 3 years
‒ Includes c.1 million(1) sq ft of unutilized plot ratio
Maximise Plot Ratio General Industrial High-Specs
A Unlocking Value in Unutilized Plot Ratio B Rejuvenation of Assets
Upgrading and Change of building Redevelopment and
improvement of use to align with amalgamation of
building specifications current market trends adjacent sites to enjoy
economies of scale
30 Marsiling Industrial Estate Road 8
7000 Ang Mo Kio Avenue 5 3 Tuas South Avenue 4 • AEI works currently c.80% complete
c.495,000 sq ft untapped c.500,000 sq ft untapped • Upgrading of the asset to a High-Specs
GFA GFA industrial building
• Estimated completion 1Q2019
•
Unlocking of further value from ESR-REIT’s existing assets to deliver returns
Note:
(1) With reference to untapped GFA at 7000 Ang Mo Kio Avenue 5 and 3 Tuas South Avenue 4 properties.
253 AEI: 30 Marsiling Industrial Estate Road 8
After
✓ AEI facilitates conversion of asset from a General Industrial to a
High-Specs Industrial property
✓ Addition of two good quality tenants(1) from high-value added
manufacturing sectors
High-Specs
Industrial
Artist Impression
✓ Asset and Portfolio Stability
+AEI ‒ Secured long leases with two major tenants
General
Before ‒ Following project completion, property will be 100% occupied for
Industrial
the next five years
Valuation(2) S$36.6 million
Estimated Cost c.S$12.0 m
Estimated Project Completion 1Q2019
Note:
(1) Aptiv is a global technology company that develops safer, greener and more connected solutions, which enable the future of mobility. FormFactor, Inc. is a Nasdaq-listed company and is a leading
provider of essential test and measurement technologies along the full Integrated Circuit life cycle - from characterization, modelling, reliability, and design de-bug, to qualification and production test. 26
(2) As at 31 Mar 2018.Acquisition
Growth
Top: 7000 Ang Mo Kio Avenue 5
Bottom: 750-750E Chai Chee RoadAcquisition Growth Strategies
Commitment of Sponsor
✓ ESR-REIT’s future growth
will be well-supported by
4 ESR Group
Overseas Acquisition ✓ “First look” on ESR Group’s
Opportunities portfolio – c.US$13bn of AUM
✓ In countries where ESR has a
3
Successful Completion of the Merger ✓
footprint and established “on the
ground” expertise
Portfolio of 57 assets following completion
With Viva Industrial Trust of merger with Viva Industrial Trust
✓ ESR-REIT is now 4th largest industrial
2
S-REIT
✓ Increased exposure to Business Park and
High-Specs sector
Strengthening Portfolio via Acquisitions
✓ Via pro-active capital recycling from divestments into
1
accretive acquisitions
✓ Consistently supported by strong Developer-Sponsor
281 Strengthened Portfolio via Acquisitions
▪ ESR-REIT’s portfolio has grown by >130% since ESR came on-board in January 2017 as REIT Sponsor
▪ Growth has been consistently supported by strong Developer-Sponsor
▪ Acquired 2
Properties: 8 Acquired 15
Tuas South Lane Acquired Viva Greenwich
and 7000 Ang Mo Industrial Drive
Kio Ave 5 Trust
▪ S$141.9m S$3.1bn (1)
Preferential S$3.0bn
Offering with ESR
ESR came backstopping
on- board in S$125m
January 2017
as Sponsor
S$1.7bn
S$1.3bn0
Jan12017 – Mar 2018
Dec 2017 2 15 Oct
3 2018 25 Oct
4 2018
Sponsor is aligned with Unitholder’s interest and continues its commitment to support the REIT’s growth
Note:
(1) As at 30 Sep 2018, includes VT assets (total assets of S$1.32bn as at 30 Jun 2018) and the c.S$95.8m acquisition of 15 Greenwich Drive completed on 25 Oct 2018.
291 Via Capital Recycling into Accretive Acquisitions
ESR-REIT engaged a pro-active strategy to divest 4 non-core assets at above valuation, and re-directed proceeds to fund 3
accretive acquisitions, improving portfolio returns
Divestments Acquisitions
▪ Lower-yielding non-core assets ▪ Higher-yielding value-adding assets
▪ Each asset1 Recent Acquisitions in 2017 and 2018
8 Tuas South Lane 7000 Ang Mo Kio Avenue 5 15 Greenwich Drive
Purchase S$106.1 million Purchase Purchase Price S$95.8 million(4)
S$240.0 million(2) (80% interest)
Consideration (c.8% below valuation)(1) Consideration
Occupancy 100.0%
Independent
S$303.0 million (100% basis)
15 years for majority of Valuation
Lease Term the space, with built-in
Committed
rental escalations 91.9% (as at 1 December 2017)
Occupancy
Number of Tenants 8 (as at 1 December 2017)
WALE by Rental
5.5 years
Income
Note:(1) With reference to the announcement dated 18 Oct 2017. (2) Excludes acquisition fee payable to the Manager of S$2.4 million, stamp duties of approximately S$0.5 million and other transaction costs of
approximately S$0.6 million. Estimated total cost of the acquisition is approximately S$243.5 million. (3) With reference to the announcement dated 14 Dec 2017. (4) Based on pro forma financial effects of acquisition
on annualised DPU for 3-month period ended 31 Mar 2018, as if the acquisition had been completed on 1 Jan 2018, which was included in the announcement dated 24 Apr 2018. (5) Includes the purchase 31
consideration of S$86.2 million and estimated upfront land premium payable for the balance lease term of S$9.6 million.2 Successful Merger with Viva Industrial Trust
▪ ESR-REIT completed the merger with Viva Industrial Trust in October 2018, and currently has total assets of S$3.1 billion(1)
with 57 properties
▪ Transaction has propelled the REIT to be the 4th largest industrial S-REIT and increased our exposure in the Business
Park/High-Specs sectors
48
Assets
Sub-Trust now known
as Viva Trust (“VT”)
9
assets
Focus will be on integration of the portfolios to extract synergies
Notes:
(1) As at 30 Sep 2018, includes VT assets (total assets of S$1.32bn as at 30 Jun 2018) and the c.S$95.8m acquisition of 15 Greenwich Drive completed on 25 Oct 2018.
323 Overseas Acquisition Opportunities
▪ ESR-REIT has “first look” on ESR Group’s portfolio of assets - approximately US$13bn of AUM
▪ REIT’s overseas exposure will be in countries where ESR has a footprint and established “on the ground” expertise
ESR Group’s Regional Presence Selected properties from ESR’s regional portfolio
1 China
2 South Korea
3 Japan
China
4 India
5 Singapore
South Korea
6 Australia
▪ GFA of >10m(1) square
metres in operation
and under
development
▪ AUM of c.US$13bn Japan
Notes: Information above as of 30 Jun 2018
(1) Excluding Australia.
334 ESR-REIT Future Growth Well-Supported by ESR Group(1)
▪ A leading Pan-Asian logistics real estate developer, operator and fund manager focusing
on developing and managing institutional-quality logistics facilities with a high-quality
tenant base
▪ ESR-REIT has “first look” on the pipeline of assets in an increasingly asset scarce
environment for quality logistics assets
Selected ESR Group’s Demonstration of Support for
Equity ESR-REIT
Investors
Payment of S$62m
for the VI-REIT
Manager to facilitate
the Merger with Viva
Selected Industrial Trust
Fund
Level Financial
commitment to grow
Investors
ESR-REIT via
S$125m backstop in
recent Preferential
Offering
Notes: Information above as of 30 Jun 2018.
(1) ESR Cayman Limited and its subsidiaries.
34Capital
Management
Top: 7000 Ang Mo Kio Avenue 5
Bottom: 750-750E Chai Chee RoadKey Capital Management Indicators
As at 30 Sep As at 30 Jun Breakdown of Debt (as at 30 Sep 2018)
2018 2018
Total Gross Debt (S$ million) 510.0 513.0 Total Debt: S$510.0m
Debt to Total Assets (%) 30.3 30.5 13.3%
Weighted Average All-in Cost of Debt (%) p.a. 3.76 3.75
Weighted Average Debt Expiry (years) 2.2(1) 2.4(1)
24.5% 71.6%
Interest Coverage Ratio (times) 4.1 4.4
Interest Rate Exposure Fixed (%) 91.2(2) 90.6(2)
MTNs
Proportion of Unencumbered Investment
100 100 Unsecured Bank Loans
Properties (%)
Unsecured RCF Loans
Undrawn Available Committed Facilities
205.0 202.0
(S$ million)
Proportion of Unencumbered Investment Properties Interest Rate Exposure Fixed (%)
Portfolio is 100% unencumbered 8.8% Fixed Interest Rate
Floating Interest Rate
100.0%
91.2%
Note:
(1) Assumes the loan facility expiring in 2019 is extended based on the loan facility pending for utilisation to refinance the outstanding loan.
(2) Excludes forward start interest rate swaps entered into which only commence in Dec 2018. 36Diversified Pools of Capital to Reduce Funding Risks
We have successfully tapped into new pools of capital and broadened our banking relationships
Perpetual Securities Issuance Preferential Offering
▪ S$150.0m perpetual securities at 4.6% coupon ▪ S$141.9m Preferential Offering, issued 262.8m new units at 7.1%
discount to VWAP price of S$0.5812 per unit
▪ Issued on 3 November 2017
▪ Sponsor committed to take up to S$125m; with resultant being
176% subscribed
Joint Bookrunners: ▪ Completed on 28 March 2018
Financial Advisor and Global Coordinator for the Preferential Offering:
Broadened Lending Bank Relationships
S$150m Committed S$200m Committed S$100m Committed S$700m Committed Loan Facility
Unsecured Loan Facility Unsecured Loan Facility Unsecured Loan Facility
Merger with Viva Industrial Trust
June 2015 Sep 2016 Oct 2018
Oct 2018
37Key Financials
Snapshot
Top: 7000 Ang Mo Kio Avenue 5
Bottom: 750-750E Chai Chee RoadIncreasingly Stable Distributions
Increasingly stable distributions in line with effective execution of ESR-REIT’s strategy
Quarterly Distribution Per Unit Growth (%)
10.0%
5.0%
0.0%
1Q17 2Q17 3Q17 4Q17 1Q18 2Q18 3Q18
-5.0%
-10.0%
-15.0% Impact due to higher Impact due to Preferential
operating property Offering in Feb 2018
-20.0%
expenses
Quarterly Distribution Per Unit (cents)
1.10
1.004 1.001 1.004
1.00 0.956 0.964
0.929
0.90 0.847
0.80
0.70
1Q2017 2Q2017 3Q2017 4Q2017 1Q2018 2Q2018 3Q2018
393Q2018 At A Glance
Gross Net Property
Revenue Income
S$32.4m S$22.5m
DPU Total NAV Per Unit
(cents) Assets (Cents)
1.004 S$1.68bn(1) 58.0
Note:
(1) Includes valuation of 7000 Ang Mo Kio Avenue 5 on a 100% basis, of which ESR-REIT has 80% economic interest.
40Balanced Debt Maturity Profile
▪ S$155m bond expiry in November 2018
‒ Undrawn available committed RCF of S$205.0m provides financial flexibility
▪ Loan facility obtained to refinance outstanding loan expiring in 2019
Debt Maturity Profile (as at 30 Sep 2018)
(S$m) Undrawn available Estimated
committed RCF WADE of
provides financial 3.0 years
200 flexibility
155 (1) (2)
S$m
100 155(1) 100
160 100(2)
155 155(1)(1)
155 100
50
25
15 5
0
2018 2019 2020 2021 2022 2023
MTNs Unsecured RCF Loans Unsecured Bank Loans
% of Debt
30.4% 22.5% 31.4% 5.9% 0% 9.8%
Expiring
Note:
(1) Assuming the S$155.0m bond is refinanced by the existing undrawn RCF, Weighted Average Debt Expiry is estimated to increase to 3.0 years.
(2) Assumes the maturing loan facility is extended based on the loan facility pending for utilisation to refinance the outstanding loan. 41Why ESR-REIT Top: 7000 Ang Mo Kio Avenue 5 Bottom: 750-750E Chai Chee Road
Why Invest in ESR-REIT

        1
                      Attractive Distribution Yield of 7.5%(1)
                      - Effective execution of strategy has created stable and
                        recurring stream of distributions for Unitholders

                    2
                                Backed by Strong Developer Sponsor ESR Group
                                - ESR Group provides strong financial support, access to
                                 regional tenant networks and potential pipeline of assets

                                              Resilient and Diversified Portfolio

                                 3
                                              - Majority of portfolio comprises business parks and high-specs
                                                properties, sectors that are in demand and with potential to
                                                achieve higher rents due to favourable supply and demand
                                                dynamics over the next 3 years

                                                          Ample Growth Opportunity, Scalable Platform

                                              4
                                                          - ESR-REIT’s merger with Viva Industrial Trust has laid
                                                            the foundations for a future-forward REIT platform that
                                                            can accelerate growth and support sustainable
                                                            returns
        Note:
        (1) Based on closing price of S$0.51 on 30 Sep 2018 and annualised 3Q2018 YTD DPU of 3.80 cents.
                                                                                                                      43
Appendix Top: 7000 Ang Mo Kio Avenue 5 Bottom: 750-750E Chai Chee Road
3Q2018 Financial Results

                                                                                                                                            3Q2018                                      3Q2017                               +/(-)
                                                                                                                                          (S$ million)                                (S$ million)                           (%)

Gross Revenue (1)(3)                                                                                                                              32.4                                       27.1                            19.4

Net Property Income (2)(3)                                                                                                                        22.5                                       19.6                            15.0

Amount Available for Distribution to Unitholders(4)                                                                                               13.4                                       12.6                            6.2

Distribution from Other Gains(5)                                                                                                                   2.5                                           -                           n.m.

Total Amount Available for Distribution to Unitholders                                                                                            15.9                                       12.6                            26.0

Distribution Per Unit (“DPU”) (cents) for 3Q2018                                                                                                1.004                                       0.964                            4.1
      Note:
      (1) Includes straight line rent adjustment of S$0.4 million (3Q2017: S$0.2 million).
      (2) Higher Net Property Income (“NPI”) mainly due to full quarter contributions from two acquisitions (8 Tuas South Lane and 7000 Ang Mo Kio Ave 5) in Dec 2017, partially offset by non renewal of leases at 12 Ang
            Mo Kio St 65, 31 Tuas Ave 11, 54 Serangoon North Ave 5, 4/6 Clementi Loop, 1&2 Changi North St 2 and 3C Toh Guan Road East, lease conversion of 16 Tai Seng Street (2Q2018) and 21B Senoko Loop
            (1Q2018), 4 property divestments (87 Defu Lane 10, 23 Woodlands Terrace,55 Ubi Ave 1 and 9 Bukit Batok St 22 ) since 3Q2017 and 30 Marsiling Industrial Est Road 8 AEI.
      (3) Includes Non-Controlling Interest (“NCI”) of 20% of 7000 Ang Mo Kio Ave 5 in 3Q2018.
      (4) 35% of management fees are payable in units for 3Q2018.
      (5) $2.5m payout from ex-gratia payments received from SLA in connection to the compulsory acquisition of land from prior years.

                                                                                                                                                                                                                                     45
YTD3Q2018 Financial Results
YTD3Q2018 YTD3Q2017 +/(-)
(S$ million) (S$ million) (%)
Gross Revenue (1)(3) 98.5 82.5 19.4
Net Property Income (2)(3) 69.8 58.5 19.2
Amount Available for Distribution to Unitholders(4) 40.9 38.2 7.1
Distribution from Other Gains(5) 4.3 - n.m.
Total Amount Available for Distribution to Unitholders 45.2 38.2 18.3
Distribution Per Unit (“DPU”) (cents) for YTD3Q2018 2.852(6) 2.924 (2.5)
Note:
(1) Includes straight line rent adjustment of S$1.1 million (YTD3Q2018: S$0.6 million).
(2) Higher NPI mainly due to contributions from two acquisitions (8 Tuas South Lane and 7000 Ang Mio Kio Ave 5) acquired in mid December 2017, partially offset by non renewal of leases at 12 Ang Mo Kio St 65, 31
Kian Teck Way, 31 Tuas Ave 11, 54 Serangoon North Ave 5, 3C Toh Guan Road East, 1&2 Changi North St 2 , lease conversion of 16 Tai Seng St (2Q2018), 21B Senoko Loop (1Q2018) and 3 Pioneer Sector 3
(3Q2017), 4 property divestments (87 Defu Lane 10, 23 Woodlands Terrace,55 Ubi Ave 1 and 9 Bukit Batok St 22) since YTD3Q2017 and 30 Marsiling Industrial Est Road 8 AEI.
(3) Includes Non-Controlling Interest (“NCI”) of 20% of 7000 Ang Mo Kio Ave 5 in YTD3Q2018.
(4) Higher distributable income due to better NPI performance of the portfolio as per (2). 35% of management fees are payable in units for 3Q2018.
(5) $4.3m payout from ex-gratia payments received from SLA in connection to the compulsory acquisition of land from prior years
(6) Lower headline DPU due to the EFR units issued (262.8 million units) in March 2018 and DRP (12.6 million units) since YTD3Q2017.
46Balance Sheet Summary
As at 30 Sep 2018 As at 30 Jun 2018
(S$ million) (S$ million)
Investment Properties(1) 1,655.4 1,653.8
Other Assets 25.9 28.0
Total Assets 1,681.3 1,681.8
Total Borrowings (net of loan transaction costs) 508.5 511.2
Other Liabilities 40.8 36.5
Non-Controlling Interest 60.6 60.6
Total Liabilities 609.9 608.3
Net Assets Attributable to:
- Perpetual Securities Holders 152.8 151.1
- Unitholders 918.6 922.4
No. of Units Issued/Issuable (million) 1,583.7 1,583.7
NAV Per Unit (cents) 58.0 58.2
Note:
(1) Includes valuation of 7000 Ang Mo Kio Avenue 5 on a 100% basis, of which ESR-REIT has 80% economic interest.
47Key Portfolio Statistics
As at As at
30 Sep 2018 30 Jun 2018
Number of Properties 47 47
Valuation (S$ million)(1) 1,652.2 1,652.2
GFA (million sq ft) 9.7 9.7
NLA (million sq ft) 8.8 8.8
Weighted Average Lease Expiry (“WALE”) (years) 4.4 4.5
Weighted Average Land Lease Expiry (years) 32.7 33.0
Occupancy (%) 92.9 91.4
Number of Tenants 184 197
Security Deposit (months) 6.6 6.8
Note:
(1) Includes valuation of 7000 Ang Mo Kio Avenue 5 on a 100% basis, of which ESR-REIT has 80% economic interest. 48Quality and Diversified Tenant Base
Top 10 Tenants Account for 41.7% of Rental Income
Top 10 Tenants (by Rental Income)
(as at 30 Sep 2018)
10.0%
8.9%
9.0%
8.0%
6.9%
7.0% 6.6%
6.0%
5.0%
4.1%
4.0%
3.2% 3.1%
3.0% 2.6%
2.1% 2.1% 2.1%
2.0%
1.0%
0.0%
AMS Sensors Hyflux Membrane Venture Corporation Data Centre Operator (2) HG Metal Eurosports Auto Pte Aptiv Safety & Mobility Strides Pharma Global StorHub Kallang Pte. Soon Wing
(1)
Singapore Pte. Ltd. Manufacturing (S) Pte. Limited Manufacturing Limited Ltd Services Singapore Pte. Limited Ltd. Investments Pte Ltd
Ltd. Pte. Ltd.
Note:
(1) Formerly known as Heptagon Micro Optics Pte Ltd.
(2) Tenant cannot be named due to confidentiality obligations. 49Diversified Tenant Base and Trade Sectors
No individual trade sector accounts for more than 14.2% of ESR-REIT’s Rental Income
Breakdown by Trade Sectors (by Rental Income) (as at 30 Sep 2018)
Construction, Civil & Precision Engineering, 2.8%
Data Centre, 4.4% Engineering Services, 4.9%
Precision Engineering, 2.8% Logistics, 7.9%
Other Services, 3.6%
Others, 0.5%
M&E Services and Gas Supply,
1.3% General storage, 9.9%
Professional Computer,
Electronic and Optical
Products, 3.1%
Architectural and Engineering
Activities and Related Technical Infocomm, 4.4% Transportation and
Consultancy, 3.3% Storage, 21.9%
Specialised storage, 4.1%
Professional, Scientific and
Food Related Services, Techinical Activities, 8.2%
1.1%
Wholesale, Retail
Education, 1.4% Trade Services and
Others, 17.5% Fabricated Metal Products,
Car Distribution, 3.1% Manufacturing, 36.7% 6.3%
Wholesale of Industrial,
Computer, Electronic and
Construction and IT Related
Optical Products
Machinery and Equipment,
(Manufacturing), 14.2%
2.1%
Wholesale of Household Goods, Machinery and Equipment,
Textiles, Furniture & Furnishing 2.7%
and Others, 9.8%
Paper and Paper Products, 3.3%
Water & Energy, 7.0%
Pharmaceutical, 2.1% Rubber and Plastic Products, 1.1%
50Healthy Occupancy Consistently Above JTC Average
Portfolio Occupancy (As at 30 Sep 2018)
100.0%
98.0%
96.0% 95.4% 95.4%
94.3% 94.7%
94.1%
94.0% 93.4% 93.6%
93.0% 92.9%
92.0% 91.1% 91.4%
90.6% 90.7%
90.1%
90.0% 89.4% 89.5% 89.4% 89.1%
89.1% 88.7% 88.90% 89.0% 88.7%
88.6%
88.0%
86.0%
84.0%
82.0%
4Q15 1Q16 2Q16 3Q16 4Q16 1Q17 2Q17 3Q17 4Q17 1Q18 2Q18 3Q18
JTC Average ESR-REIT
51Cheryl Lim Lyn Ong Marketing Communications Manager Investor Relations Manager Tel: (65) 6222 3339 Tel: (65) 6222 3339 Fax: (65) 6827 9339 Fax: (65) 6827 9339 cheryl.lim@esr-reit.com.sg lyn.ong@esr-reit.com.sg
You can also read