Value of electric vehicles to New Zealand - Prepared for Orion 12 August 2019 www.concept.co.nz
←
→
Page content transcription
If your browser does not render page correctly, please read the page content below
www.concept.co.nz

Value of electric vehicles to New Zealand
Prepared for Orion
12 August 2019

About Concept

Concept Consulting Group Ltd (Concept) specialises in providing analysis and advice on energy-related
issues. Since its formation in 1999, the firm’s personnel have advised clients in New Zealand, Australia,
the wider Asia-Pacific region and Europe. Clients have included energy users, regulators, energy
suppliers, governments, and international agencies.

Concept has undertaken a wide range of assignments, providing advice on market design and
development issues, forecasting services, technical evaluations, regulatory analysis, and expert
evidence.

Further information about Concept can be found at www.concept.co.nz.

Disclaimer

This report has been prepared by Concept based entirely on our analysis of public information sources.

Except as expressly provided for in our engagement terms, Concept and its staff shall not, and do not,
accept any liability for errors or omissions in this report or for any consequences of reliance on its
content, conclusions or any material, correspondence of any form or discussions, arising out of or
associated with its preparation.

The analysis and opinions set out in this report reflect Concept’s best professional judgement at the
time of writing. Concept shall not be liable for, and expressly excludes in advance any liability to update
the analysis or information contained in this report after the date of the report, whether or not it has
an effect on the findings and conclusions contained in the report.

This report remains subject to any other qualifications or limitations set out in the engagement terms.

No part of this report may be published without prior written approval of Concept.

© Copyright 2019
Concept Consulting Group Limited
All rights reserved
Contents
1     Introduction and summary ............................................................................................................. 2
2     Methodology................................................................................................................................... 4
    2.1      Assessing the relative cost of EVs and ICEs............................................................................. 4
    2.2      Estimate the total cost to New Zealand associated with different levels of EV uptake ......... 4
3     Results ............................................................................................................................................. 7
    3.1      Calculation of the relative cost of EVs and ICEs ...................................................................... 7
    3.2      Estimation of the total benefit to New Zealand from different levels of EV uptake ............ 11
4     Policy implications ........................................................................................................................ 13
Appendix A.          Methodology and assumptions .................................................................................... 14

                                                                             1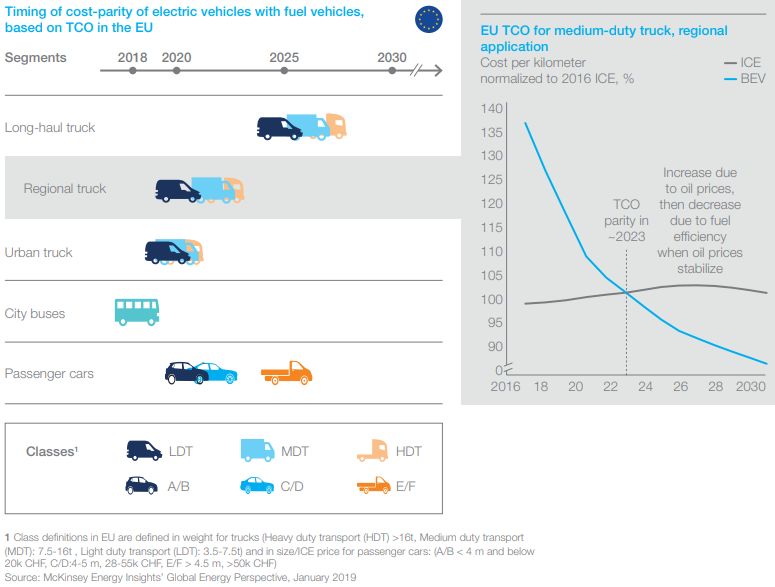
1 Introduction and summary
This report sets out the results of modelling to estimate the relative cost to New Zealand of internal
combustion engine (ICE) vehicles versus electric vehicles (EVs).
It finds that, while EVs are currently more expensive to purchase than ICEs, the continued rapid
decline in the cost of batteries, coupled with global vehicle manufacturers rapidly moving to produce
EVs as main-stream vehicles, means that up-front capital purchase cost parity for new light vehicles
will be achieved within ten years.
Further, although EVs are currently more expensive to purchase, they are far less costly to run as:
•   EVs are 3.5 to 4 times more energy efficient than ICEs
•   The ‘fuel’ distribution infrastructure (i.e. electricity wires) already exists and, with ‘smart’ EV
    charging at predominantly off-peak periods, should only require a proportionately relatively
    small amount of additional investment to meet EV demand growth
•   EVs have far fewer moving parts, making them cheaper to maintain
•   The electricity to fuel them in New Zealand will almost entirely come from renewable
    generation, meaning there will be virtually zero carbon emissions
•   EVs do not produce tailpipe emissions that are harmful to human health
When these lower costs of operation are included our central projection is that, from a whole-of-
New-Zealand perspective, EVs will become cheaper than ICEs for light vehicles on a total lifetime
cost basis by 2021, and by 2029 for heavy trucks.1
In other words, in the next few years EVs are likely to become lower cost transport solutions for New
Zealand than petrol or diesel vehicles. This remains true even if a cost of carbon is excluded.
Although there are some inherent uncertainties in estimating future costs (for example, the future
price of oil, or the rate of cost reduction of EVs) these values for when EVs are likely to be cheaper
than ICEs are consistent with (indeed slightly more pessimistic than) recent studies by Bloomberg
New Energy Finance and McKinsey & Co.
Modelling was undertaken to compare the total net benefit to New Zealand of three different
scenarios of EV uptake out to 2040 based on when 100% of all light vehicles entering New Zealand
being EVs would be achieved: by 2030, 2035 and 2040. These uptake patterns were chosen given
that a number of countries and large cities have implemented legislation which would ban new ICE
light vehicles from these times. (With Norway even implementing such a ban from 2025).
The results of this are shown in Table 1, with the benefit expressed relative to:
•   a future where no EV uptake were to occur; and
•   the rates of EV uptake currently projected by the Ministry of Transport in its ‘Base’ scenario.

1
 Variations in vehicle operating patterns will mean this timing of total lifetime cost parity will be earlier for
some vehicles, and later for others.

                                                          2
Table 1: Net benefit of scenarios EV uptake from 2019 to 2040 ($bn net present value)2
Uptake scenario for when 100% light vehicle entry achieved
Benefit relative to: 2030 2035 2040
No EV uptake 60 48 38
MOT Base scenario 30 18 8
Although the above analysis indicates significant benefit to New Zealand from rapid EV uptake, the
above analysis is based on costs-and-benefits from a ‘public’ whole-of-New-Zealand perspective.
The study also highlights several issues which mean that, if they are not addressed, EV uptake will be
likely to fall substantially below these levels:
• Significant pricing externalities which mean that the ‘private’ benefit to a vehicle owner of
purchasing an EV is lower than the public benefit to New Zealand as a whole:
− Non-cost-reflective electricity prices which mean that the cost of re-charging an EV overnight
is substantially greater than its economic cost;
− Owners of combustion engine vehicles not directly bearing the respiratory health costs
associated with tailpipe emissions
− The current NZ$25/tCO2 price of carbon emissions from ICE vehicles being significantly lower
than the prices which are generally considered necessary to avoid global temperatures rising
above 1.5˚C or even 2˚C.
• Current levels of public charging infrastructure to enable away-from-base charging are
substantially below the levels required to support high levels of EV uptake.
In many overseas jurisdictions, the ‘chicken or egg’ problem of EV chargers not being
commercially economic to install before EV penetration increases, and EV penetration not
increasing if EV chargers aren’t common place, has been addressed via regulations that
specifically allow for electricity network companies to play a significant role in this infrastructure
investment. New Zealand regulation currently doesn’t allow this.
• EV uptake suffering from barriers to profitable investments due to high up-front capital costs:
− Consumers ‘irrationally’ valuing near-term costs/benefits much more highly than those in the
medium-to-long-term3. This can be exacerbated with split-incentive issues where businesses
buying fleet vehicles may principally be focussed on costs for an initial 3-year period, rather
than whole-of-life.
− The transaction costs associated with financing investments for consumers facing capital
constraints – e.g. has occurred for the installation of home insulation.
• Barriers associated with new technologies, where lack of familiarity and perceived technological
risk can slow adoption. This may be a particular issue for commercial transport.
The rest of this report sets out the detail behind the above analysis and conclusions.
2
For this evaluation, a NZ$100/tCO2 price of carbon was used, being in the lower half of a survey of estimates
of carbon prices necessary to meet New Zealand’s net-zero-by-2050 emissions target.
3
In behavioural economics this phenomenon is known as consumers applying hyperbolic discount rates.
32 Methodology
Our modelling consists of two key elements
1) Evaluate the relative cost of EVs and ICEs, and how such costs will change over time
2) Estimating the total cost-benefit to New Zealand associated with different levels of EV
uptake
2.1 Assessing the relative cost of EVs and ICEs
A model was built which evaluates the lifetime cost of individual EVs and ICEs at the time when they
enter New Zealand.
There are many different aspects to evaluating the lifetime costs of EVs and ICEs. This is set out in
detail in Appendix A. However, in brief, this requires consideration of:
• Initial capital cost
• Fuel costs (petrol/diesel in the case of ICEs, electricity in the case of EVs)
• Maintenance costs
• Potential ‘productivity penalties’ for EVs associated with the heavier weight of batteries and
longer re-charging times
• Emissions costs:
− Global warming associated with CO2 emissions
− Human health costs associated with other tailpipe emissions (particularly particulates, and
NOx)
The model also assesses the likely change in some of these costs over time. In particular, the likely
significant reduction in EV capital costs as battery costs fall and EV production starts to achieve scale
economies.
The model considered five main categories of vehicle that are sufficiently distinct in characteristics
to warrant separate analyses:
• Light private vehicles (‘LPVs’ i.e. cars)
• Light commercial vehicles (‘LCV’s i.e. vans)
• ‘Medium’ trucks (‘Truck_M’)
• ‘Heavy’ trucks (‘Truck_H’)
• Buses
Further, within these categories the model distinguishes between:
• new and used vehicles entering New Zealand (with used vehicles predominantly being 5-10-
year-old second-hand imports from Japan)
• vehicles which are likely to be driven a lot over their lifetime, versus those driven relatively less
often
2.2 Estimate the total cost to New Zealand associated with different levels of EV
uptake
To estimate the potential scale of benefit from EV uptake, the model was run to calculate the
lifetime cost of all vehicles entering New Zealand (EVs and ICEs) from 2019 through to 2040. These
4lifetime costs for all vehicles entering in a given year were summed for the twenty-two years from
2019 to 2040 – discounting future years to give a present value.4
The number of vehicles projected to enter each year was based on MoT’s projections of growth in
total vehicle numbers as published in its “Transport Outlook: Future State”5, combined with an
assumption that the proportion of the fleet being scrapped each year would be at the average rate
experienced over the past 15 years.
Several different scenarios were considered as to the proportion of such vehicles which would be
electric in each year:
• No EV uptake throughout the projection period – the counterfactual
• The projection set out in MoT’s “Base” scenario in its “Transport Outlook: Future State”. This is
shown in Figure 1 below
• Bringing forward by two years the rate of uptake from MoT’s base scenario. (e.g. the rate of EV
uptake projected by MoT for 2025 was assumed to occur in 2023)
• A scenario where uptake would follow an s-curve pattern, reaching 100% of light vehicles
entering NZ being EVs by 2040, with medium and heavy trucks reaching this point three and
twelve years later, respectively. This is shown in Figure 2 below. The 2040 value was chosen
given that a number of countries have implemented legislation which would ban new ICE light
vehicles from 2040.
• Two further scenarios where achievement of 100% of light vehicles entering NZ being EVs occurs
in 2035, and 2030, respectively. These scenarios are consistent with some other countries and
large cities which have introduced bans earlier than 2040. Norway for instance has a ban from
2025.
• A projection where vehicles entering New Zealand would be EVs, as soon as the model projects
that for a particular vehicle situation (i.e. taking account of the distance driven) the New Zealand
benefit would be positive – excluding carbon costs.
4
A 6% discount rate has been used for all discounting.
5
https://www.transport.govt.nz/mot-resources/transport-outlook/transport-outlook-future-state-model-
results/
5Figure 1: MoT 'base' scenario for proportion of vehicles entering NZ which are EVs
Figure 2: Scenario of 's-curve' EV uptake with 100% of LPV vehicles entering NZ being EVs by 2040
63 Results
3.1 Calculation of the relative cost of EVs and ICEs
The model was run to estimate the total lifetime cost of the different vehicle types, for the different
situations for vehicles entering New Zealand in a particular year. This calculation was undertaken for
all years out to 2040.
Figure 3 shows the change in the projected lifetime total cost of an EV vehicle relative to an ICE
vehicle, averaged across all vehicle situations6, from a whole-of-New Zealand perspective – i.e. based
on the underlying economic costs of purchasing and running the vehicles, and including the
respiratory health costs associated with ICE tailpipe emissions, but excluding carbon costs. It also
assumes that there is a need to purchase a new vehicle – i.e. it doesn’t evaluate the cost of
scrapping an existing ICE vehicle early.
Figure 3: Change in relative lifetime costs of EVs compared to ICEs from a whole-of-New Zealand
perspective, including respiratory cost effects, but excluding carbon costs (100 = parity with ICE)
As can be seen, from this whole-of-New Zealand total lifetime cost perspective, the model is
projecting that, even without a cost of carbon, electric buses and electric light commercial vehicles
(vans) are already lower cost options than their ICE counterparts.7 It is also projecting that EVs will
be lower cost options for light private vehicles (cars) and medium trucks by the early 2020s, with EV
heavy trucks achieving total cost parity with ICE heavy trucks by the mid-2020s.
To give further insight into the components of these relative costs, Figure 4 below shows the
breakdown of the lifetime cost components for new vehicles purchased in 2025. For this analysis we
have introduced the cost of carbon, with carbon emissions notionally priced at NZ$100/tCO2-e.
6
Averaging across vehicle situations hides the fact that for vehicles which travel relatively longer distances
than average the relative benefit of EVs is even greater (due to the lower fuel, maintenance, and respiratory
costs), and vice versa for vehicles travelling shorter distances than average. Nonetheless, this analysis is
considered representative of the underlying broad relative economics of the two vehicle fuel types.
7
A significant factor driving the relative benefit of EV buses and LCVs is the respiratory health costs associated
with the predominantly urban + diesel operation of their ICE counterparts. This contrasts with the lower
respiratory health effects of petrol ICEs (i.e. LPVs) or highway and rural road driven ICEs (i.e. trucks).
7Figure 4: Breakdown of lifetime costs for new ICE and EV vehicles purchased in 2025 ($k NPV, excl. GST)
Light Passenger Vehicles (Cars) Light Commercial Vehicles (Vans)
Medium trucks Heavy trucks
8Figure 4 shows that in all cases, EVs in 2025 still have a higher up-front capital cost but deliver
lifetime savings from lower costs of operation per km travelled – fuel, maintenance, and emissions-
related.
Light commercial EVs are relatively more cost-effective than light private EVs due to
• commercial vehicles travelling significantly greater average daily kilometres without needing a
materially greater battery; and
• a much higher proportion of ICE light commercial vehicles being diesel-fuelled, and thus causing
significantly greater respiratory costs.
Heavy truck EVs are relatively less cost-effective than light private EVs due to:
• Needing relatively larger batteries – and thus incurring higher capital costs; and
• Suffering a productivity penalty associated with heavier weight and longer refuelling times, with
such productivity costs also applying to the costs of employing drivers – noting that driver costs
are not a cost factor for light private vehicles.
If the projections shown in Figure 3 and Figure 4 are correct, it would suggest that New Zealand
should be experiencing greater levels of EV uptake than it is currently experiencing – noting that, as
set out in footnote 6, the relative benefit of EVs for vehicles that are driven greater than average will
be even greater than indicated in Figure 3 (albeit balanced with the relative benefit being less for
vehicles which travel less than average).
However, Figure 3 and Figure 4 consider the total costs from a whole-of-New Zealand perspective.
Figure 5 below shows the same analysis from a consumer (i.e. vehicle owner) perspective. This
excludes the costs associated with respiratory effects and carbon emissions, and assumes that
vehicle owners continue to pay for electricity based on current, non-cost-reflective tariff structures.
Figure 5: Change in relative lifetime costs of EVs compared to ICEs from a consumer perspective
(100 = parity with ICE)
From this perspective, the time at which EVs reach cost parity for vehicle owners on a total cost of
ownership basis for the different vehicle types is pushed back several years – although EV buses are
still considered to be cost-effective now.
9This result was compared with a similar analysis recently published by McKinsey, reproduced in
Figure 6 below.
Figure 6: McKinsey projection of timing of cost-parity of EVs with ICEs, based on total cost of
ownership8
Source: “Global Energy Perspective 2019: Reference Case”, McKinsey, January 2019
As can be seen by comparing Figure 5 and Figure 6, there is close alignment with McKinsey’s
projections and our projections. Indeed, McKinsey is relatively more optimistic about the time when
heavy trucks will achieve TCO parity, with its comment “Future improvements in battery technology
(e.g. density) will enable the electrification of the heavy-duty segments, which are currently the
hardest to electrify”. We have not taken account of possible material improvements in battery
density which would reduce the weight-related productivity penalty for heavy trucks. If there were
material improvements over the next half decade, our projections of TCO-parity for heavy trucks
would be brought forward to be more similar to McKinsey’s.
The above analysis suggests that, even without a cost of carbon, EVs are likely to become lower cost
transport solutions from a total lifetime perspective over the next few years, albeit with current
pricing externalities making the benefit to New Zealand as a whole greater than the benefit to
individual vehicle owners.
As such, there would appear to be material benefit from uptake of EVs.
8
This McKinsey analysis is based on the consumer perspective as indicated by its accompanying comment:
“The timing of TCO parity in the US and China is comparable to Europe, with China slightly earlier and the US
slightly later, reflecting differences in fuel taxation and subsidies for electric vehicles.”
103.2 Estimation of the total benefit to New Zealand from different levels of EV
uptake
The model was run with the different scenarios of rates of EV uptake as set out previously in section
2.2.
Figure 7 presents the results of this analysis in terms of the incremental benefit to New Zealand of
EV uptake for these different scenarios relative to the counterfactual scenario of no EV uptake. The
results are also presented for the two different oil price scenarios set out in Appendix A: “Current
policies” (where oil prices largely remain flat), and “New policies” (where oil prices steadily rise)
The benefit is distinguished between:
• Non-emissions-related benefits – i.e. the net effect of capital costs, fuel costs, maintenance
costs, and other (non-emissions) costs
• Respiratory health benefits
• Carbon costs, with carbon emissions notionally evaluated at $100/tCO2e, being in the lower half
of a survey of estimates of carbon prices necessary to meet New Zealand’s net-zero-by-2050
emissions target.
Figure 7: NPV benefit of scenarios of EV uptake between 2019 and 2040 relative to situation of no
EV uptake
This analysis suggests that EV uptake at the rate projected by MoT in its Base scenario will deliver
approximately $30bn in benefits to New Zealand, with approximately $19bn of those being from
reduced oil purchase costs and $11bn being from reduced costs associated with emissions (both
respiratory health and global-warming related).
However, the analysis indicates that New Zealand would benefit by EV uptake rates significantly in
excess of those set out in MoT’s Base scenario. Rates of uptake consistent with prohibiting light ICE
vehicles entering New Zealand from 2030 are projected to deliver approximately $60bn in benefit.
11The at first sight surprising result that the 100% by 2040 scenario has similar benefit as the MOT
base projection is because, as Figure 1 and Figure 2 previously indicate, the Base MOT projection has
higher rates of LPV EV uptake up to 2032.
This higher LPV EV uptake for the MOT projection up to 2032 (and the associated benefit) broadly
balances, relative to the 100% by 2040 scenario, the lower rates of uptake for other vehicles – also
noting that NPV approaches will value early years in the time series more highly than later years.
124 Policy implications
The analysis indicates that large-scale EV uptake is likely to deliver substantial benefits to New
Zealand.
However, the analysis also highlights several issues which mean that, if they are not addressed, EV
uptake will be likely to fall substantially below these levels:
• Significant pricing externalities which mean that the ‘private’ benefit to a vehicle owner of
purchasing an EV is lower than the public benefit to New Zealand as a whole:
− Non-cost-reflective electricity prices which mean that the cost of re-charging an EV overnight
is substantially greater than its economic cost;
− Owners of combustion engine vehicles not directly bearing the respiratory health costs
associated with tailpipe emissions
− The current NZ$25/tCO2 price of carbon emissions from ICE vehicles being significantly lower
than the prices which are generally considered necessary to avoid global temperatures rising
above 1.5˚C or even 2˚C.
• Current levels of public charging infrastructure to enable away-from-base charging are
substantially below the levels required to support high levels of EV uptake.
In many overseas jurisdictions, the ‘chicken or egg’ problem of EV chargers not being
commercially economic to install before EV penetration increases, and EV penetration not
increasing if EV chargers aren’t common place, has been addressed via regulations that
specifically allow for electricity network companies to play a significant role in this infrastructure
investment. New Zealand regulation currently doesn’t allow this.
• EV uptake suffering from barriers to profitable investments due to high up-front capital costs:
− Consumers ‘irrationally’ valuing near-term costs/benefits much more highly than those in the
medium-to-long-term9. This can be exacerbated with split-incentive issues where businesses
buying fleet vehicles may principally be focussed on costs for an initial 3-year period, rather
than whole-of-life.
− The transaction costs associated with financing investments for consumers facing capital
constraints – e.g. has occurred for the installation of home insulation.
• Barriers associated with new technologies, where lack of familiarity and perceived technological
risk can slow adoption. This may be a particular issue for commercial transport.
It is beyond the scope of this study to analyse possible remedies to these barriers.
9
In behavioural economics this phenomenon is known as consumers applying hyperbolic discount rates.
13Appendix A. Methodology and assumptions
Modelling approach
The model evaluates the lifetime cost of EVs and ICEs at the time when they enter New Zealand, this
includes consideration of:
• Initial capital cost
• Fuel costs (petrol/diesel in the case of ICEs, electricity in the case of EVs)
• Maintenance costs
• Emissions costs:
− Global warming associated with CO2 emissions
− Human health costs associated with other tailpipe emissions (particularly particulates, and
NOx)
Five main categories of vehicle have been considered for this evaluation:
• Light private vehicles (‘LPVs’ i.e. cars)
• Light commercial vehicles (‘LCV’s i.e. vans)
• ‘Medium’ trucks (‘Truck_M’)
• ‘Heavy’ trucks (‘Truck_H’)
• Buses
These categories are sufficiently distinct in characteristics to warrant separate analyses.
Further, within these categories we distinguish between:
• new and used vehicles entering New Zealand (with used vehicles predominantly being 5-10 year
old second-hand imports from Japan)
• vehicles which are likely to be driven a lot over their lifetime, versus those driven relatively less
often
Lastly, the evaluation takes account of the likely change in some of these costs over time. In
particular, the likely significant reduction in EV capital costs as battery costs fall and EV production
starts to achieve scale economies.
Capital costs
Currently, EVs cost more to purchase than ICEs.
This is principally due to the high cost of the battery. However, it is also due to EVs not yet achieving
the full economies associated with designing and manufacturing EV-only vehicle models at scale,
rather than producing an EV-version and an ICE-version of a given vehicle (e.g. a VW Golf).
Although EVs currently cost more to purchase, battery prices are projected to continue to decline at
the high rates of reduction seen over the past couple of decades as EV uptake (and associated
battery production) rapidly accelerates around the world. For example, a recent Bloomberg New
Energy Finance report10 projected that EV battery costs would decline at almost 8% per year
10
“Consumers driving a global transition”, Leonard Quong, Bloomberg NEF. Presented in the NZ Downstream
2019 conference
14between 2018 and 2030. This may be conservative as it compares to an annualised rate of cost
reduction between 2010 and 2018 of 21% per year.11
Likewise, as EV-only models start to achieve manufacturing scale, further reductions in production
cost are likely to be achieved.
The result of this is that EV cars are likely to achieve up-front capital cost purchase price parity
within the next decade. For example, the Bloomberg report predicted that capital cost purchase
price parity for medium-sized cars in the USA would be achieved by 2024.
The EV / ICE cost differential for medium and heavy trucks is currently significantly greater, due to:
• the production of EV trucks being even more limited to date than EV light vehicles, so less
manufacturing scale efficiencies having yet been achieved.
• such vehicles being driven much more than private cars, as illustrated by Figure 8, and thus
requiring relatively larger batteries
Figure 8: Mean daily distance travelled by vehicles in New Zealand (km)
However, the relative battery cost differential between trucks and cars is nowhere near that implied
by Figure 8. This is because, the ‘range anxiety’ for vehicle purchases is heavily driven by
expectations of peak driving distances rather than average driving distances.
In this respect, the ratio between peak and average distance for a typical family car is significantly
greater than for a typical truck:
• Family cars generally doIt also allows for the relative cost of components to change over time. In particular:
• It assumes that battery costs will decline at approximately 7.5% p.a. (being the rate projected by
Bloomberg).
• It assumes that non-battery costs of EVs will decline at a rate of 0.5% p.a. relative to ICEs –
reflecting the achievement of scale economies
• It applies a factor to account for the early stages of EV development for some vehicle types (e.g.
heavy trucks), with an additional overlay to account for an NZ premium (relative to US prices) for
such EV vehicles in the early stages of development.
We have also applied a factor to account for what we term the EV ‘productivity penalty’ associated
with some vehicle types. As set out later in this section, this accounts for the fact that the heavier
vehicle weight and longer away-from-base re-fuelling times for some vehicle types mean that a
greater number of EVs will be needed to perform the same transport service as an ICE vehicle.
Using this model and assumptions, it is estimated that
• the average current capital cost differential in New Zealand (excluding GST) between new EVs
and ICEs is $16k for cars, $20k for vans, $135k for medium trucks, and $475k for heavy trucks.
(Noting that EV heavy trucks and (to a lesser extent) medium trucks have yet to start to be
produced in scale by vehicle manufacturers).
• Capital cost parity in New Zealand is estimated to be achieved by 2029 for light private vehicles,
2030 for vans, 2033 for medium trucks and 2050 for heavy trucks. For heavy trucks, the
proportionately larger battery requirement (due to travelling longer distances) and weight-
driven productivity penalty, are the key factors driving the much longer time it is projected
before they reach purchase cost parity with ICE heavy trucks.
These are considered to be relatively conservative assumptions given that, for example, Bloomberg
NEF is projecting capital cost parity for cars to be achieved by 2024.
Although there is currently limited choice for EVs – particularly for heavy trucks – global vehicle
manufacturers are starting to significantly scale up production at all levels, with many starting to
make commitments such as not producing any ICE-only models from a certain date. Volume
production has started to take off for cars, with the Bloomberg report indicating this would also be
achieved for vans within 1-3 years, medium trucks within 3-5 years, and heavy trucks from beyond 5
years.
Lastly, it should be noted that this approach assumes there is a need to purchase a new vehicle
anyway. The cost of an EV replacing an existing ICE vehicle that has remaining years of economic life
will be greater – substantially greater for replacing a relatively new ICE vehicle with many years of
remaining economic life.
Fuel costs
For fuel costs, we have considered the economic costs of producing and delivering fuel to power an
ICE or EV over its expected lifetime in New Zealand.
The key components to this analysis are:
• Estimating delivered fuel prices for petrol / diesel and electricity
• ICE and EV vehicle efficiencies
• Vehicle lifetime distances travelled
16Delivered fuel prices
Petrol and diesel costs
We estimate the pump price of petrol and diesel through a simple model with the following
components:
• World oil price (US$/bbl)
• Refining cost (US$/bbl)
• Shipping costs to New Zealand (comprised of a fixed component and an oil-price-driven
component) (US$/bbl and US$/GJ)
• NZ$ / US$ exchange rate
• Within-NZ fuel distribution and service station costs – sometimes referred to as ‘Importers
margin’ – (NZ$/GJ)
• Petrol and diesel energy densities (MJ/l)
The parameters for some of these elements (refining cost, shipping costs, and within-NZ fuel
distribution costs) have been derived from various stand-alone analyses based on several observed
data points. (e.g. analysis published by the AA, analysis of Z Energy accounts, etc.)
This ‘building-block’ approach allows for examination of the sensitivities of petrol and diesel prices
to key parameters:
• World oil price
• Potential future increases in fuel distribution and service station costs as the fixed costs of such
services are recovered over declining fuel sales (due to fuel switching to EVs). For this analysis
we have conservatively set this parameter to zero, although it has the potential to materially add
to petrol & diesel prices if the proportion of ICE vehicles on New Zealand’s roads decline
significantly.
We have ignored the petrol excise duty (PED) currently included within the pump price of petrol as
this is used to fund roading costs. Given that an EV will give rise to the same roading cost as an ICE,
it would be inappropriate to penalise or advance ICEs for this differential. In this respect, although
EVs are currently exempt from paying PED or road user charges (RUCs)12, it is expected that they will
need to start to contribute towards roading costs as the proportion of EVs on the roads rises.
Our projected costs are also exclusive of GST. (As is the case for all costs calculated in this exercise.)
Figure 9 shows the resultant petrol and diesel prices for two scenarios, both taken from the
International Energy Agency’s (IEA’s) World Energy Outlook projections:
• the IEA’s “Current Policies” world oil price scenario.
• the IEA’s “New Policies” world oil price scenario
12
The pump price of diesel does not include an excise tax to cover roading costs. Instead, diesel vehicles need
to purchase Road User Charges (RUCs) to cover roading costs.
17Figure 9: Central petrol and diesel price projections ($/l) – excl. PED, carbon and GST
IEA “Current policies” scenario IEA “New Policies” scenario
We have chosen these as we understand that MBIE uses these projections for its own evaluations of
potential future oil prices.
Electricity costs
The main components of costs for delivering electricity to fuel electric vehicles are:
• Generation costs
• Network costs
• Charging infrastructure
For the generation and network cost components, the cost varies according to when a vehicle is
being charged. In simple terms, consuming electricity at times of low system demand (e.g.
overnight) results in low generation costs and very low network costs, whereas consuming electricity
at times of peak system demand (e.g. a cold winter’s evening) results in high generation costs and
very high network costs.
Thus, the pattern of vehicle charging is a crucial consideration: vehicles which are charged during
night-time periods will impose electricity system costs many times less than vehicles which are
always charged in the early evenings.
For this analysis, we have assumed that the majority of charging undertaken at a vehicle’s ‘base’13 is
undertaken during night-time periods. However, we assume some proportion of charging occurs
during early evening peak periods – times of greatest electricity cost. This proportion is greatest for
light vehicles due to the assumption that optimising fuel cost is a greater consideration for larger
commercial vehicles. It also assumes that, as technology improves and makes it easier, over time
EVs will increasingly be charged at their base in a ‘smart’ fashion – predominantly overnight, and
completely avoiding system peak demand period.
We have also assumed that most light vehicles (cars and vans) don’t require specific chargers, given
that a standard domestic socket will be sufficient to recharge such vehicles overnight for the vast
majority of journey distances for such vehicles. However, we assume some proportion of vehicle
owners do purchase such chargers. All trucks and buses are assumed to require specific charging
infrastructure. The capital cost of such infrastructure has been based on estimates provided by
Orion.
The cost of away-from-base charging is assumed to be significantly greater as:
13
‘Base’ is at home for light private vehicles, and business premises for commercial vehicles)
18• It will be predominantly be during day-time periods, with higher consequent wholesale energy
and network costs;
• Charger capacities will need to be materially greater in order to re-charge the vehicle quicker (as
opposed to base charging spread over night-time hours).
On a $/kWh delivered basis, all vehicle types are assumed to face the same cost for away-from-base
charging.
Figure 10 shows the combined effect of these assumptions around wholesale energy, network and
charging infrastructure, to give a total $/kWh delivered cost. Note: these are economic costs to New
Zealand, and do not necessarily represent current electricity tariffs.
Figure 10: Assumed economic cost of electricity ($/kWh delivered)
Light vehicles initially have a higher base cost than heavy vehicles because of the assumption that a
greater proportion of such vehicles are not charged in a ‘smart’ fashion in the early years. However,
as the proportion of light vehicles charged in a smart fashion increases to similar levels as for heavy
vehicles by 2030, light vehicles achieve lower overall costs per kWh due to not requiring additional
charging infrastructure.
Away-from-base charging is considerably more expensive than base charging. It is therefore
important to consider the proportion of charging that is required away from a vehicle’s base, in
order that the overall cost of electricity to refuel an EV can be estimated.
We have assumed that, on average for vehicles purchased in 2019, approximately 15% of annual
kWh will be from away-from-base charging. This proportion is assumed to fall to 6.5% for vehicles
purchased in 2035 due to the related assumption that average battery sizes will continue to increase
as battery costs fall.
Vehicle fuel efficiencies
ICE and EV vehicle fuel efficiencies were based on data supplied by the Ministry of Transport. These
indicate that on a GJ/km basis, EV light private vehicles (LPVs, i.e. cars) are 3.65 times more energy
efficient than their ICE counterparts. This rises to 3.9 times more energy efficient for trucks.
19Part of this is due to the significant inherent differences in conversion efficiencies between a
combustion engine (approximately 30% efficient) and an electric motor (90% efficient, but affected
by losses associated with battery charging/discharging to give an overall efficiency of approximately
75 to 80%).
However, EVs can also ‘harvest’ a significant amount of additional energy from regenerative braking
(between 15 to 25% depending on the nature of the driving and vehicle – it tends to be greater for
heavier vehicles). In addition, EVs enjoy a significant advantage through consuming far less power
when the vehicle is moving slowly or stationery due to traffic – a material issue for urban driving.
Combined with the fuel price assumptions set out above, the fuel efficiency assumption result in EVs
having fuel costs which are approximately half that of ICEs per km travelled - excluding any costs
associated with emissions.
Vehicle lifetime distances travelled
MoT data was used to estimate the distance a vehicle would travel over its lifetime after entering
New Zealand. A central estimate of 215,000 km was used for a new light private vehicle entering
New Zealand, rising to 520,000 km for a new heavy truck entering New Zealand. Used vehicles
entering New Zealand were assumed to travel less over their lifetime on New Zealand roads,
reflecting their older age and the km of ‘useful travel’ already incurred overseas prior to entering
New Zealand.
Variations around these central values were used on a quintile basis to reflect the fact that some
vehicles travel further over their life than others.
MoT data was also used to project the extent to which the annual distance travelled by a vehicle
varies over its life. Thus, the distance travelled in the first year of a light private vehicle’s life was
assumed to be just over twice as much as in the 15th year of its life, with the pattern of this change
following a ‘reversed-S-curve’ type profile. Capturing this pattern of travel over a vehicle’s life is
considered important given that the costs and benefits of EVs reflect higher initial capital costs offset
by lower operating costs.
Maintenance costs
EVs have many fewer moving parts than ICEs, plus their operating environment is more benign
compared to the heat and pressure associated with a combustion engine. This results in materially
less wear-and-tear on an EV compared to an ICE, and thus lower maintenance costs.
Maintenance costs are assumed to increase proportionally to distance travelled, and vary between
cars and trucks – with trucks having a higher maintenance cost per km travelled.
The maintenance costs for EVs and ICEs for cars and vans have been based on the values produced
by EECA’s vehicle total cost of ownership tool and the AA’s information on vehicle ownership costs.
The relativities from this tool were cross-checked with relativities from a study examining similar
things in Canada.14
The values for ICE trucks have been derived from an Australian website (freightmetrics.com.au) with
proportional relativities between EVs and ICEs assumed to be the same as projected for vans by
EECA.
14
Source:
https://www.2degreesinstitute.org/reports/comparing_fuel_and_maintenance_costs_of_electric_and_gas_po
wered_vehicles_in_canada.pdf
20The resulting $/km maintenance costs for ICEs | EVs are as follows:
• Cars 0.028 | 0.016
• Vans 0.034 | 0.023
• Medium trucks 0.063 | 0.042
• Heavy trucks 0.092 | 0.062
These maintenance costs exclude tyres as these will be the same between EVs and ICEs. Instead
tyres are included within the category of ‘other’ costs which also include insurance, registration,
warrants, etc.
Even though these other costs are notionally the same between EVs and ICEs, we consider them
because for heavy trucks the productivity penalty (set out below) will cause the effective cost of
these other costs to be greater for EVs than ICEs.
Productivity penalties
Some EVs are considered to suffer a productivity penalty arising from being heavier in weight (due to
the weight of the battery), and due to longer away-from-base re-fuelling times.
For some vehicle situations, the fact that the battery makes the vehicle heavier makes no difference
to the vehicle economics. The principal example of this is light road vehicles (i.e. cars and vans), in
that owners of such vehicles incur no penalty due to the vehicle weighing more than its petrol/diesel
counterpart.
However, the heaviest category of trucks do incur a penalty due to there being an upper weight limit
of 44 tonnes for any vehicle. With this weight limit, 1 tonne extra of battery means that 1 tonne less
freight can be carried – meaning that a greater number of EV trucks are required to perform the
same freight transport service as ICE trucks. This weight penalty only applies to the heaviest
category of truck which only account for approximately 30% of fuel consumed by vehicles classed as
‘heavy’ in MoT statistics.
The other productivity penalty factor is due to the significantly longer time it takes to re-charge an
EV vehicle than it does to re-fuel an ICE vehicle. This is clearly not an issue for overnight charging of
EVs, but could be material for away-from-base recharging of EVs. Having an EV truck sitting
unproductively stationary while it is being recharged will tend to increase the effective number of EV
trucks required to perform the same freight service as ICE trucks.
The assumptions we have used to reflect this productivity penalty are the same as we used for our
hydrogen study.15 These assume that a productivity penalty will only really apply to the heaviest
class of trucks, with a 9% weight penalty and 9% re-charge-time penalty for vehicles purchased in
2019. The re-charge time penalty is considered to be conservative, and is assumed to decline to be
close to zero for vehicles purchased in 2040 as improvements in battery technology and cost (and
associated increase in range) will likely result in a significant reduction in the amount of away-from-
base recharging required for heavy trucks.
This combined 18% productivity penalty for EV heavy trucks purchased in 2019 increases the fuel,
capital and maintenance costs of EV heavy trucks by this amount. Further, it also increases the other
operating costs of operating a heavy truck (employing drivers, paying Road User Charges, insurance,
15
See: “A study of the potential economics of hydrogen technologies in New Zealand”, available for download
at www.concept.co.nz/publications
21tyres) by the same amount. As shown in Figure 11, these are significant – over twice the fuel
component of the lifetime costs of an ICE heavy truck.
Figure 11: Typical heavy freight TCO breakdown (diesel vehicle)16
Emissions costs
EVs are assumed to be completely zero emission vehicles in New Zealand, in that the increase in
demand to meet their uptake will predominantly be met by development of renewable power
stations such as wind.
In contrast, internal combustion engine vehicles are New Zealand’s largest energy-related source of
greenhouse gas emissions.
Tailpipe emissions from ICEs also give rise to human health costs. A 2012 study funded by the
Ministry of Transport and Ministry of Health17 estimated that such costs are responsible for
$1bn/year in adverse human health costs. This is principally due to the tiny particulates emitted,
with diesel vehicles emitting significantly more particulates than petrol vehicles.
We have apportioned this $1bn cost among diesel and petrol volumes consumed in NZ, weighted by
the proportion of PM10 particulates from these vehicles. This results in the $/litre health cost of
burning diesel to be 6.6 times that of burning petrol. We have further weighted this cost between
cars, vans, trucks and buses according to a simple estimate of the proportion of travel undertaken by
such vehicles in urban areas – noting that tailpipe emissions in rural areas have relatively little effect
on human respiratory health.
This results in ICE buses facing proportionately 10 times greater human respiratory health costs per
litre of fuel consumed than ICE heavy trucks, with ICE vans facing proportionately 5.1 times greater
costs than ICE heavy trucks. This is due to heavy trucks spending a far greater proportion of their
time (compared to buses and vans) on highways and rural roads than on urban roads.
16
Breakdown provided by one of New Zealand’s largest freight operators. ‘RUCs’ are Road User Charges.
17
“Health and air pollution in New Zealand”
22You can also read