An Audit, Assessment and Cost Analysis of Road Accident for Road Safety at Selected Stretch of NH-52 - ijsret
←
→
Page content transcription
If your browser does not render page correctly, please read the page content below
International Journal of Scientific Research & Engineering Trends
                                                Volume 5, Issue 3, May-June-2019, ISSN (Online): 2395-566X

     An Audit, Assessment and Cost Analysis of Road
   Accident for Road Safety at Selected Stretch of NH-52
       M.Tech. Scholar Juber Khan              Asst. Prof. Himanshu Bhardwaj               Prof. Dr. Bharat Nagar
                                                    Dept. of Civil Engineering
                                                      Jagannath University
                                                      Chaksu, Jaipur, India
                                                    juberkhan55@yahoo.com

Abstract -   Road traffic accident in India is taken as an event, not a evil event, it has a huge loss to country’s human, health
and economical crises. Road traffic accident have great impact on individuals, communities and nation. This is leading cause
for massive cost to frequent overburden healthcare system, productivity and prosperity with deep social and economic loss.
The natural causes are due to the act of god and cannot be prevented but on the other hand road accidents are caused by the
manmade environment and can be controlled WHO reports says that 1.24 million people suffered from road traffic accident
i.e. 3400 person daily worldwide, and it is 1st leading cause for death in 15 -29 years age person. More than 90% of accident
occurs in low-middle income countries, without any action it will leads to 1.9 million in 2030. In India, According to the
MORTH report, road accidents on National Highways, State Highways and Other Roads are 30.4%, 25.0% and 44.6%
respectively of the total road accidents. Reports also prevails that the number of accidents is more in rural area than urban
develop area. This study comprises of finding cost of accident with respect to social and economical loss of nation so that I
could give recommendations to minimize the risk and severity of accidents in study area, by analyzing the road safety features,
and accident analysis using data and various research for achieving “BARSIALS ZERO ROAD ACCIDENT VISION 2020”

Keywords- Road accident, Audit of Road, Road safety programs, Accident cost analysis, Zero road accident vision .

                I. INTRODUCTION                                     constitute the 8th leading cause of death for people of all
In developing country like India, road safety and accident          age in India in 2016 (IMHE; http://healthdata.org/india),
analysis is still at poor condition. Present condition the          and are the leading cause of health loss among young men
growth rate of population, vehicle and road traffic                 of age 15-49 years. Though the number of death pre ten
increasing tremendously shows that the problem is getting           thousand vehicles i.e., fatalities in India has declining
worse day by day. Accidents are increasing because there            continuously from 107.60 in 1970 to 5.98 in 2018, at the
is tremendously increase in the growth of population which          same time vehicle density increase from 1.18 in 1970 to
leads to increase in number of vehicles directly, which is          44.05 in 2018, but at the same time severity of road
directly proportional to the accident rate. This is now             accident increase marginally. The situation is still far from
proved that many developing countries face a serious road           satisfactory as compared to other countries. In India
traffic accident problem.                                           metropolitan cities have more road traffic accidents prone
                                                                    points as compare to other area of India with.
Road traffic accident rates in developing countries are high
in comparison to those in the developed countries                           II. NEED OF PRESENT STUDY
Worldwide, it is estimated that about 1.35 million deaths           A statistical study by MORTH on road accident for Indian
each year in road accident reported by a report of WHO              states shows that the state Tamil Nadu occupied 1st Rank
“Global Status Report on Road Safety 2018” whereas                  in country sharing the 14.1 % of total road accident.
approx 50 million people are injured in road accident each          Madhya Pradesh holds the 2nd rank in country by sharing
year. Almost 3 times higher death rate from these                   11.5% of total road accident and 3rd rank occupied by the
causalities happened in the low income and under                    Karnataka state. In this aspect of state ranked Rajasthan is
developing countries than developed countries. If the               at 9th place and share 22,112 accident out of total 420175
current scenario continues the road accident will provide           accident and has a share of total 4.8% according to last
the top 3rd provider of global burden of dieses and injury          year MORTH data these 50 cities. National Highways
by 2021. Today road accident injury is the one of the               being 2 % of the total road length of the India and account
leading cause of death in India. Road traffic injuries              for 36 % death of total accident in 2018.The remaining

                                                       © 2019 IJSRET
                                                             1322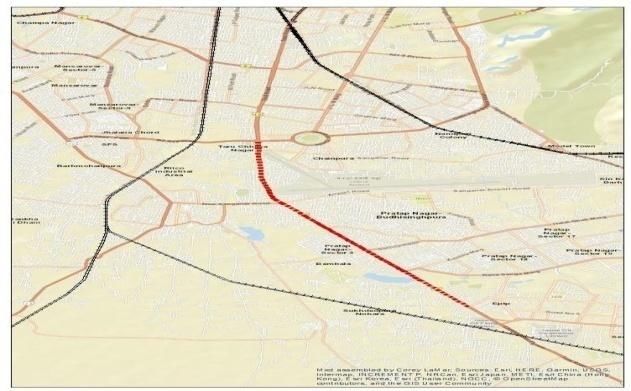
International Journal of Scientific Research & Engineering Trends
Volume 5, Issue 3, May-June-2019, ISSN (Online): 2395-566X
road networks, State Highways 3.1 %, and District Roads National highways. It is desirable to look into the causes
10 %, and Rural Roads 70.2 %, Urban Roads 9.1 % and and effects of road accidents to be carried out not only at a
Project Roads are 5.7 % of total road length. A total of macro-level but also at a micro-level.
4.76 lakh of road accidents have been reported by States
and Union Territories (UTs) in the calendar year 2018 III. OBJECTIVE OF STUDY
claiming 1.47 lakh lives and causing injuries to 4.70 lakh To identify and rectification of infrastructure, safety
persons. These figures translate, on an average, into 1274 measures, transportation facilities and factors of black
accidents and 405 deaths in a day. The statics says that 53 spots on a choose corridor contributing the road
accidents and 17 deaths happen every hour in the country. accident.
As shown by table below on an average National To analysis the previous accident records and gives
Highways contribute 30% of the total accident, while 25% suggestion for rescue and relief to reduce the traffic
by State Highway and 45 % of road accidents are causalities.
represented by Other Roads respectively in 2018. To find the cost of accident, with reference to social and
Table 1 Accident review of Jaipur & Rajasthan economic loss.
Year 2013 2014 2015 2016 2017 2018
Traffic
IV. SCOPE OF STUDY
To scope of study is to suggest remedial measures to
Various Cause of Death In
836 844 939 985.95 1054.97 1149.91
Accident
Total 2237 1702 3135 3323.1 3622.18 3911.95 alleviate the accident fatalities and injuries frequency
on such hazardous location, so can reduce the severity
Jaipur
% Total
Road 37% 50% 30% 30% 29% 29% of accident and finally safeguard the public health and
Accident economic loss of country.
CGAR of The study can provide us a map and database for causes
-31% 46% 6% 8% 7%
accident of sever and frequent road accident, useful for
government future policies and traffic law
According To Road Category For
National
6781.27 6991 6821 6567 6851 6988.02
Highway
State
V. LIMITATION OF STUDY
3698.52 3774 3638 3695 3368 3435.36 Accident data seem to provide information just as
Rajsathan
Highway
Other accurate as that in Govt records.
Road accidents are uncertain and unpredictable
- - 12804 11893 12249.8
Roads
Total 3698.52 10765 10459 23066 22112 22673.2
incidents and their analysis requires the knowledge of
CGAR of the various factors affecting them.
66% -3% 55% -4% 2%
accident
The absence of generalization of the conclusions to
other due to large variation at macro level.
Secondary source from government agency points that The study confine to micro level only, Average can
Jaipur city has road accident 1150 in 2018 as compare to apply to macro level.
total of 3912 death from natural and unnatural cause. In Financial aspects of the road infrastructure etc. would
Jaipur city 29% of the total accident by all causes is covered not be considered in this study.
by road accident only. Jaipur is having a growth of 7% in all
accident figures in recent years. The figure for road accident
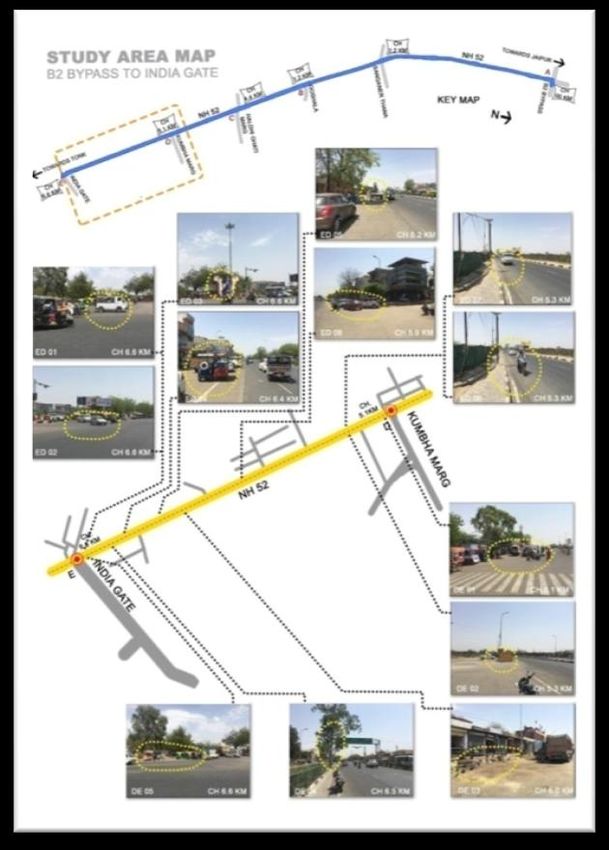
according to the categories of road in Rajasthan shows that VI. STUDY AREA
National Highway consist of 6988 fatalities of total , state The selection of study area is made on the basis of pattern
highway contribute to 15% of total accident reaming 12250 following on road accident in Jaipur city. Study area is
fatalities are recorded under the Other roads. The road selected by analyzing the previous data of road accident
accident according to road type shows a growth rate of 2% and trend of accident trend in city. The previous accident
in last year this huge data attract us towards the importance record concludes that NH-52 has large number of
of study the following Highways. accidental black spots as compared to other part of NH
system in Jaipur city. NH-52 as a part of Jaipur East
Report concludes that the severity of accident is high in comes under Sanganer police station. The stretch of 6.6
urban area, fatality rate are also more. According to NHAI Km of NH-52 has selected for assessment and audit for
report there are several Black spot on National Highways, accidental cost analysis. The selected study area
causing frequent accident on stretch. These points are originated from junction of two NH i.e. NH 52 and NH
frequent need to rectify. The above statement tells that the 248 also known as B-2 bypass circle and terminated at
percentage of road accidents on the National Highways is India Gate. This circle is also followed by the major
more than the other roads categories. So, the objective of arterial road in west side connects the city to NH. The
this study is to assessment of road accident data to find the study area originated from B-2 by pass Jaipur Centre Bus
causes and factors which contributing road accident on the Stand to India Gate Sitapura Industrial Area as a part of
NH-52. The map of study area is shown in figure below.
© 2019 IJSRET
1323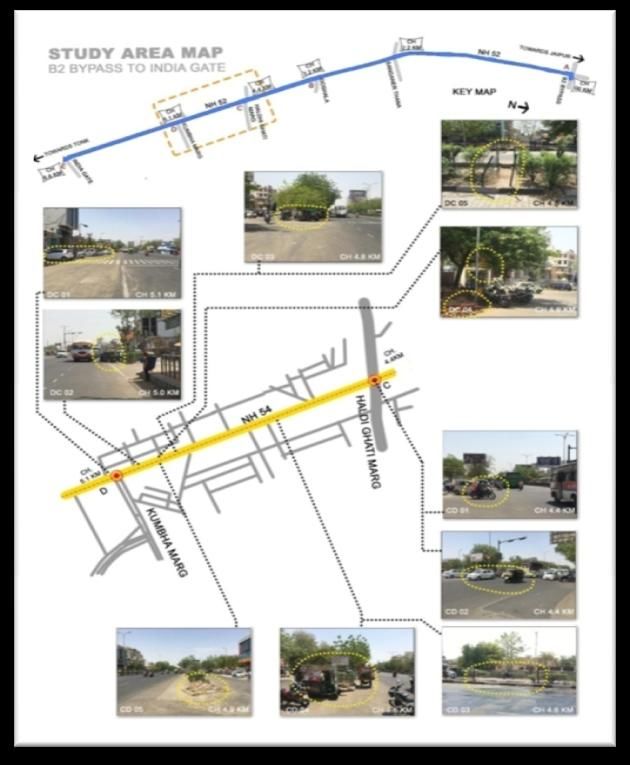
International Journal of Scientific Research & Engineering Trends
Volume 5, Issue 3, May-June-2019, ISSN (Online): 2395-566X
Table 2 The accident record according to fatalities and
number of death
S.No. Accident Police Road Year Number Of Number Of Number
Place Station Signage Accident Injured Of
Name Name KM Fatal Serious Major Minor Death
1. B–2 Sanganer 1.5 2015 7 7 4 2
Bypass 2016 5 10 9 - -
Circle 2017 13 5 2 3
2018 6 1 1 1
2019 5 1 2 1
2. Pinjrapol Sanganer 2 2015 4 - 2 4
Gaushala 2016 6 3 2 - 5
T-Point 2017 3 4 - -
2018 7 3 3 2
2019 6 2
3. Khumba Sanganer 2.5 2015 7 3 2 4
Marg 2016 4 6 4 1 -
Gate 2017 8 6 1 2
Crossing 2018 4 2 4 2
2019 2 1 1 3 7
Fig. 1 GIS image of Study Area 4. Haldi Sanganer 2.7 2015 6 5 - 3
Ghati 2016 3 4 2 - 1
Gate 2017 7 2 - 2
Crossing 2018 9 4 5 1
2019 4 2 3 9
5. India Sanganer 2.9 2015 7 5 1 5
Gate 2016 7 4 3 3 4
Crossing 2017 7 4 1 5
2018 2 2 - -
2019 3 1 1 5
VIII. METHODOLOGY OF STUDY
1. For Audit of Selected Stretch- The outcome of a road
safety audit is the identification of any road safety
deficiencies and formulation of recommendations aimed
at removing or reducing those deficiencies. Specific aims
Fig. 2 Close View of Study Area of RSA are:
To recognize the importance of safety in highway design
to meet the needs and perceptions of all types of road
VII. JUSTIFICATION OF AREA users, and to achieve a balance between needs of
SELECTION different road user types where they may be in conflict
The selected study area of NH-52 has previously defined with one another.
black spots by NHAI in 2016. The search agency NHAI To minimize the risk of accidents likely to occur on the
reported 5 black spots in short stretch of 6.6 Km. the project facility and on adjacent road and to minimize
black spot point‟s density define average of 1 black spot their severity.
per 1.5 km of stretch. The important Highways NH-52 of To reduce long-term costs of a project facility, bearing in
Jaipur city is taken under consideration according to mind that unsafe designs may be expensive or even
above statics. The statics shows that the observed 5 points impossible to correct at a later stage.
on NH-52 represent 45 number of accidents, having 27
To increase awareness about safe design practices
injured including major and minor. The death recorded on
among all those involved in the planning, design,
this stretch out of total accident are18 number. The death
construction and maintenance of roads.
rate for fatalities is showing more than 60% of total road
accident. The accident rate for last year 7.4% where as in
2. Method for Road Accident Cost Analysis:
2018 it come 5.54% which is approx 2% less than last
The “gross output” approach is used for calculation of
year figure but still average of road accident is increasing
accident cost, the considered cost are:
constantly. The accident record according to fatalities and
Coat of Fatalities
number of death is shown below in Table.
Cost of Serious Injuries
Cost of Major injuries
Cost Of Minor Injuries
Cost Of Damage To vehicle
Cost of Damage to Property
Methodology for cost analysis of accident includes
following.
3. For Fatal- A fatal accident is one in which one or
more people are killed as a result of the accident,
provided depth occurs within 30 days. This includes:
© 2019 IJSRET
1324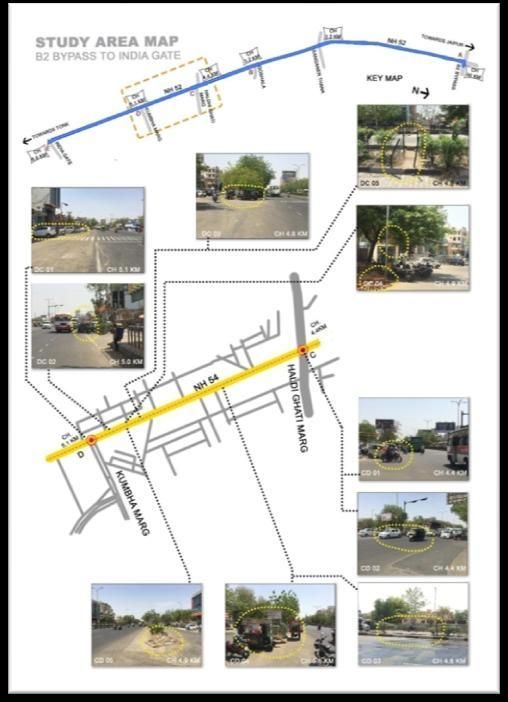
International Journal of Scientific Research & Engineering Trends
                                                Volume 5, Issue 3, May-June-2019, ISSN (Online): 2395-566X

Cost of fatal injured = Gross loss of future Output +                     Table 3 Key Parameter for Cost Analysis: For the
National value of pain, grief and suffering (%of gross                           Computation of gross Loss of Output
output loss) + Hospital Expenditure + Loss of earning                                                           Remark/
during Hospitalization + Lawyers‟ Fees + Surveyors Fees                   Parameter       Value Taken
                                                                                                              References
+ Administrative Expenses by police, Insurance                             Base year        2011-12
Companies and courts + Relatives costs.
                                                                                                               Specialized
4. For Serious and major accident: In case of serious or                                                 Working Group OF
                                                                         Discount rate        12%
major accident there are no deaths but one or more person                                                      Planning
are injured. A serious or major accident is defined as                                                       Commission
either for which a person is detained in hospital as an                                                          World
                                                                        Useful Life of
inpatient, or if any one of the following injuries are                                      62Years     Development Report
                                                                       Human Being
sustained whether or not he or she is detained in the                                                            2015
hospital- fractures, concussion, internal injuries , crushing             Per Capita                        Average of GDP
                                                                                              5.6%
,severe cuts and lacerations or severe general shock                  Income Growth                        Data for 5 years
requiring medical treatment.                                                                                  Directorate of
                                                                          Per Capita
                                                                                                           Economics and
                                                                      Income (Rs.) At      Rs.142870
Cost of a serious and major injury = Gross loss of future                                                      Statistics
                                                                     2011-12 Constant        INR
output + National value of pain , grief and suffering (% of                                                Government of
                                                                            Price
gross output loss) + Hospital Expenditure + Loss of                                                           Rajasthan
earning during Hospitalization and convalescence                                                           Based on previous
(recovery period) + Lawyers‟ Fees + Surveyors Fees +                     Inflation rate        8%
                                                                                                              years data
Administrative Expenses by police, Insurance Companies
and courts + Relatives costs.                                            Table 4 Factor Considered For Road Accident Costs
                                                                     Type Of Disabi Pain           Average       Average
5. For Minor Injured: A minor accident is one in which               Injury     lity      Grief    Hospitalizat Convalesc
there are no deaths or serious injuries but a person is                                   &        ion Period    ence
slightly injured. This will be an injury of minor nature                                  Sufferi                Period
such as a cut, sprain or bruise.                                                          ng
Cost of a minor injury = Compensation Awarded +
National value of pain, grief and suffering (% of gross                         As Percent of
output loss) + Surveyors Fees + Administrative Expenses                         Gross Output
of Insurance Companies + Relatives costs.                                       Lost
                                                                     Fatality   -        20%      8 Days         -
6. For Damage Only: Damage only accident is one in
                                                                     Serious    30%      50%      25 Days        100 Days
which no one is injured but damaged to vehicles and
property is sustained. The distinction between serious,              Major      15%      30%      15 Days        53 Days
major and minor injuries is carried out on the basis of
                                                                     Minor      -        1%       -               -
permanent disability factor. Accident victims with less
than 5 percent, between 5 percent and 20 percent and
more than 20 percent permanent disability values have                IX. INTERPRETATION OF RESULTS
been classified into minor, major and serious categories             1. Analysis of Audit Survey Report: Study Area Map
respectively.Cost of damages to vehicle = Repair charges             with Deficiency by Particular Stretch:
of the damage vehicles + Wages of the crew + Surveyors
Fees + Administrative expenses of Insurance Companies.

Total Cost of Road Accident = Injury Cost + Vehicle
Damage Cost. Where,
Injury Cost = Total Cost Of Fatal, Serious, Major and
Minor Injury.

                                                       © 2019 IJSRET
                                                              1325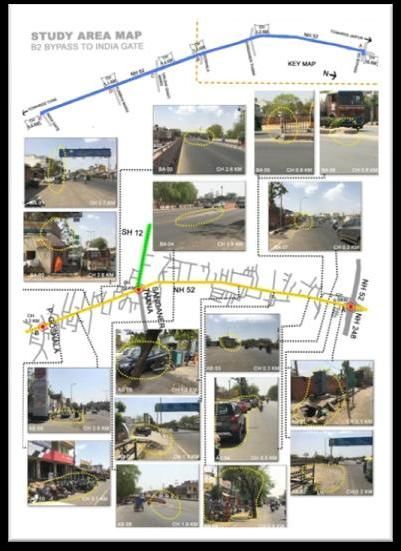
International Journal of Scientific Research & Engineering Trends
                                   Volume 5, Issue 3, May-June-2019, ISSN (Online): 2395-566X

                                                         Fig. 4 For Haldi Ghati Marg to Khumba Marg.

  Fig.2 For B-2 Bypass to Gaushala

                                                              Fig. 5 Khumba Marg to India Gate
Fig.3 For Gaushala to Haldi Ghati Marg

                                         © 2019 IJSRET
                                             1326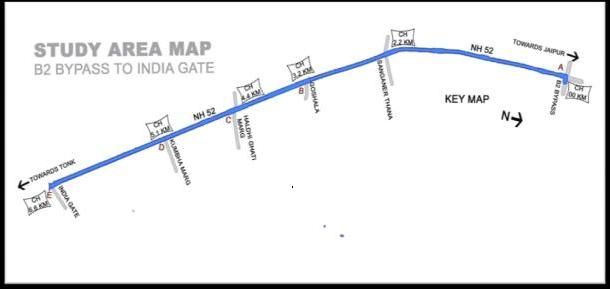
International Journal of Scientific Research & Engineering Trends
                                                 Volume 5, Issue 3, May-June-2019, ISSN (Online): 2395-566X

The physical examination of selected black spots is done                    3.2 Km        BC 01       Gaushala bus doesn‟t follow bus
for finding the causes why these points are black spots?                                                        stop guideline.
                                                                            3.5 Km        BC 02      Cut in between railing without any
The detail survey report of selected stretch is tabulated                                                         sign board.
below. The notations used in table are as follows: B2                       4.0 Km        BC 03        Informatory board and median
Bypass is named as „A‟ and at a chainage of 0.0.Km.                                                   covered by road side vendor. Slip
Gaushala is named as „B‟ and at a Chainage of 3.2 Km                                                line entry before stop line for Haldi
                                                                                                                    Ghati.
from B2 bypass towards Tonk city. Haldi Ghati is named                                    CB 03       Slip line encroached by furniture
as „C‟ at a chainage of 4.4 Km. Khumba Marg is named                                                                 shop.
as „D‟ and having chainage of 5.1. Km. India Gate is                                      CB 02      Court stay on slip line encroached.
named as „E‟ at a chain age of 6.6. Km measures from B-
2 bypass.                                                                   4.2 Km        CB 01         By pass to slip line close
                                                                                                              temporarily.
The notation used for defining the deficiency on stretch is                 4.4 Km        CD 01    Vehicle won't follow stop line traffic
shown by below figures each for particular stretch. Photo                                                         signal.
AB defines the photo taken from one side of two lane                                      CD 02
road to down ward side towards Tonk city whereas, BA
                                                                            4.6 Km        CD 03     Cut in between railing for pedestrian
define the another side of two lane road up side to Jaipur                                                    without marking.
city.                                                                                     CD 04     By pass to slip line before signal for
          Table 5 Conclusion from Audit Survey:                                                       left turning traffic encroached.
Chainage (Km)    Name Of         Discrepancies Identified                   4.8 Km        DC 03     Covered informatory board for slip
                 Photo In                                                                                            line.
                  Map                                                                     DC 05              Broken guard rail.
   0.0 Km          AB         B-2 Bypass Intersection and stop
                              line, Zebra crossing are not well             4.9 Km        DC 04    Encroached and covered informatory
                                           defined.                                                               board.
   0.1 Km         AB 01         Open drainage cover over the                              CD 05     Broken median and bus stop Pratap
                             footpath, followed by transformer.                                    Nagar sector 8 followed by garbage.
   0.2 Km         AB 02       Enlargement of road without any               5.0 Km        DC 02        Bus doesn‟t follow bus stop
                                     information board.                                                         guideline.
   0.3 Km         AB 03      Reduce in road length and merging              5.1 Km        DC 01    Khumba Marg T- Point RSRTC bus
                                          of traffic.                                                       booking counter.
                  BA 07         Improper railing on footpath                5.1 Km        DE 01     Road length encroached by vendor
                                                                                                              and parking.
   0.4 Km         AB 04       Road length encroached by parked              5.3 Km        DE 02        Road contracted at Culvert.
                                            vehicle.
   0.6 Km       BA 05, BA   Cut in median without marking, and                            ED 07       Wrong side 4 wheeler traffic at
                   06                      damage.                                                    culvert. From river front side to
   0.9 Km        AB 05       Cut in between railing near Sharma                                         Khumba Marg intersection.
                             juice centre and tree follow the road                        ED 08       Wrong side 2 wheeler traffic at
                                             line.                                                                culvert.
   1.2 Km         AB 06       Footpath encroached by Hyundai,               5.5 Km                              Culvert End.
                               Volvo, and Yamaha showroom.
   1.3 Km         AB 07       Footpath encroached and ramp of               5.9 Km        ED 06     Cut in median. Wrong side vehicle
                               Cad desk centre follow the road                                        moving towards Tonk for cut.
                                            margin.                         6.0 Km        DE 03    Broken railing and footpath followed
   1.9 Km         AB 08     No marking for bridge boundary and                                                by pedestrian.
                            no glow sign board for boundary for             6.2 Km        ED 05    Road encroached by parked vehicle.
                              night vision of bridge guard rails.
                  BA 04         Not properly marked island for              6.4 Km        ED 04      India Gate T- Point encroached.
                                        merging traffic.
   2.5 Km                   End of Bridge over Sanganer Thana               6.5 Km        DE 04    No information board for entrance to
                                                                                                         slip line before stop line.
   2.6 Km         BA 02     Road boundary followed by Temple.               6.6 Km        ED 01    Vehicle won't follow stop line traffic
                                                                                                    signal at India Gate intersection.
                  BA 03      No information board for turn over                           ED 02
                                         the bridge.
   2.7 Km         BA 01       Sign board fixed in the middle of                           ED 03        Traffic signals are covered by
                                            road.                                                    advertisement boards and Temple.
   2.8 Km         AB 09          Road margin and footpath                                 DE 05     Left turn to India gate is encroached
                             encroached by air pump of Indian                                                   by auto stand.
                                             Oil.
   3.1Km          AB 10      Road side and footpath encroached
                             by Honda R.L.Motors, R.K. build           2. Analysis of Cost Calculation
                                    state and Bank OB.
   3.7 Km         CB 04        Road line followed by tree and
                                           vehicle.

                                                           © 2019 IJSRET
                                                                     1327
International Journal of Scientific Research & Engineering Trends
Volume 5, Issue 3, May-June-2019, ISSN (Online): 2395-566X
Evaluation Of Road Accident Cost
for 2018-19
Age Group (Years) 0 – 20 20 - 30 30 – 40 40 - 50 50 - 60 60 -62
Average of Total
Average age (Years) 20* 25 35 45 55 61
T
Average Age of Future 42 37 27 17 7 1 o
Output (Years) t
1. Gross Loss a
of Future l
output: Discounted Value of 47.04 41.44 30.24 19.04 7.84 1.12 24.4533333
age (Years)
Annual Average income 114296 128583 142870 157157 171444 178587.5
Future Income Per 6021661.901 5967897.062 4838835.456 3351341.594 1505415.475 224020.16 21909171.6 895958
Fatalities
(A). For Fatal Relative's Cost 5010.235616 5636.515068 6262.794521 6889.073973 7515.353425 7828.493151 39142.4658 1600
Accident Loss of Earning
During 2505.117808 2818.257534 3131.39726 3444.536986 3757.676712 3914.246575 19571.2329 800
Hospitalization &
Recovery
Future Income Per 1806498.57 1790369.119 1451650.637 1005402.478 451624.6426 67206.048 6572751.49 268787
Injury
(B). For Relative's Cost 11742.73973 13210.58219 14678.42466 16146.26712 17614.10959 18348.03082 91740.1541 3752
Serious Loss of Earning 7828.493151 8807.054795 9785.616438 10764.17808 11742.73973 12232.02055 61160.1027 2501
Injury During
Hospitalization
Future Income 192579.8031 190860.3406 154751.6275 107179.8309 48144.95078 7164.4272 700680.98 28653
(C). For Major Per Injury
Injury Relative's Cost 1101.603288 1239.303699 1377.00411 1514.704521 1652.404932 1721.255137 8606.27568 352
Loss of Earning During 1001.457534 1126.639726 1251.821918 1377.00411 1502.186301 1564.777397 7823.88699 320
Hospitalization
Note : Annual Average income = 142870
* As age of Earning Is 20 Years
Average Age of Future Output = 62 - Average age
Discounted Value = Average Age of Future Output * 12 %
Per Capita Income = 2941 $ i.e. 142870 Rs
Per Capita Income Growth Rate = 5.6%
Average Mean consumption per annum =
Relative's Cost = Annual Monthly Income per day * Avg Number of relative stayed * Number of days
Loss of Earning During Hospitalization = Annual Monthly Income per day * Number of days
Note: Loss Of Future Output = Average Per capita Income - Average Mean Consumption
2. Evalution Of Injury Cost: For Accident
Adminstrative Expenses Of :
Loss of Earning During Hospital
Gross Output Cost Of Pain, Grief
Category Relatives Cost Hospialsation And Expenditure By Lawyers Fee surveyour fee Insurance
Loss And Suffering Court Office Police Station Total
recovery Victim Company
Fatality 895,958.49 ₹ 1,600.70 ₹ 800.35 ₹ 179,191.70 ₹ 104,400.00 ₹ 1,600.00 ₹ 1,100.00 ₹ 525.00 ₹ 3,750.00 ₹ 2,150.00 ₹ 1,191,076.24 ₹
Serious 268,787.55 ₹ 3,751.64 ₹ 2,501.09 ₹ 134,393.77 ₹ 113,100.00 ₹ 1,600.00 ₹ 1,100.00 ₹ 525.00 ₹ 3,750.00 ₹ 2,150.00 ₹ 531,659.06 ₹
Major 28,653.80 ₹ 351.95 ₹ 319.95 ₹ 8,596.14 ₹ 65,300.00 ₹ 1,600.00 ₹ 1,100.00 ₹ 525.00 ₹ 3,750.00 ₹ 2,150.00 ₹ 112,346.84 ₹
Minor - ₹ - ₹ - ₹ 14,287.00 ₹ 15,200.00 ₹ 1,600.00 ₹ 1,100.00 ₹ 525.00 ₹ 3,750.00 ₹ 2,150.00 ₹ 38,612.00 ₹
3. Evaluation of Cost of Vehicle Damage for each Category of Accident
Claim Cost
Repair Cost of
of Insurance
Vehicle Detention Period Other Losses Total
Company
26,000.00 ₹ 7,800.00 ₹ 1,250.00 ₹ 6,500.00 ₹ 41,550.00 ₹
© 2019 IJSRET
1328International Journal of Scientific Research & Engineering Trends
Volume 5, Issue 3, May-June-2019, ISSN (Online): 2395-566X
Total cost of Accident
(1+2+3)
2. Injury Cost of 3. Cost of vehicle Total Average Cost per
Category Accident Damage for Each Accident by Categories Average Cost per
Category of accident Accident
Fatality 1,191,076.24 ₹ 41,550.00 ₹ 1,232,626.24 ₹
Serious 531,659.06 ₹ 41,550.00 ₹ 573,209.06 ₹
Major 112,346.84 ₹ 41,550.00 ₹ 153,896.84 ₹ 509,973.54 ₹
Minor 38,612.00 ₹ 41,550.00 ₹ 80,162.00 ₹
Cost of Accident in study area in 2019
Cost of Accident Total Cost of
Accident At Pinjrapol Gaushala Khumba Marg Gate Haldi Ghati Gate India Gate
At B – 2 Bypass Total Accidents as per Average Accident as per
Points T-Point Crossing Crossing Crossing
Rate Average Accident
Fatality 6 6 3 6 3 24 12,239,364.84 ₹ 1,288,354.19 ₹
Serious 0 0 0 0 0 0 - ₹ - ₹
Major 3 2 4 3 2 14 7,139,629.49 ₹ 67,826,480.18 ₹
Minor 0 0 0 0 0 0 - ₹ - ₹
TOTAL 38 19,378,994.34 ₹ 2,039,894.14 ₹
AVERAGE 9.5 71,154,728.51 ₹
7,489,971.42 ₹
Total Cost of Accident
2018 Total Number of Average cost per accident Total Accident Cost
Accident
Jaipur 2191 509,973.54 ₹ 1,117,352,015.52 ₹
India 516734 509,973.54 ₹ 263,520,664,712.66 ₹
The total cost of gross output in terms of future gross loss to be Rs 1.1 million for fatal accident, whereas 5.31 lakh
of income come out to be Rs. 89 lakh for Fatality, 26 for serious injured person. The cost arrives for major
lakh for serious injured and 28 thousand for Major injured injured is 1.12 lakh per accident. The cost of accident for
while as there is no loss in future income in case of minor minor accident is 38.6 thousand Rs for an accident.
accident. As we calculate the relative cost as per number
days during hospitalization and number of persons The cost of vehicle damage from above discussed factors
accompanied him. This cost arrive Rs 1600 3751, and 351 i.e., including claim cost of insurance company, Repair of
Rs for Fatality serious, major and minor accident cost of vehicle and detention period of driver and vehicle
respectively. is also considered in vehicle cost factors. 15% of cost of
vehicle claim cost is also considered for other factors
The loss of earning during hospitalization by patient is which are not included in cost and are discussed in
calculated by per day income of patient and time spent by methodology. The total cost of vehicle comes out to Rs
him in hospital. This cost come to Rs 800, 2501 and 319 41,550. Hence the total cost of accident including
rupees per accident for Fatalities, serious and major accident cost and vehicle cost on an average come out to
accidents respectively.Cost of pain and grief is taken as Rs.5 lakh Rs per accident on an average. The cost of
20, 50, 30 and 1 percent of the gross output loss. This accident for selected stretch in 2018 for an average of
value comes out to Rs 1.7 lakh, 1.34 lakh, 8.5 thousand Total accident 9.5 comes out to Rs 7.4 million Rs on an
and 14.2 thousand for fatality, sever, minor and major average of total accident cost an average of total accident.
accident respectively. Hospital expenditure, Lawyers fee
and Surveyor‟s fee and administration expenses of The total cost of accident for Jaipur city in 2018 for total
insurance company court office and police station are accident of 2191 comes out to Rs.11.1 billion Rs on an
taken as per rate describe in table. Hence after concluding average rate this mentioned have to bear by the society
all the above rates the total cost of only accident come out and economy of country. The total cost of accident for
© 2019 IJSRET
1329International Journal of Scientific Research & Engineering Trends
Volume 5, Issue 3, May-June-2019, ISSN (Online): 2395-566X
India by adopting 5.1 lakh accident on an average come to Medical facilities should be made available to the
Rs 2635.3 billion Rs on an average. The GDP of India is accident victim by providing medical centres on highways
750 Billion $ it means 140780 billion Indian rupees as at regular intervals.
2019. This accident cost shows on an average of 1% of
GDP of India. This 1% loss is for society and for REFERENCES
economy of country. The cost arrives for Jaipur city data [1]. “Road Traffic Accident Analysis And Prediction
at micro level could be applied to Macro level by Model: A Case Study of Vadodara City”-international
applying some factors. research journal of engineering and technology
(IRJET) e-issn: 23950056 (2018).
X. CONCULUSION [2]. “Transportation Cost and Benefit Analysis II”, Safety
Results of the study on accident cost and survey on and Health Costs Victoria Transport Policy Institute,
selected stretch. It has been observed that the causes of 2018.
accident are mainly due to encroachment and geometric [3]. “Global Status Report On Road Safety” ,World Health
alignment of road. Organisation, 2018.
Data revels that people unaware of road safety rule are [4]. “Roads safety: basics facts”, World Health
most prone to road accident. Organisation, 2017.
The analysis from accident data shows that more [5]. “Road accident study on some areas in Yangon”-
pedestrians are suffered in road accident than vehicle international journal of trend in scientific research and
user. development (IJTSRD) ISSN no: 2456- 6470, 2017.
It is seen that the cost to national economy for an [6]. “National road safety policy”- government of India
accident is twice the cost of investment on road system. 2017.
[7]. Report “Road Accident in India 2017” Ministry of
Comparison of cost revels that fatality per 10,000
Roads and Transportation Highways.
vehicles is 4 in developed country as compare to 28 in
[8]. “Rural road safety manual- promoting safer
India.
connectivity in rural India” (NRRDA), ministry of
The cost of accident on an average comes out to be Rs.
rural development, GOI (2016).
509,973 for an accident.
[9]. “Road Accident Black Spot In Jaipur”, National
The cost conclude from the above result are more than Highway Authority of India, 2016.
average expenditure on preventing measures and road
[10]. “Road Length in the State Road Development”
safety awareness. Data.Gov.In, March 2016.
[11]. “Policies and programs for road safety in developing
XI. RECOMMENATION India”- journal of emergencies, trauma and shock
The road accident analysis is illustrating significance pmcid: pmc2700566, (2015).
via monetary equivalent for policy maker. [12]. “Master development plan 2025” Jaipur region, 2015.
Govt should allocate more funds for laying well- [13]. “The Methodology for Calculation of Road Accident
conditioned road and repairs of roads. Costs”, Dept of Automobile Transport, Vilnius
Encourage people to use more public transport facility. Gediminas Technical University, Vilnius, Lithuania,
The government should enforce the rule and regulation publisher Taylor & Francis, 2015.
and should be improved and strictly enforced in study [14]. “Road safety: resources”- world health organization
area. (who) 2015.
License issuing system, training and vehicle fitness [15]. “Social Cost of Road Traffic Crashes in India”
should be maintained properly. Transportation Research and Injury Prevention
Pedestrian safety can be enhanced by: applying 3E‟s. [16]. Programmed, Indian Institute of Technology, New
Engineering, Enforcement and Education. Delhi, 2014.
Accident awareness programs may be conducted by the [17]. “Population of India”, from Census of India 2011
insurance agencies. [18]. Dheeraj N Kumar, Dheeraj N Kumar “Road Safety
Audit” IOSR Journal of Mechanical and Civil
Provision of separate pedestrian facilities like footpath,
Engineering IOSRJMCE, 2012.
fencing, pedestrian signal and Zebra crossing etc.
[19]. “Economic analysis of road accident cost for Chennai
The Highway appurtenances for night vision such as
City, India”, St. Peters College of Engineering and
declinators for roadway indictor, Hazard markers and
Technology, 2013
object marker are not provided. Traffic aid posts for
[20]. Rokhshad Hejazi, Abdul Rahim, Zelina Zaitun Ibrahim
National highway and major arterial road is not
Mad Nasir Shamsudin, Alias Radam, Khalid & Saeed
properly arranged.
Yazdani “Estimation of traffic accident costs: a
Highway safety design system such as, road sign, road prompted model”, publisher Taylor & Francis, 2013.
marking and traffic signals are not proper as Indian [21]. Research paper “The National Road Safety Policy”,
standard code. Central road research institute (CRRI), 2010.
© 2019 IJSRET
1330International Journal of Scientific Research & Engineering Trends
Volume 5, Issue 3, May-June-2019, ISSN (Online): 2395-566X
[22]. Elangovan Arunbabu, Ranganathan Rani
Hemamalini, & Pachaivannan Partheeban, “Road
accident cost prediction model using systems
dynamics approach”, Transport(2008).
[23]. Report of the committee on “road safety and traffic
management”, by planning commission, government
of India- 2007.
[24]. “Road Safety Audit Manual”, The Republic Of
Uganda, Ministry Of Works Housing And
Communications, Road Development Program Phase
2 Projects, 2005.
[25]. “Road Accident Models for Large Metropolitan
Cities of India”, Central road research institute
(CRRI), 2004.
[26]. “World Report on Road Traffic Injury Prevention”,
World Health Organization, Geneva, 2004.
[27]. “Analysis of accident cost and comparison with
available research”, Rochester Institute of
Technology, NY, 2002.
[28]. “Traffic Accident Cost Analysis”, Chintha
Jayasinghe, University of Moratuwa, 2001.
[29]. “Accident in India, Registered Vehicle In India”,
GOI Website data.gov.in, C.Jayasinghe, Ratnayake
L.L., Report submitted to Road Safety Secretariat,
“Research report on accident costs", 1999.
[30]. “Motor transport statistics of India”, Ministry of
surface transport. New Delhi, 1996-1998.
[31]. Minter, A.L. Road casualties‟ improvement by
learning processes, “Traffic Engineering & Control”
1987.
[32]. Dinesh Mohan, An analysis of road traffic fatalities
in Delhi, India, “Accident Analysis & Prevention”
1985.
[33]. R.J.Smeed “Variations in the pattern of accident rates
in different countries and their causes”, Traffic
engineering & Control, 1968.
[34]. Hakkert, A.S. & Livneh, M., Some factors affecting
the increase of road accidents in developing
countries, with particular reference to Israel.
“Accident Analysis & Prevention Israel” 1972.
[35]. R.J.Smeed, “Some statistical aspects of road safety”,
Journal of Royal Statistical Society, 112 CX11, Part
1-Series 4, 1949.
[36]. “Growth Rate And Economic Analysis” Census And
Economic Information Centre‟ of India,2018
[37]. “Population of Jaipur City” District Census
Handbook of India, 2011.
[38]. “GDP of Jaipur and Economic Analysis”, Directorate
of Economics and Statistics Government of
Rajasthan. 2018.
[39]. “Data of Accident, Road Length”, MORTH
Transport Research Wing, Ministry of Surface
Transport.
[40]. Rahul Kumar Chandel, Anuj Jain, Nitin Nagarwal,
Nishant Yadav, Kavish Bhat IS journal Of “Economy
Of Money Saving” 2018.
© 2019 IJSRET
1331You can also read