Do single Pollard transects represent the local butterfly community? A case study from the Spitzberg near Tübingen, Germany
←
→
Page content transcription
If your browser does not render page correctly, please read the page content below
Insect Conservation and Diversity (2020) doi: 10.1111/icad.12437

Do single Pollard transects represent the local butterfly
community? A case study from the Spitzberg near
Tübingen, Germany
THOMAS K. GOTTSCHALK                                     Department of Regional Management, University of Applied Forest Sciences,
Schadenweilerhof, Rottenburg, Germany

                                       Abstract. 1. Information on butterfly population size and distribution is a key tool
                                       for verifying species conservation status. Such data are rare and tend to be available
                                       on local rather than on regional scales. One important data source are monitoring
                                       schemes that have been implemented in several countries, e.g. the German butterfly
                                       monitoring scheme (TMD).
                                          2. The main goal of the present study was to examine how representative single tran-
                                       sects of the TMD are able to identify local or regional diversity patterns of butterflies.
                                       Total butterfly population size, density of individuals and species diversity pattern of a
                                       624 ha large study area (Spitzberg) were recorded by intensive surveys.
                                          3. Almost all butterfly species present at the Spitzberg were recorded by the TMD
                                       transects. For 22 species, local estimates based on records of the TMD transects ranged
                                       between 0 and 10% of the regional population size. Accordingly, the study demonstrates
                                       that population size changes of most of the species can potentially be identified.
                                          4. Increasing cover of forest has a negative effect on species diversity and butterfly
                                       density, while the cover of nutrient-poor grassland and the diversity of biotope types
                                       has a positive impact on butterfly density and species diversity. Solar insolation has a
                                       positive effect on butterfly density.
                                          5. Based on the results of the species–habitat relationships, the location of TMD tran-
                                       sects could be optimised by aiming to cover the complete butterfly diversity of the study
                                       area. Additionally, monitoring of some of the species might be improved if winter sur-
                                       veys of eggs and larvae were implemented in the monitoring scheme.
                                       Key words. Burnet moth, butterfly density, butterfly population, diversity of biotope
                                       types, solar insolation, species distribution, species diversity, Spitzberg, winter surveys.

Introduction                                                               information on butterfly communities and their local population
                                                                           size. The advantages of these schemes are that they provide
Data on butterfly population size and distribution provide impor-           information on the number of individuals of all species during
tant information for ecological studies to verify their conserva-          a complete season and that these data are typically collected for
tion status and to develop conservation strategies to halt                 several years or even several decades. Another advantage is that
population declines. Although data on butterflies are readily               year-to-year changes, so typical for insect populations (Roy
available, surveys on butterflies are very time consuming when              et al., 2001; Mason et al., 2018), can be recorded by such
information on the whole butterfly community of larger study                long-term monitoring schemes.
areas is needed. In many European countries, butterfly monitor-                The disadvantage is that monitoring data are restricted to a
ing schemes (van Swaay et al., 2008) are the sole source of                narrow transect, often 5 m in width and usually a few 100 m
                                                                           long. Extrapolating information obtained from such a transect
                                                                           to larger areas may be possible in homogeneous landscapes but
  Correspondence: Thomas K. Gottschalk, University of Applied Forest       is certainly limited in landscapes characterised by small-scale
Sciences, Schadenweilerhof, D-72108 Rottenburg, Germany. E-mail:
                                                                           biotope changes. In such a case, trends detected may only be
gottschalk@hs-rottenburg.de

© 2020 The Author. Insect Conservation and Diversity published by John Wiley & Sons Ltd on behalf of Royal Entomological Society. 1
This is an open access article under the terms of the Creative Commons Attribution License, which permits use, distribution and reproduction in
any medium, provided the original work is properly cited.
2   Thomas K. GOTTSCHALK

representative for the areas sampled, while their extrapolation to     largest part is covered by woods, including the heights and the
the whole region may produce biased results. Furthermore, data         northerly slopes. The forest is characterised mainly by Scots pine
sets collected from such relatively short transects are usually too    (Picea sylvestris), oak (Quercus spec.) and beech (Fagus sylva-
small to be used for species habitat analyses or to estimate factors   tica). A total of 103 butterfly and burnet moth species have been
controlling species presence or population size. Therefore, large-     reported from the Spitzberg since 1850, of which 69 species were
scale studies are needed. Such an approach was exemplarily con-        still present in 2016 (Gottschalk & Komrowski, 2017). To analyse
ducted at the Spitzberg close to Tübingen, Germany, a study area       species–habitat relationships, the study area was divided into
of 623 ha in size. Within this area, two fixed transects (BW-           128 raster cells 250 × 250 m in size (Fig. 1).
7419-01 and BW-7419-02), 450 m and 600 m in size, were estab-
lished on which butterflies and burnet moths have been recorded
since 2015 and 2017, respectively. Both transects are part of the      Species survey
German butterfly monitoring scheme, referred to as TMD for
“Tagfalter-Monitoring Deutschland” below (Kühn et al., 2008;              Butterflies and burnet moths were counted using standardised
Kühn et al., 2014). As is the case in most European countries,         line-transect counts (Pollard, 1991) in 2018. To ensure an equally
observers are free to choose the location of the transects (van        distributed survey effort within the whole study area, the area
Swaay et al., 2008). Hence, the transects do not record all habitats   was divided into 37 rasters 500 × 500 m maximum in size. Butter-
of a region and they are not chosen randomly or in a stratified ran-    flies were recorded along transects of 5 m width covering all 37 ras-
dom manner, as has been done, e.g. by the German common bird           ter cells. One complete survey of the study area was conducted per
census (Sudfeldt et al., 2012) or the wider countryside butterfly       month between March and October 2018. Most species were iden-
survey (Brereton et al., 2011). The advantage of such schemes,         tified directly in the field by observation, a few species by catching
where the location has been chosen at the discretion of the            and using a field book (Settele et al., 2015) or by taking photo-
observers, is that they yield more data on rare butterflies, as they    graphs (and determining the species based on these photographs
are typically located in areas of good quality habitat (van Swaay      afterwards). The sibling species Leptidea sinapis and
et al., 2008; Roy et al., 2015).                                       L. juvernica and Colias hyale and C. alfacariensis were treated
   The main aim of the current study was to examine how repre-         as one species, as they are virtually indistinguishable and can only
sentative single transects of TMD are able to identify regional        be distinguished by analysing their caterpillars (Colias) or by mor-
diversity patterns of butterflies and to find out whether they have      phometric analysis of their genitalia (Leptidea). All butterfly obser-
the potential to identify diversity changes. Here, diversity was       vations were logged using a GPS device (Garmin Oregon 700) to
used throughout to refer to species richness, i.e. the number of       record the exact location of each observation. In addition, two tran-
species observed. The results of the two transects were compared       sects of 400 and 650 m length were located in the south-west
with results of systematic counts of butterflies and burnet moths
within the whole Spitzberg area (624 ha). The aim of the study
was to assess which species are not recorded by the monitoring         Table 1. Percent cover of 19 biotope types within the 624 ha large
scheme and to identify those species whose population sizes can-       study area and within a 2.5 m buffer around the two line-transects of
not be represented properly by the TMD. While monitoring               the TMD.
schemes are aimed at identifying population changes, they
                                                                                                                 Study              TMD
hardly provide the data needed to analyse the causal relation-
                                                                             Biotope types                       area (%)            (%)
ships for such changes on a local or regional scale. Therefore,
the aim of this study was also to identify factors controlling spe-    1     Arable fields                         4.0                 4.3
cies diversity, the number of Red List species and the butterfly        2     Lucerne                              0.3                 —
density (i.e. density of butterflies and burnet moths).                 3     Boundary ridge                       0.03                —
                                                                       4     Wetland                              0.01                —
                                                                       5     Grassland                            9.8                24.9
Material and methods                                                   6     Nutrient-poor grassland              2.1                36.0
                                                                       7     Vineyard                             1.8                 1.5
                                                                       8     Orchards                            11.9                 1.3
Study site                                                             9     Single tree, bush                    0.2                 1.8
                                                                       10    Tree, bush                          12.3                 7.2
   The Spitzberg in Baden-Württemberg (SW Germany) is located          11    Deciduous forest                    26.4                11.9
between the city of Tübingen in the east and Rottenburg-               12    Deciduous forest along forest        5.3                 —
Wurmlingen in the west, an area of about 6 × 2 km                             tracks
(Gottschalk, 2019a). The highest point is the Kapellenberg near        13    Mixed forest                        14.7                0.4
Wurmlingen with a height of 475 m. The Spitzberg consists of           14    Mixed forest along forest tracks     2.0                —
Keuper rocks, mainly gypsum-bearing shales, colourful marls            15    Coniferous forest                    2.3                —
and pebble sandstone and originates from the Triassic era about        16    Coniferous forest along forest       0.4                —
                                                                              tracks
149 million years ago. On the southern and western slopes of this
                                                                       17    Forest edge                          1.1                 8.1
old cultivated landscape, the forest has been almost completely        18    Roads                                1.8                 2.6
cleared and replaced by a large number of terraces with dry stone-     19    Urban area                           3.3                0.04
walls and nutrient-poor grassland and orchards (Table 1). The
© 2020 The Author. Insect Conservation and Diversity published by John Wiley & Sons Ltd on behalf of Royal Entomological Society.,
                                                                       Insect Conservation and Diversity, doi: 10.1111/icad.12437
Regional patterns of butterfly diversity 3
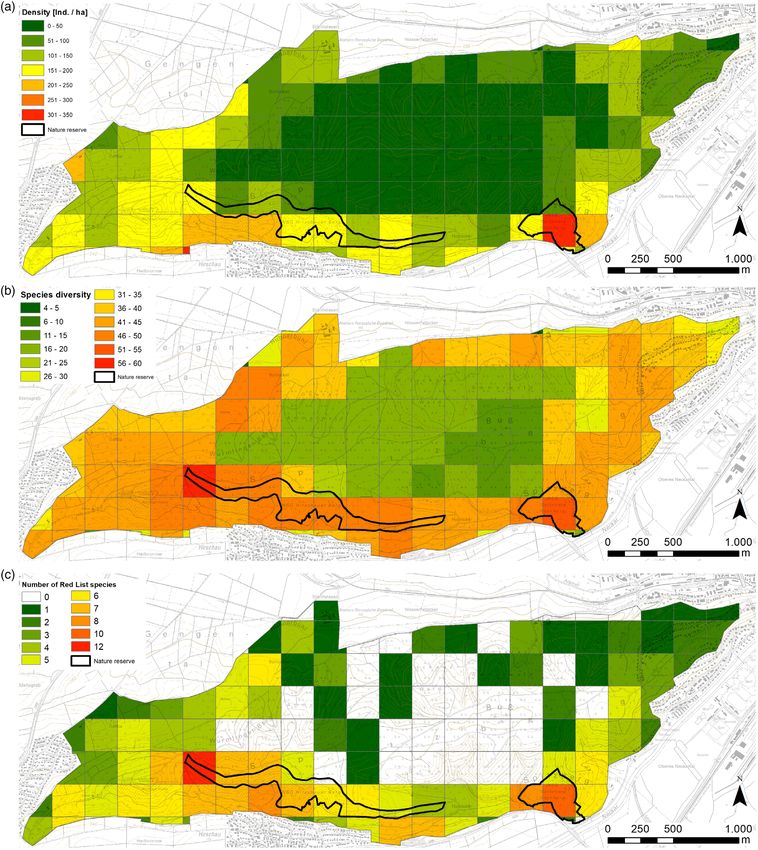
Fig 1. Topography of the Spitzberg, the location of the 37 raster cells (red lines) used to control sampling effort, the 128 raster cells (black and red lines)
used for species habitat analyses and the location of the two transects T1 and T2 shown in black, where butterfly monitoring was conducted following the
TMD standards. Transects shown in blue are potential additional transects to better represent butterfly population changes of the Spitzberg. [Color figure
can be viewed at wileyonlinelibrary.com]
(T1) and north-west part (T2) of the Spitzberg (Fig. 1). The tran- the study area were excluded from the analysis of species–
sects were sampled following the standards of the TMD scheme habitat relationships. For each species, the total population size
(Kühn et al., 2014). Butterflies and burnet moths were recorded was estimated for (i) the whole study area and for (ii) the two
once per week between 5 March and 26 October; accordingly, TMD transects. The estimated population size of the two tran-
the total walked length on both transects was 27 km. In this study, sects was based on the total number of counts. In order to esti-
the maximum number of individuals seen during one of the tran- mate the population size for the whole study area, all walked
sect walks per raster was used for further analysis of butterfly den- transects were buffered with 2.5 m on each side using a GIS.
sity. This was done for pragmatic reasons, although other life- Then, the maximum number of butterfly and burnet moth obser-
history traits (Nylin, 2009) for species survival and population sta- vations within this 2.5 m buffer were used to calculate the num-
bility are important (e.g. the number of generations per year, the ber of individuals of each species and biotope. These densities
number of individuals of the last generation or the generation were used to estimate the population size for the complete study
length within a season). In addition, it was not possible to use dis- area and per cell. The estimates of the population sizes might be
tance sampling (DS) or capture-mark-recapture methods (Isaac biased, e.g. by uncertainties in the biotope map which can be
et al., 2011; Pellet et al., 2012) to account for intraspecific variation caused by an unclear boundary of two adjacent biotope types,
in detectability and to reach absolute abundance estimates. DS uncertainties of the mapped GPS locations affected by atmo-
could not be considered, as key assumptions were violated (ran- spheric conditions and tree cover, or differences in the detection
domly placed transects) and butterflies at the Spitzberg are too probabilities of species between biotopes. In order not to give a
numerous and too quick to accurately estimate distance estimates false sense of accuracy, the population size was rounded to the
(Isaac et al., 2011). Capture-mark-recapture methods require closest 100 for species estimated with more than 500 individuals
intense effort, which was not possible in view of the huge number and to the closest 10 for species estimated with less than
of species involved in this study. As several species are known to 500 individuals.
be better detected using their preimaginal stages during the cold Relationships between the number of individuals of all species
half of the year (Hermann, 2007), eggs and caterpillars of species per raster cell and seven different environmental variables were
of the genus Apatura, Favonius, Limenitis, Satyrium and Thecla analysed using a generalised linear model (GLM), with a loga-
were searched for in all 37 raster cells during the winters rithmic link function and Poisson error distribution. To avoid
2017/2018 and 2018/2019, following the recommendations of multicolinearity, only variables that were not strongly correlated
Hermann (2007). This survey was not conducted on the TMD tran- (i.e., r < |0.7|) were considered for modelling (Fielding & Haw-
sects. The total length of all transects walked within the study area orth, 1995). From groups of correlated variables, only the vari-
in 2018 amounted to 650 km (Supporting Information Fig. S1). able with the most straightforward ecological interpretation
was maintained. A second-order polynomial of all predictor vari-
ables was included to account for possible non-linear or humped
Species–habitat analyses responses. Variable selection followed the corrected Akaike
information criterion (AICc) to ensure that models were exclu-
Species–habitat relationships were analysed on 128 raster sively built on meaningful information and to avoid overfitting
cells (Fig. 1). Cells with a size4 Thomas K. GOTTSCHALK
Table 2. Butterfly and burnet moth species recorded at the Spitzberg near Tübingen in 2018.
Individuals Estimated Abundance Raster % Red List
Scientific name counted population size (%) frequency (%) TMD (%) status
Maniola jurtina 3457 11 500 19.6 100.0 20
Melanargia galathea 2787 8200 14.0 57.8 28
Polyommatus icarus 1573 3900 6.6 72.7 14
Colias alfacariensis/ 1101 1600 2.7 69.5 22
hyale
Boloria dia 854 2100 3.6 47.7 22
Pieris rapae 664 2200 3.7 75.0 7
Lasiommata megera 646 1400 2.4 72.7 9
Coenonympha pamphilus 572 2400 4.1 74.2 17
Pieris napi 508 2800 4.8 100.0 6
Argynnis paphia 500 2700 4.6 70.3 5
Aphantopus hyperantus 351 2000 3.4 96.1 12
Aglais io 345 1000 1.7 98.4 14
Cupido argiades 313 900 1.5 71.9 26
Polyommatus bellargus 309 500 0.9 41.4 40 3, 3
Coenonympha arcania 250 1100 1.9 46.9 19
Ochlodes sylvanus 244 1100 1.9 93.0 5
Gonepteryx rhamni 239 1000 1.7 97.7 16
Zygaena filipendulae 216 800 1.4 70.3 41
Anthocharis cardamines 205 1100 1.9 97.7 11
Leptidea sinapis/ 203 1000 1.7 73.4 13
juvernica
Aglais urticae 179 500 0.9 86.7 41
Brintesia circe 175 280 0.5 33.6 4 1, 3
Issoria lathonia 137 390 0.7 78.9 11
Araschnia levana 133 700 1.2 90.6 2
Thymelicus lineola 127 1000 1.7 65.6 20
Polyommatus coridon 125 290 0.5 52.3 34
Erynnis tages 115 340 0.6 63.3 23
Polygonia c-album 108 500 0.9 91.4 17
Celastrina argiolus 106 410 0.7 85.9 5
Aricia agestis 105 270 0.5 61.7 31
Lycaena phlaeas 92 190 0.3 59.4 18
Papilio machaon 88 180 0.3 56.3 10
Pieris mannii 86 230 0.4 52.3 2
Limenitis camilla 84 (204) 200 0.3 77.3 8
Vanessa atalanta 83 230 0.4 80.5 2
Pararge aegeria 76 350 0.6 80.5 1
Polyommatus semiargus 72 220 0.4 51.6 14
Nymphalis polychloros 57 200 0.3 53.9 2 2, V
Pieris brassicae 47 220 0.4 78.1 19
Thymelicus sylvestris 45 400 0.7 64.8 38
Thymelicus acteon 40 230 0.4 26.6 20 V, 3
Vanessa cardui 36 130 0.2 46.9 31
Argynnis adippe 32 70 0.1 28.1 19 3, 3
Zygaena viciae 25 30 0.1 3.1 52
Polyommatus thersites 21 30 0.1 10.9 19 3, 3
Satyrium w-album 20 (28) 40 0.1 12.5 5
Zygaena loti 20 30 0.1 4.7 60 V, 3
Satyrium pruni 16 (27) 50 0.1 7.8 38
Carcharodus alceae 15 (60) 70 0.1 32.0 6 3, −
Satyrium acaciae 15 (23) 40 0.1 8.6 0 3, V
Favonius quercus 14 (110) 110 0.2 39.8 14
Zygaena ephialtes 13 20 0.0 6.3 15 V, 3
Callophrys rubi 12 20 0.0 6.3 8
Zygaena transalpina 12 20 0.0 1.6 75 3, 3
(continued)
© 2020 The Author. Insect Conservation and Diversity published by John Wiley & Sons Ltd on behalf of Royal Entomological Society.,
Insect Conservation and Diversity, doi: 10.1111/icad.12437Regional patterns of butterfly diversity 5
Table 2. (continued)
Individuals Estimated Abundance Raster % Red List
Scientific name counted population size (%) frequency (%) TMD (%) status
Apatura iris 11 (44) 20 0.0 17.2 9
Thecla betulae 10 (304) 440 0.7 60.2 10
Carterocephalus 9 10 0.0 6.3 67
palaemon
Colias crocea 7 10 0.0 4.7 0
Lycaena tityrus 6 10 0.0 3.1 0
Pyrgus malvae 6 10 0.0 5.5 17
Cupido minimus 4 10 0.0 1.6 25
Melitaea cinxia 4 10 0.0 5.5 50 2, 3
Apatura ilia 2 10 0.0 4.7 0 3, V
Aporia crataegi 1 0 0.0 0.0 0
17 728 58 700
The number of individuals counted within the transects, the estimated population size and the relative abundance of each species for the total study area are
shown. The numbers in brackets are the number of counted eggs (C. alceae, F. quercus, S. acacia, S. pruni, S. w-album and T. betula) or caterpillars (L.
camilla and A. iris). Raster frequency shows the percentage of rasters in which the species were recorded. The column “% TMD” shows the proportion of
individuals recorded at the two TMD transects compared to the total number of all individuals counted at the Spitzberg. Red list status on the national scale
(first number) and at the state level (last number) is presented in the last column.
and the highest AICc weights were considered to be best transect locations, a small number of transects were chosen,
(Burnham & Anderson, 2002). Additionally, competing models exemplarily. These additional transects were selected by count-
(i.e. ΔAICc6 Thomas K. GOTTSCHALK
Fig 2. (a) Butterfly density, (b) species diversity and (c) number of Red List species at the Spitzberg near Tübingen, Germany. [Color figure can be
viewed at wileyonlinelibrary.com]
richness showed a pattern similar to that of the butterfly density. of the study area (Fig. 2b). Species richness was also high in
Lowest numbers were recorded in the central part, comprising the west and in the north-west.
between 14 and 20 species. Highest numbers with more than Thirteen species found are red-listed for Germany
50 species were observed in the south-west and southern part (Reinhardt & Bolz, 2011) and/or the state of Baden-
© 2020 The Author. Insect Conservation and Diversity published by John Wiley & Sons Ltd on behalf of Royal Entomological Society.,
Insect Conservation and Diversity, doi: 10.1111/icad.12437Regional patterns of butterfly diversity 7
Table 3. Relative effects of variables on the three response variables analysed, calculated using a GLM. Estimates were obtained from the analysis of z-
transformed data in order to make them comparable between predictors measured in different units.
Number of species Number of Red List species Butterfly density
Estimate Std. Error P-value Estimate Std. Error P-value Estimate Std. Error P-value
Intercept 3.625 0.0538 Thomas K. GOTTSCHALK
The TMD failed to record Apatura ilia, Aporia crataegi, Colias in species composition can be classified into three groups. One
crocea, Lycaena tityrus and Satyrium acaciae. About 19% of the butterfly group comprising 11 species (Apatura ilia, Apatura
total butterfly population was recorded by the TMD. iris, Araschnia levana, Argynnis paphia, Celastrina argiolus,
For 22 species, the number of individuals counted on the two Limenitis camilla, Nymphalis polychloros, Ochlodes sylvanus,
transects covered less than 10% of their total population of the Pararge aegeria, Satyrium w-album and Vanessa atalanta) is
Spitzberg (Table 2). more closely associated with or is more abundant in forest habi-
TMD transects could be extended by an expansion of TMD tats. The current transect locations touch but do not traverse for-
transects T1 or T2 (additional length 250 m each) or using the ests. Furthermore, the occurrence of Apatura ilia, Apatura iris,
additional transects T3 (length: 700 m), T4 (length: 700 m) or Limenitis camilla and Satyrium w-album, as well as the non-
T5 (length: 800 m) (Fig. 1). An expansion of T1 and T2 forest species Satyrium acaciae is better recorded by searching
would better represent butterfly population and species rich- for their eggs and larvae, as they have reasonably conspicuous
ness by seven and six species (Supporting Information egg or larval stages, which can be counted with greater success
Table S1). T3 and T5 would better represent butterfly popula- than flying adults (Hermann, 2007). The location of eggs and lar-
tion and species richness, as 9 and 10 species on each transect vae might also be biologically more meaningful for species
would be better represented, respectively. Nevertheless, the occurrence than that of adults (Nowicki et al., 2008). At the
best option would be T4, as this transect would cover 16 of Spitzberg, the number of detections of these species was
those species that were not properly represented by the cur- increased on average by a factor of 6.7 compared to the number
rent TMD transects. of adults counted. Currently, the TMD design as well as most
European butterfly schemes (van Swaay et al., 2008) do not
involve winter surveys for butterflies. Winter surveys of butter-
Species response to environmental variables flies could be included and standardised, as has been done for
Thecla betulae in Britain (UK Butterfly Monitoring
Model accuracy depicted by percent deviance was quite high Scheme, 2020).
and amounted to 70.0 for the Red List species, 72.5 for all spe- A second group of butterflies, including Aporia crataegi,
cies and 84.8 for butterfly density (Table 3). Brintesia circe, Callophrys rubi, Carcharodus alceae, Colias
The response of butterfly density, number of species and num- crocea, Lycaena tityrus, Pieris mannii and Satyrium w-album,
ber of Red List species to environmental variables showed quite contains species that are less common at the Spitzberg or are
similar patterns (Table 3; Fig. 3). An increase in the cover of for- restricted to specific and restricted habitats. For example,
est had a negative effect on the number of species and the num- Lycaena tityrus is a rare species of the Spitzberg and has only
ber of Red List species if the cover exceeded 40%. Butterfly been recorded at moist grasslands in the northern part, where
density was strongly negatively affected without a peak at 40% Rumex spec., the host plant of the species, is more common.
forest cover. All response variables were positively associated Carcharodus alceae and Pieris mannii are more common in pri-
with an increase in percent cover of nutrient poor grassland. vate gardens in the southern part of the Spitzberg, where their
Cover of protected areas showed a strong effect on the number host plants Iberis spec., Eruca versicaria and Malva spec. are
of species. More than 20% cover was negative for the number present. Yet, as such gardens are usually fenced, it is difficult
of species and the number of Red List species, and more than to include them in a regular TMD scheme. Rare species would
30% was negative for butterfly density. All three response vari- be better recorded by species-specific surveys in which specific
ables showed a positive effect in response to an increase in the habitats or the larval host plant are searched for during the
number of biotope types and an increase in standard deviation expected flight period. Most traditional butterfly monitoring
of the altitude. Solar insolation had a strong positive and altitude schemes in Europe are not designed to cover these species (van
a negative effect on butterfly density. Swaay et al., 2008), as recording of all rare species is time con-
suming and cannot be standardised. A third group, including
Lasiommata megera, Pieris napi and Pieris rapae, reached rea-
Discussion sonable numbers on the TMD transects, but these species are
even more common at other sites of the Spitzberg. This is
The present study documents that the two TMD scheme transects because the TMD transect routing in 2018 did not represent the
appear to be correctly placed, as they managed to capture 92% of same proportion of biotope types as are present in the total study
species richness and 19% of the total butterfly population. This area (see Table 1). This resulted in a different distribution of spe-
was achieved by 4.2% of the total sampling effort taken cies and individuals. Biodiversity monitoring surveys can be
(27 km versus 650 km walked transects for the whole Spitz- flawed if they are not adjusted statistically before being initiated
berg). Yet, for 22 species, the population size estimated on the (Archaux & Bergès, 2008). To do so, the two characteristics sen-
two TMD transects covered less than 10% of the total butterfly sitivity (absolute change detected) and blindness (failure to
and burnet moth population, or less than three individuals per detect change in a species) can be optimised using the proper
species were observed. The TMD failed to detect five butterfly scale (Critchley & Poulton, 1998) and aiming to represent all
species that were recorded on other parts of the Spitzberg in biotope types of a region. Exemplarily, the results show how
2018. This suggests that the selected transects of the TMD might the current TMD transects could be optimised by additional tran-
not be able to detect all potential changes of butterfly populations sects to better represent the butterfly population and species
for the Spitzberg. The species-specific reasons for the difference richness.
© 2020 The Author. Insect Conservation and Diversity published by John Wiley & Sons Ltd on behalf of Royal Entomological Society.,
Insect Conservation and Diversity, doi: 10.1111/icad.12437Regional patterns of butterfly diversity 9 Results on species–habitat relationships on a regional scale Anthocharis cardamines, Apatura ilia, Limenitis camilla, Nym- can show how strong environmental factors drive species distri- phalis polychloros, Polygonia c-album, Polyommatus semiargus bution and butterfly density and can be used to reconsider tran- and Satyrium w-album are known to be more common on less sect locations. Number of biotope types, percent cover of sunny or warm locations (Settele & Reinhardt, 1999). forest, and nutrient-poor grassland are the most important drivers of butterfly diversity. More than 40% forest cover led to a decrease in the number of butterfly species. These findings are Conclusion well known, as a huge number of butterfly species prefer open sunny habitats and are strongly influenced by increasing forest The study provides evidence that percent cover of forest, number cover (Clench, 1966; Munguira et al., 2009; Herrando of biotope types and solar insolation are the most important et al., 2016). Species associated with forest habitats usually pre- drivers of butterfly diversity patterns in the focal area. Many spe- fer open woodland, glades, clearings, wide road verges or forest cies would benefit from an increase in open habitats and from a edges (Streitberger et al., 2012; Bubová et al., 2015). Seventy- reduction of forest biotope types, especially on slopes exhibiting five years ago, such habitat structures were common in the forest high solar radiation values. The study demonstrates that the cur- of the Spitzberg (Gottschalk, 2019b), but due to management rent transects were able to detect most butterfly species of the changes 13 butterfly species have already been lost within these study region and therefore are able to indicate possible regional forests (Gottschalk & Komrowski, 2017). All response variables biodiversity changes. In order to optimise the sensitivity, TMD showed a positive response to nutrient-poor grassland. This con- transects should be relocated or augmented based on information firms known responses of many insect species (Di Giulio on biotope type, solar radiation and topographic variability. et al., 2001; Dolek & Geyer, 2002; Bubová et al., 2015), includ- TMD standards should be supplemented by including winter sur- ing butterflies, which avoid fertilised grasslands (Öckinger veys of preimaginal stages in order to obtain data on elusive or et al., 2006). Fertilisers enhance the growth of annual grasses low density species, which are often hard to count in their imago at the expense of annual forbs and can crowd out the larval host stage. plants of butterflies (Weiss, 1999). The number of species and the number of individuals show a negative response to an increasing cover of protected areas. The Acknowledgements strong negative response between more than 20% and 30% cover of protected areas is reasonable, as the protected areas of the The author gratefully thank Heiko Hinneberg and Angelina Mat- Spitzberg include 50% forest habitats and 7% bushland tivi for statistical advice and Jana Niedermayer, Heiko Hinne- (Gottschalk, 2019b), which are both unsuitable to most butterfly berg, Thomas Bamann and Nora Magg for conducting the species. This result indicates that the management of the pro- fieldwork on the TMD transects during the weeks in which I tected areas should be revised, aiming towards a stronger promo- was not able to walk them. Three anonymous reviewers, Gregor tion especially of Red List butterfly species. Yet, in the light of Markl and Heiko Hinneberg provided very helpful comments on species conservation, this aspect urgently needs further investi- earlier versions of the manuscript. The permission to study the gation, including other study areas. protected butterfly species within the two nature reserves was All response variables respond positively to an increase of granted by the regional council of Tübingen in accordance with biotope types. A high diversity of biotopes are known to support German law. Open access funding enabled and organized by a high species diversity not only for butterflies but also for many Projekt DEAL. insects, reptiles and birds (Weibull et al., 2000; Fuller et al., 2004; Diekötter et al., 2008). Density of butterflies does not show such a strong positive response to number of biotope Conflicts of interest types, which results from the fact that some species occur in large numbers in a small number of specific biotopes. In fact, 33% of The author declare that he has no conflict of interest. all individuals recorded at the Spitzberg were contributed by Maniola jurtina and Melanargia galathea. Highest numbers of these two species were counted on a few grassland types. Supporting information All response variables showed a positive effect in response to an increasing standard deviation of the altitude. Higher values are dis- Additional supporting information may be found online in the played by areas with high topographic variability, which is a Supporting Information section at the end of the article. known estimator of plant species richness in hilly or mountainous landscapes (Hofer et al., 2008). Areas of high plant species rich- Figure S1: Walked transect to record butterflies and burnet ness might offer a higher number of nectar and host plants for but- moths at the Spitzberg between March and October 2018. All terflies (Steffan-Dewenter & Tscharntke, 1997). Butterfly density transects were tracked using a GPS (Garmin Oregon 700). responds positively to solar insolation, which is a known driver Table S1: Butterfly and burnet moth species recorded at the of thermoregulation in butterflies (Wickmann, 2009). Number of Spitzberg near Tübingen in descending order according to the species and number of Red List species do not show such a number of individuals counted in the complete study area in response. This can be explained by the fact that several species 2018. The numbers of individuals counted on the two transects do not benefit from high solar insolation values. For example, T1 and T2 in the years 2015–2019 are also shown. T2 was not © 2020 The Author. Insect Conservation and Diversity published by John Wiley & Sons Ltd on behalf of Royal Entomological Society., Insect Conservation and Diversity, doi: 10.1111/icad.12437
10    Thomas K. GOTTSCHALK

sampled in 2015 and 2016. The last five columns show the num-                   Gottschalk, T. (2019b) Landnutzungs- und Landschaftsveränderungen.
ber of individuals on potential additional TMD transects. The                     Der Spitzberg(ed. by T. Gottschalk), pp. 409–427. Jan Thorbecke,
numbers of individuals shown in these columns are lower com-                      Ostfildern.
pared to T1 and T2, as these transects were not visited on a                   Gottschalk, T.K. & Komrowski, A. (2017) Landnutzungsveränderun-
                                                                                  gen am Spitzberg bei Tübingen und ihre Auswirkungen auf Tagfal-
weekly basis.
                                                                                  ter und Widderchen. Naturschutz und Landschaftsplanung, 49,
  Table S2: Competitive models (ΔAICc
Regional patterns of butterfly diversity 11 between monitoring schemes. Journal of Insect Conservation, 19, in Deutschland - Programme und Anwendungen. Bundesamt für Nat- 313–324. urschutz, Bonn. Roy, D.B., Rothery, P., Moss, D., Pollard, E. & Thomas, J.A. (2001) UK Butterfly Monitoring Scheme (2020) Brown Hairstreak monitoring Butterfly numbers and weather: predicting historical trends in abun- guidance, Vol. 2020, [accessed 01 June 2020]. Settele, J. & Reinhardt, R. (1999) Ökologie der Tagfalter Deutschlands: van Swaay, C.A.M., Nowicki, P., Settele, J. & van Strien, A.J. (2008) Grundlagen und Schutzaspekte. Die Tagfalter Deutschlands(ed. by J. Butterfly monitoring in Europe: methods, applications and perspec- Settele, R. Steiner, R. Reinhardt and R. Feldmann), pp. 60–123. Ulmer tives. Biodiversity and Conservation, 17, 3455–3469. Verlag, Stuttgart. Vaughan, I.P. & Ormerod, S.J. (2005) The continuing challenges of testing Settele, J., Steiner, R., Reinhardt, R., Feldmann, R. & Hermann, G. species distribution models. Journal of Applied Ecology, 42, 720–730. (2015) Schmetterlinge - Die Tagfalter Deutschlands. Ulmer Verlag, Weibull, A.-C., Bengtsson, J. & Nohlgren, E. (2000) Diversity of butter- Stuttgart. flies in the agricultural landscape: the role of farming system and land- Steffan-Dewenter, I. & Tscharntke, T. (1997) Early succession of butter- scape heterogeneity. Ecography, 23, 743–750. fly and plant communities on set-aside fields. Oecologia, 109, Weiss, S.B. (1999) Cars, cows, and checkerspot butterflies: nitrogen 294–302. deposition and management of nutrient-poor grasslands for a threat- Streitberger, M., Hermann, G., Kraus, W. & Fartmann, T. (2012) Modern ened species. Conservation Biology, 13, 1476–1486. forest management and the decline of the Woodland Brown (Lopinga Wickmann, P.-O. (2009) Thermoregulation and habitat use in butterflies. achine) in Central Europe. Forest Ecology and Management, 269, Ecology of Butterflies in Europe(ed. by J. Settele, T. Shreeve, M. Konvička 239–248. and H.v. Dyck), pp. 55–61. Cambridge University Press, Cambridge. Sudfeldt, C., Dröschmeister, R., Wahl, J., Berlin, K., Gottschalk, T., Grüneberg, C., Mitschke, A. & Trautmann, S. (2012) Vogelmonitoring Accepted 7 July 2020 © 2020 The Author. Insect Conservation and Diversity published by John Wiley & Sons Ltd on behalf of Royal Entomological Society., Insect Conservation and Diversity, doi: 10.1111/icad.12437
You can also read