Churn Prediction in New Users of Yahoo! Answers
←
→
Page content transcription
If your browser does not render page correctly, please read the page content below
Churn Prediction in New Users of Yahoo! Answers

                               Gideon Dror, Dan Pelleg, Oleg Rokhlenko, Idan Szpektor
                                                 Yahoo! Research, Haifa, Israel
                                      {gideondr, dpelleg, olegro, idan}@yahoo-inc.com

ABSTRACT                                                          include advice requests, opinion seeking and social requests.
One of the important targets of community-based question          Some examples of such question are:
answering (CQA) services, such as Yahoo! Answers, Quora              • “my tamale dough is kinda sticky and soft and won’t
and Baidu Zhidao, is to maintain and even increase the num-            float, what should I do? ”
ber of active answerers, that is the users who provide answers
to open questions. The reasoning is that they are the en-            • “if legalizing gay marriage does lead to a slippery slope,
gine behind satisfied askers, which is the overall goal behind         how will that affect you? ”
CQA. Yet, this task is not an easy one. Indeed, our empir-           • “am I pretty (here’s a link to my photos . . . )? ”.
ical observation shows that many users provide just one or
                                                                     Community-based question answering (CQA) services were
two answers and then leave.
                                                                  introduced exactly for meeting these very personal needs.
   In this work we try to detect answerers that are about
                                                                  Services like Yahoo! Answers, Quora, Baidu Zhidao and
to quit, a task known as churn prediction, but unlike prior
                                                                  Naver Ji-Sik-In allow any user to ask any question and any
work, we focus on new users. To address the task of churn
                                                                  user to answer any of the open questions in the system. One
prediction in new users, we extract a variety of features to
                                                                  of the important goals of CQA services is to maintain and
model the behavior of Yahoo! Answers users over the first
                                                                  even increase the size of their active answerer community.
week of their activity, including personal information, rate
                                                                  After all, these are the users who provide the answers to
of activity, and social interaction with other users. Several
                                                                  arriving questions and thus make the whole participation in
classifiers trained on the data show that there is a statisti-
                                                                  the service, that is asking a question from the asker’s side,
cally significant signal for discriminating between users who
                                                                  worthwhile. In this work we focus on retaining already ac-
are likely to churn and those who are not. A detailed feature
                                                                  tive users. Specifically, we would like to identify users who
analysis shows that the two most important signals are the
                                                                  are about to quit, a task known as churn prediction [12, 15,
total number of answers given by the user, closely related
                                                                  5, 10, 13, 18, 9]. Success in this task will open new possibil-
to the motivation of the user, and attributes related to the
                                                                  ities for the site, for example focusing efforts on these users
amount of recognition given to the user, measured in counts
                                                                  to continue using the service.
of best answers, thumbs up and positive responses by the
                                                                     The main reason for retaining users is that the cost of
asker.
                                                                  acquiring new customers is higher than the cost of keep-
                                                                  ing existing customers [15]. In CQA services, it is hard to
Categories and Subject Descriptors                                convince users to start answering questions, or even visit
H.3.5 [Online Information Services]:                              the web-service for the first time. Thus, it is important to
                                                                  keep users who already actively answer questions in the sys-
                                                                  tem. Yet, there are differences between classic industries
General Terms                                                     with known customer attrition problems, such as telecom-
Algorithms, Experimentation                                       munications and banking, and CQA services. One such dif-
                                                                  ference is that once a user subscribed to a mobile service or
                                                                  a credit card company, she will remain a subscriber for a
Keywords                                                          while (several weeks or more), due to the amount of energy
churn prediction, community question answering, online user       put into the subscription process itself. In CQA services
behavior                                                          however, it is very easy to subscribe and start answering
                                                                  questions. Indeed, the user answering activity graph (Fig-
                                                                  ure 1) obeys the power law distribution, which means that
1.    INTRODUCTION                                                many answerers contribute one or two answers and leave the
  While search engines achieved remarkable results in the         system never to return. Following this observation, in this
last two decades, there are still types of information needs      work we target the prediction of churn in new users, since
that are difficult to answer through traditional search. These    converting even a small fraction of soon-to-be churners into
                                                                  active answerers will substantially increase the size of the
                                                                  answerer community.
Copyright is held by the author/owner(s).                            In this paper we focus our analysis on Yahoo! Answers,
ACM X-XXXXX-XX-X/XX/XX.                                           which is the one of the largest CQA sites, with hundreds of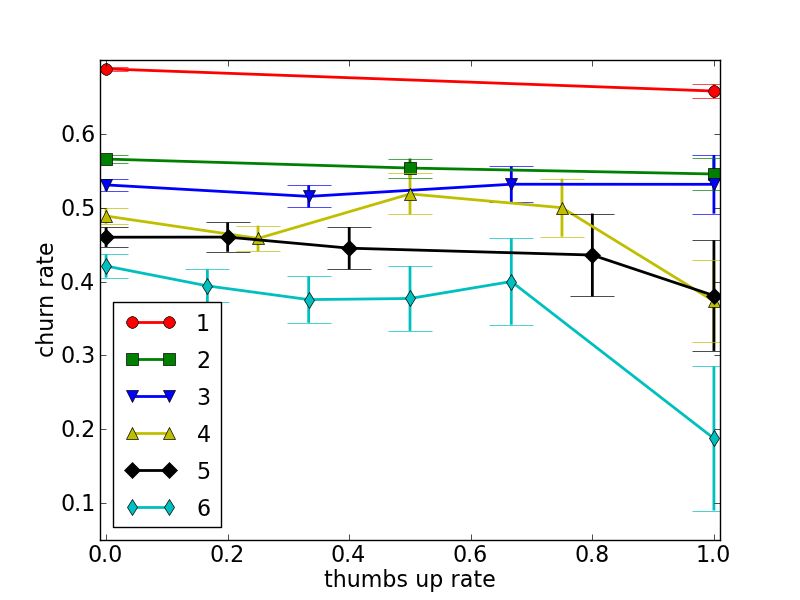
Figure 1: Histogram of the length of participation                   Figure 2: Histogram of the number of answers per
period per user measured in week (log-log scale).                    user (log-log scale), for the users who left on the first
                                                                     week (“quit”), vs. the users who continued past the
                                                                     first week (“stay”).

millions of questions and over a billion answers over several
years of site activity. To address the task of churn prediction
in new users, we collect a variety of features that model the
behavior of users over the first week of their “life” as answer-     around the wireless telecommunication industry [6, 12, 15,
ers. These features include personal information, such as age        7, 4, 5, 14, 16, 18]. Yet, other domains were studied as well,
and gender, activity modeling, such as answering time and            including banking [11, 13], grocery retail [2], pay TV [3],
answering rate, and social relationships with other users, as        online gaming [10], P2P networks [17] and social networks
well as asker-answer communication. We show that each of             [8, 9].
these aspects contribute to better churn prediction in Ya-              The main approach for churn prediction is to construct a
hoo! Answers. To the best of our knowledge this is the first         set of features for each user and train a classifier or regressor
work to study churn prediction in CQA sites, as well as the          for the task [6, 12, 15, 7, 4, 14, 18, 11, 13, 2, 3, 10, 17, 8,
first work to study churn prediction in new users.                   9]. Some features are related to the service and are inde-
                                                                     pendent of the user, such as call quality, billing, customer
                                                                     service and pricing [12, 15], and may be utilized to model
2.    BACKGROUND                                                     a prior on churn likelihood in the service at a given time.
                                                                     To distinguish between users, user-dependent features are
2.1    Yahoo! Answers                                                introduced. These may include information about the users
   Yahoo! Answers is a question-centric CQA site. Askers             independent of the service, such as age, gender and salary [4,
post new questions and assign them to categories selected            13]. Other features measure user activity within the specific
from a predefined taxonomy, such as Sports > Golf. A ques-           service, such as minutes-of-use, frequency-of-use and past
tion consists of a title, a short summary of the question, and       renewals of service in telecommunications [4, 15], the num-
a body, containing a detailed description of the question.           ber of transactions in banking [13] and session length and
The posted question remains “open” for four days and can             inter-arrival time in P2P networks [17]. These features are
be answered by any signed-in user. The asker may choose a            time-dependent and are captured per specific time-frames.
best answer while the question is open, and even optionally          A different type of user behavior was studied in [7], ana-
provide feedback for the best answer in the form of a one to         lyzing the differences in complaint and repair calls between
five rating and a textual message. If the asker did not make         churners and non-churners. Finally, induced social features
a choice for best answer, the community votes for it. Once           were investigated by [9], including in and out degrees of the
a best answer is chosen, the question considered “resolved”.         user node in the social network based on replies in a discus-
   In case a question is not answered while “open” it is “deleted”   sion board, popularity, closeness and betweenness centrali-
from the site. A question or answer may also be deleted if           ties etc.
it is detected as spam or if it was found offensive or other-           A complementary approach to modeling independent user
wise not following the site’s rules. On top of this, a question      behavior is to model the effect of social ties between users.
may be deleted by the asker herself, for example if a very           The main hypothesis in this approach is that users that leave
personal question was asked and the asker is not willing for         a service may influence other users, with whom they have
the question to be publicly available once a suitable answer,        social relationships, to leave as well. [5] model such influ-
which satisfied his/her need, arrived.                               ence as diffusion processes of churn in the social graphs,
                                                                     showing improvement in churn prediction. [10] combine in-
2.2    Related Work                                                  dividual player engagement with diffusion-based influence,
  The prediction of churn has been extensively studied for           where both positive (retention) and negative (churn) influ-
over over a decade. Most research on user retention revolved         ence are taken into account. [16] propose that users leave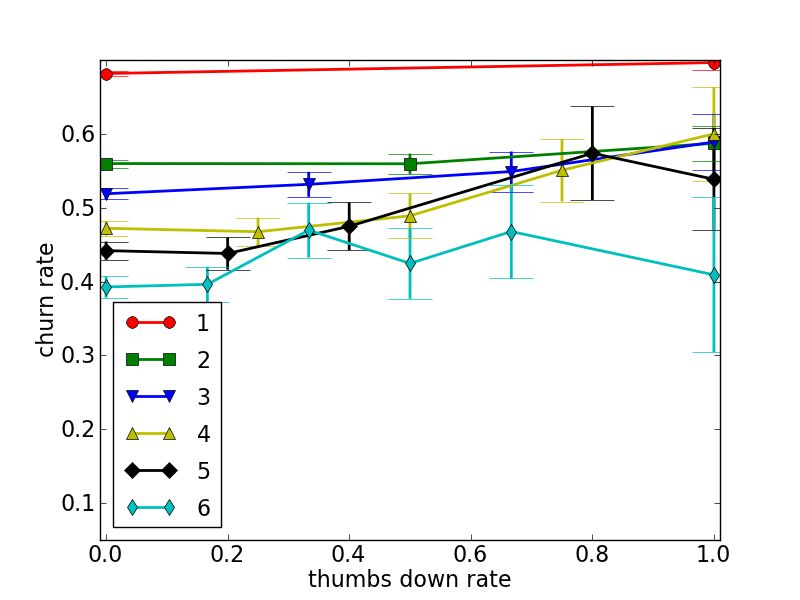
in groups, and detect dense social group in which leaders of
the group may cause the whole group to leave the provider. Table 1: Features by type
Question features (33 total)
Past work on churn prediction focused on active users,
• cat xxx: of questions answered in each of the 27 top-level YA
with at least several weeks of documented activity. How- categories. e.g. ”cat 396546089”.
ever, in community-based question answering, many users • qlenw: the average length of the questions in words
are early churns, that is, they provide one or two answers • qlenc: the average length of the questions in characters
• deleted count: the number of questions the user answered that
and leave without returning to the CQA site, as shown in were deleted
Figure 1 for Yahoo! Answers. Some of these users are just • deleted avg: the fraction of questions the user answered that
anecdotal visitors, that do not intend to continue using the were deleted
• q num answers avg: the average of number of answers, taken
service. Still, other users, who planned on using it, decide over the questions this user answered.
to give up on the service very early for some reason. If even • nstars avg: the average number of stars for the questions an-
a small fraction of these early quitters could be convinced swered.
to continue and use the service, the number of active users Answer features (10 total)
will increase substantially. Hence, unlike prior work, in this • nanswers: the number of answers submitted
paper we focus on predicting churn in new users, specifically • anslenc: the average answer’s length in characters
within their first week of activity. • anslenw: the average answer’s length in words
• ansnumurls: the average number of URLs per answer
• frac active: the fraction of time intervals in which user ques-
tions were posted
3. EXPERIMENTAL SETUP • yday: day in year (1-365)
To collect the data, we studied the answer-posting activity • month: month (1-12)
• mday: day of month (1-31)
of users on Yahoo! Answers between April and December of • wday: day of week (1-7)
2010. For each user, we aggregate their activity by weeks. • hour: hour of day (1-24)
We then discard her activity from the second and subsequent Gratification related features (18 total)
weeks, except for a single bit which signifies their existence. • nbest: the total number of best answers of the user posted
In other words, for each user we have the tally of activity within the first week
over the first week, and an additional label for them not be- • nbest voting: same as nbest but only best answers selected by
the community
ing active beyond that week (churners), or else being active • nbest asker: same as nbest but only best answers selected by
for some additional time (non-churners). the asker
Four types of features were extracted from the activity of • nbest awarded: the total number of best answers awarded to
the user within the first week.
the user during this seven-day period: features describing • nbest voting awarded: same as nbest awarded but only best an-
the questions the user answered to, e.g. categories assigned swers selected by the community
to these questions; features associated to the answers posted • nbest asker awarded: same as nbest awarded but only best an-
by the user, e.g. mean length of the answers measured in swers selected by the asker
• nans before best: the number of answers submitted before any
characters and in words; features related to the feedback best-answer events happening
to the work of the user, e.g. the number of thumbs up or • nans after best: the number of answers submitted after the first
thumbs down to her answers; and demographic features of best-answer
• thumbs up: the number of thumbs up on answers submitted in
the user such as gender or zip code. The demographic infor- interval
mation was taken as is, unverified, from the details supplied • thumbs down: the number of thumbs down on answers submit-
by the user. Table 1 details the 64 features extracted to- ted in interval
• thumbs up down: the ratio of (1+thumbs up) to
gether with their types. In total our dataset comprised of (1+thumbs down)
20, 000 examples, consisting of 10, 944 churners and 9, 056 • rating avg: the average of rating by asker (only if best answer
non-churners. was chosen by asker)
• resplenc: the average asker’s response length in characters
• resplenw: the average asker’s response length in words
• gratitude count: the number of responses with at least one
4. RESULTS ”thanks” statement1
Using the dataset we tested prediction performance using • gratitude avg: gratitude count divided by nbest asker
• first best asker: binary indicator for the first answer of the user
several classifiers: Naive Bayes, Logistic Regression, Support winning a best answer by asker
Vector Machine (SVM), Decision Tree, Random Forest and • first best voting: binary indicator for the first answer of the user
K-nearest Neighbors (KNN). In all cases we used conserva- winning a best answer by voting
tive hyperparameter setting, with no attempts to tune them: Answerer demographic features (3 total)
Logistic regression and SVM were trained using stochastic • gender: The gender of the user (as given by the user)
gradient descent, and for the decision tree we used the J48 • age: The age of the user
decision tree learning algorithm pruned such that each leaf • zip: The zip-code of the user
contains at least 100 instances. Random Forest was trained
with 50 trees and 8 features per split. For KNN we used
K = 10. Since the different features have very different example to the majority class. Although Random Forest
distributions and scales, we transformed all features to a gives consistently superior results it is only slightly better
zero mean and standard deviation one, for the metric based than the Logistic Regression classifier, which is much sim-
methods (Logistic Regression, SVM and KNN). pler faster to train and easier to interpret.
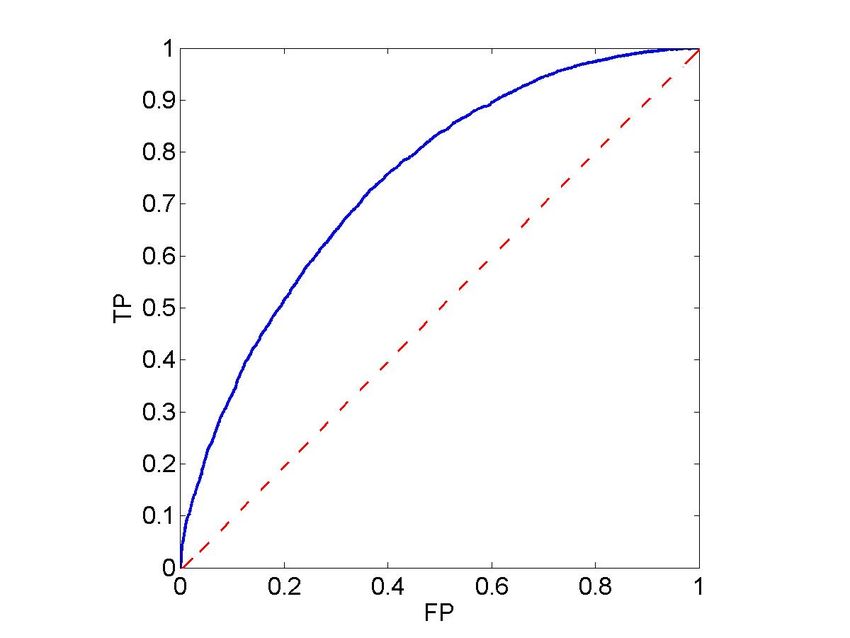
Table 2 details the Error rate, the Area Under ROC (AUC) Figure 3 depicts the Receiver Operator Characteristic (ROC)
and the F1 performance measure of predicting churning. of the output of the Random Forest classifier. It shows the
The table shows 10-fold cross validation performance. We True Positive rate as a function of the False Positive rate.
also give the performance measures for a majority classifier, It is clear that the ROC curve is significantly higher than
which is a coarse baseline classifier that assigns every test that random assignment line, represented by the straightClassifier Error AUC F1 Feature Info-gain Tendency
Majority 0.453 0.5 0.623 nanswers 0.0765 −
Naive Bayes 0.376 0.705 0.730 frac active 0.0749 −
Logistic Regression 0.309 0.754 0.737 yday 0.0734 +
SVM 0.327 0.65 0.75 nans before best 0.0668 −
Decision Tree 0.319 0.727 0.722 month 0.0631 +
Random Forest 0.306 0.758 0.755 mday 0.0549 +
KNN 0.346 0.705 0.685 nbest 0.0498 −
nstars avg 0.0420 +
Table 2: Classifiers’ performance q num answers avg 0.0382 +
qlenw 0.0353 +
thumbsup 0.0345 −
nans after best 0.0335 −
nbest voting 0.0334 −
nbest asker 0.0329 −
rating avg 0.0288 −
Table 3: The 15 most informative features ranked
by their information gain with the target. The Ten-
dency of a feature is the sign of the correlation with
the target.
correlated with churning. Clearly, the number of thumbs
up, thumbs down, number of best answers are all positively
correlated with the total number of the user posted.
To isolate the effect of gratitude features from the effect of
the total number of answers we split users into disjoint sets
each characterized by the number of answers posted by the
users. For each set we plot the churning rate as a function
Figure 3: Receiver Operator Curve (ROC) of the of the the thumbs-up and thumbs-down rates, namely the
Random Forest outputs. fraction of the users’ answers that were thumbed up.
In Figure 4 we grouped the users by the number of answers
they posted. For each group, we plot the fraction of churners
dashed line. Indeed, using the Mann-Whitney statistic [1] as a function of their thumbs-up and thumbs-down rates.
the standard deviation of the estimated Area Under ROC We plot not only an estimate for the churning rate, but
curve (AUC) is not greater than σmax = 0.00225, hence is also the confidence interval to this estimate calculated with
significantly higher than 0.5. confidence level α = 0.05. The lines of Figure 4 (a) that
To get an insight as to which features are more informa- correspond to users with one or two answers exhibit a small
tive for churn prediction, we calculated for each feature the but significant decrease in churning rate with thumbs-up
Information Gain for predicting the target variable, churn- rate. An opposite trend is observed in Figure 4 (b) where
ing. Table 2 lists the top contributing features sorted by the more thumbs down lead to increased churning. For users
value of their Information Gain. We also listed the sign of with three, four, five and six answers the trend is not as
the correlation between the feature and the target to give a visually clear. But fitting each line with a linear function
notion of how it affects churning: a positive sign means that using the least squares method results in positive slopes for
larger values of the feature are associated with higher ten- all cases of Figure 4 (a) and negative slopes for Figure 4
dency to churn, and vice versa. The table uncovers several (b). This confirms the intuitive hypothesis that a thumbs-
trends in the data, some of which obvious while others less up feedback reduces churning albeit in a minute way, wheras
so: First, the most informative feature is the total number of a thumbs-down feedback increases churning.
answers the user posted. Namely, users who post more an- Last, and quite surprising, are question related features
swers are much less likely to churn, as suggested by Figure 2. (average number of stars, average lengths, average number
The effect of the feature frac active, follows, basically, the of answers) which are all positively correlated with churning.
same reasoning. Second, several temporal features (month, This suggests that users that are involved in more popular
day of year and day in month) all with positive correla- content are more likely to churn. A possible explanation
tions with churning. This means, that in the period of time would be that the longer and more interesting questions tend
the data describes, churning becomes more prevalent with to attract many users. But of those intially lured to the
time. This pattern was independently verified. Third, fea- question, the propensity to answer is higher among “new-
tures which are related to gratitude (number of best answers, bies”. Possibly, the veterans feel they have a lower chance of
number of best answers by asker, number of best answers by winning a best answer, or that their voice will be crowded
voting, average rating, number of thumbs up) all negatively out, and therefore refrain from answering.
correlated with churning. Namely the more gratitude a user
receives, the less likely she is to churn. We notice that the
two features that describe the number of answers before first 5. CONCLUSIONS
best answer, and after last best answer are also negatively Contributing users are the lifeblood of CQA sites. And(a) (b)
Figure 4: Churn rate as a function of thumbs-up (a) and thumbs-down (b) rates. The legend indicates the
sub-group of users, chosen by number of answers posted.
among the contributors, the ones who define the spirit and Mathematical Statistics, 28(4):933–945, 1957.
etiquette of the site are the continuous contributors. These [2] W. Buckinx and D. Van Den Poel. Customer base
are the users who define the site’s collective memory and analysis: Partial defection of behaviorally-loyal clients
pass it on. Therefore, a large number of “drive-by” answer- in a non-contractual fmcg retail setting. European
ers are not as good as a smaller number of users who keep Journal Of Operational Research, 164:252–268, 2003.
coming back. In identifying users likely to churn early, this [3] J. Burez and D. Vandenpoel. Crm at a pay-tv
work makes a first step in turning this observation into po- company: Using analytical models to reduce customer
tential operational changes. attrition by targeted marketing for subscription
Above, we show that the task of identifying potential one- services. Expert Systems with Applications,
time contributors is achievable to a reasonable degree. The 32:277–288, 2007.
obvious next step is propose changes that will make a site [4] K. Coussement and D. Van Den Poel. Churn
more “sticky”. Some of these could be applied to the entire prediction in subscription services: An application of
user base, like showing similar questions to the one just an- support vector machines while comparing two
swered, to encourage a user to answer again. Others could parameter-selection techniques. Expert Systems with
be targeted just at likely churners, like sending some kind Applications, 34(1):313–327, 2008.
of “we want you back” message. The space of possible ac- [5] K. Dasgupta, R. Singh, B. Viswanathan,
tions is large, and it’s also true that some actions may cause D. Chakraborty, S. Mukherjea, A. A. Nanavati, and
a backlash and should not be attempted. We feel that the A. Joshi. Social ties and their relevance to churn in
best course of action could probably be answered by usage mobile telecom networks. In EDBT’08, pages 668–677,
data and methods similar to the ones in this work, how- 2008.
ever further development is outside the scope of the current
[6] P. Datta, B. Masand, D. R. Mani, and B. Li.
paper.
Automated cellular modeling and prediction on a large
We also note that analysis of this kind inevitably brings
scale. Artif. Intell. Rev., 14:485–502, 2000.
up the nature-versus-nurture debate. What this means here
is that repeat contributors may be “born” or “made”. If [7] J. Hadden, A. Tiwari, R. Roy, and D. Ruta. Churn
they are born, then what brings them back is some innate prediction using complaints data. In Proceedings of
quality, which is missing in the early churners, and nothing world academy of science, engineering, and technology,
could be done to change it. Conversely, if they are made, volume 13, pages 158–163, 2006.
then perhaps there is a strategy to boost participation of the [8] M. Karnstedt, T. Hennessy, J. Chan,
churners, and effort should be made to find it. We acknowl- P. Basuchowdhuri, C. Hayes, and T. Strufe. Churn in
edge the issue, however the materials and methods used in social networks. Handbook of Social Network
this work cannot support a decisive answer in this case. The Technologies and Applications (Springer), 2010.
truth is probably somewhere in the middle, but we leave the [9] M. Karnstedt, M. Rowe, J. Chan, H. Alani, and
task of determining the degree of inherent answer-posting of C. Hayes. The effect of user features on churn in social
each user to future work. networks. In Proceedings of the third ACM/ICA Web
Science Conference, 2011.
[10] J. Kawale, A. Pal, and J. Srivastava. Churn prediction
6. REFERENCES in mmorpgs: A social influence based approach. In
[1] Z. Birnbaum and O. M. Klose. Bounds for the IEEE International Conference on Computational
variance of the mann-whitney statistic. Annals ofScience and Engineering, pages 423–428, 2009.
[11] D. A. Kumar and V. Ravi. Predicting credit card
customer churn in banks using data mining.
International Journal of Data Analysis Techniques
and Strategies, 1, 2008.
[12] M. Mozer, R. Wolniewicz, D. Grimes, E. Johnson, and
H. Kaushansky. Predicting subscriber dissatisfaction
and improving retention in the wireless
telecommunications industry. IEEE Trans Neural
Netw, 11(3):690–696, 2000.
[13] T. Mutanen, S. Nousiainen, and J. Ahola. Customer
churn prediction –a case study in retail banking. In
Proceedings of the 2010 conference on Data Mining for
Business Applications, pages 77–83, 2010.
[14] P. C. Pendharkar. Genetic algorithm based neural
network approaches for predicting churn in cellular
wireless network services. Expert Syst. Appl., 36, 2009.
[15] C. ping Wei and I. tang Chiu. Turning
telecommunications call details to churn prediction: a
data mining approach. Expert Systems With
Applications, 23:103–112, 2002.
[16] Y. Richter, E. Yom-Tov, and N. Slonim. Predicting
customer churn in mobile networks through analysis of
social groups. In SIAM International Conference on
Data Mining, pages 732–741, 2010.
[17] D. Stutzbach and R. Rejaie. Understanding churn in
peer-to-peer networks. In Proceedings of the 6th ACM
SIGCOMM conference on Internet measurement, IMC
’06, pages 189–202, 2006.
[18] W. Verbeke, D. Martens, C. Mues, and B. Baesens.
Building comprehensible customer churn prediction
models with advanced rule induction techniques.
Expert Systems With Applications, 38:2354–2364,
2011.You can also read