TOWARD ACCURATE INFERENCE OF WEB ACTIVITIES FROM PASSIVE DNS DATA - IEEE IWQOS 2018
←
→
Page content transcription
If your browser does not render page correctly, please read the page content below
Toward Accurate Inference of Web Activities
                  from Passive DNS Data
        Jingxiu Su∗† , Zhenyu Li † , Stephane Grumbach‡ , Kave Salamatian§ , Chunjing Han† , Gaogang Xie†
                                         ∗ University of Chinese Academy of Sciences, China
                                              † Institute
                                                        of Computing Technology, China
                                                             ‡ Inria,France
                                                 § LISTIC,University of Savoie,France

   Abstract—DNS is a critical component of Internet architecture.       filtering. Network address translation (NAT) is a method of
Almost all applications, in particular web based applications           remapping one IP address space into another by modifying
that constitute the large majority of current Internet traffic,         network address information in Internet Protocol (IP) datagram
leverage heavily on DNS. This makes DNS based measurements
a promising tool for understanding global properties of Internet        packet headers while they are in transit across a traffic routing
traffic, e.g., sites audience, traffic matrix. However, using passive   device [2]. The technique has become a popular and essential
DNS traces from local DNS servers is challenging because of             tool in conserving global address space allocations in face of
DNS caching and NATs. The goal of this paper is twofold. First,         IPv4 address exhaustion by sharing one Internet-routable IP
we show how to correct the bias due to DNS cache and the wide           address of a NAT gateway for an entire private network.
use of NATs, to extract meaningful traffic information from DNS
traces. The techniques are then used and validated over a large             In this paper, we discuss the effect of DNS caches and
dataset (1011 records) containing two days of full DNS access           NAT of network wide traffic measurement obtained over DNS
from a major ISP providing both mobile and landline ADSL                record from LDNS servers, and present methodological ways
in China. Second, we focus on the tracking activity and show            of alleviating their effect to get around the optimized behavior
that although most sites accessed from China belong to Chinese          of the DNS system to recover a realistic view of the real traffic.
corporations, most trackers belong to US ones. Mobile and ADSL
platforms are alike.                                                    The solutions to alleviate such issues can have extensive use
                                                                        to other platforms. Then we use a large LDNS server log
                         I. I NTRODUCTION                               trace that consists of about 150 billion logs of a major mobile
    Domain Name System (DNS) plays a crucial role in the                and landline ADSL ISP in China, to validate our proposed
daily operation of Internet [1]. Almost all network services            methodologies. We finally look into using this DNS trace
depend on DNS and leverage on its infrastructure. Since DNS             for measuring the geographical distribution of web tracking
is already distributed, and can enable long-term observation of         activities.
traffic parameters, looking at the local DNS servers of an ISP              Web tracking technologies are used to collect and correlate
provides a simple monitoring vantage point to the ISP’s wide            user web browsing behavior [3]. Such information is of
traffic that is easy to access and does not need to instrument          interest to various areas, more generally, data gathered on
a large number of distributed measurement point. This makes             Internet users browsing behavior represent a source of strategic
DNS a prominent source of information about global network              information that have both economic and political value. Using
usages.                                                                 the DNS records will give a direct and comprehensive view
    However, using DNS measurement to infer traffic char-               of the web tracking activity. We observe that while Chinese
acteristics is challenging. Extending observations made over            web activity is strongly concentrated inside China with more
DNS traffic to overall traffic have two major methodological            than 75% of web sessions going to Chinese web services, yet
challenges. The major issue with using DNS trace from local             around 87% of tracking activity is ensured by US trackers.
DNS (LDNS) servers is the effect of DNS caching that                    This share is almost alike in Chinese and US sites.
filters out the DNS requests that are already cached in local               The rest of the paper is organized as follows. We define the
and intermediate DNS caches. Caching is one of the oldest               challenges and detail the methodology of accurate the data
techniques for improving performance in computer systems.               in Section III. We investigate the inequality tracking activies
By storing information locally, caches typically enhance per-           on geography in Section IV. We survey the related works in
formance by reducing access latency to data source and by               Section V. We conclude the paper in Section VI.
reducing bandwidth requirements at the data source. Caching
has been widely explored by many client-server applications                                II. PASSIVE DNS DATA
(e.g., distributed file systems, web caching and DNS), and they            The used dataset consists of all the DNS requests and their
derive significant benefits from doing so.                              resolution information received during two days by the DNS
    Another issue is the use of Network Address Translation             servers of a major mobile and ADSL (Asymmetric Digital
(NAT) middleboxes, which also has an impact on DNS cache                Subscriber Line) ISP in China. The data were gathered from

978-1-5386-2542-2/18/$31.00 2018 IEEE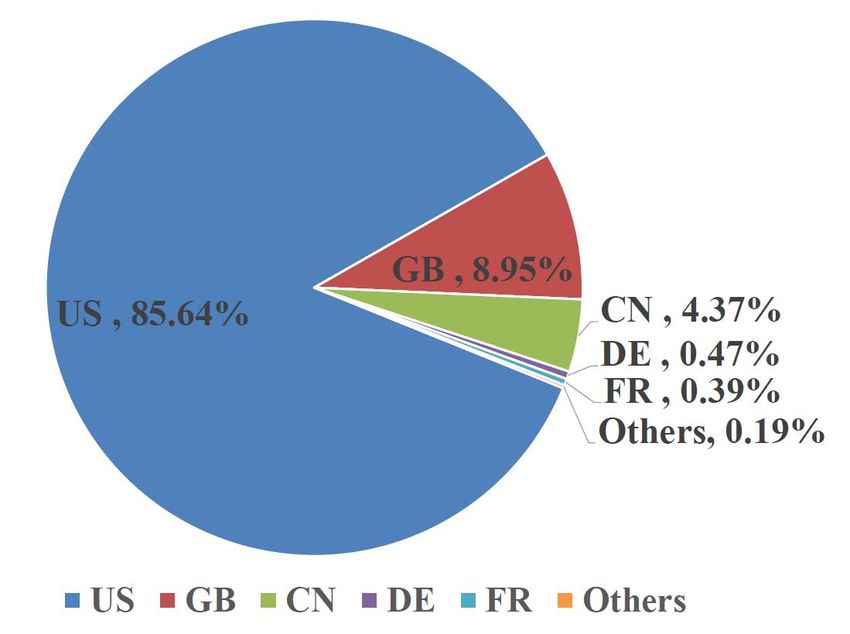
DNS servers located in different Chinese provinces and mu-                    100
nicipalities covering the whole country. The dataset contains
about 150 billion DNS records in total, each having five fields:

                                                                       CCDF
a timestamp (at second level precision), the anonymized source                10-2
IP sending the request, the domain name queried, the list of
                                                                                       Average number
resolved IP addresses and a field indicating if the address                            Variance number
resolution has been successful. It is noteworthy that even if                          Maximum number
                                                                              10-4
the timescale of timestamp is 1 second, the trace are logs so                   10-4               10-2            100               102   104
they are sorted, i.e. two DNS records timestamped at the same                                         # of DNS requests per second

time, are guaranteed to happen with the same order as they               Fig. 1: CCDF of observed DNS requests per second
are observed in the DNS log.
Identification of tracker domains: Because we will examine
the web tracking behavior using the DNS trace, we have              several real users are hidden behind them. We therefore need
therefore to identify if a resource is relative to a tracker. For   to detect these NATed addresses for not using them in analysis
this purpose, we use an approach based on a blacklist of            of user based statistics like the audience of online resource or
filtering rules used for checking suspicious URLs by exact or       co-occurence. Nevertheless, some other aggregated statistics
wildcards matching. This approach is commonly implemented           can benefit from these NATed IPs even if there are several
by largely used Ad suppressing utilities [4]. We combined           users behind them.
blacklists obtained from Adblock Plus [5], Ghostery [6] and            We show in Table I the cross-correlation between the above
Disconnect [7]. These blacklists are partly overlapping. We         defined three values. The average and the variance values
used in particular the specific China targeted blacklist from       are strongly correlated, while the correlation with maximum
Adblock Plus [8] to ensure identification of all Chinese track-     value is milder. Based on this observation, we use the average
ers. All these blacklists are used in practice and maintained       number along with the maximum number of DNS requests
up to date by their providers.                                      per second in order to classify IP addresses into NATed and
                                                                    non-NATed ones.
       III. PASSIVE DNS A NALYSIS M ETHODOLOGY
   In this section, we discuss the impact of NAT and DNS                                                   Ave      Var      Max
caching on passive DNS analysis, and propose methodologies                                   Ave          1.0000   0.9857   0.8777
to address the problems to obtain accurate analysis results. It                              Var          0.9857   1.0000   0.9282
is worth noting that although the context is in passive DNS                                  Max          0.8777   0.9282   1.0000
traces from LDNS servers, our methodologies can be applied
to other relevant problems, like passive HTTP traces from           TABLE I: Cross-correlation values between average (Ave),
ISP’s gateway that have the same issues as the passive DNS          variance (Var) and maximum (Max) values of number of DNS
traces.                                                             requests per second

A. NAT Impact                                                          NAT detection is a well studied area and several active
   It is important for the DNS analysis to ensure that at each      and passive methods have been proposed to detect address
instant of time only a unique user is using a given IP address.     translation boxes [10, 11]. However, most of these techniques
However, NAT middleboxes enable sharing a single routable           leverage on header or payload contents. In our case, we
IP address between different users [9], that goes against this      attempt to detect NATed IP addresses using only DNS queries.
need. In this section, we will present the methodology to           Moreover, our goal is not per se to detect NAT boxes, but to
indentify the unique users for further analysis.                    detect cases where more than one users are using an IP address
   From the DNS data, we observed for each source IP address        simultaneously. In order to achieve this, we leverage on the
an unexpected high value of 4.01 DNS requests per second            observation that NATed IP address generates a higher rate of
on average. In order to investigate more this value we derived      DNS queries than non-NATed ones as they have several users
three values for each source IP address: the average number,        behind them. It is noteworthy that a single web session might
the variance number, and the maximum number of DNS                  contain a large number of URLs resulting into a large influx
requests per second. We show in Figure 1 the Complemen-             of DNS requests, and a large maximum number of requests.
tary Cumulative Distribution Function (CCDF) of these three         This means that in practice, the DNS query flow comes from
values.                                                             a mixture of NATed and non-NATed nodes and we have to
   As we can see from Figure 1, the average number of DNS           classify incoming requests into these two classes.
request per second spans almost 6 orders of magnitude from             Our dataset contains mobile and ADSL users. The practice
5 × 10⁻⁴ to 181, exhibiting a very heavy tail. This shows           of mobile operator is to use NAT. This means that mobile users
clearly that some IP addresses are largely contributing to          using IPv4 addresses are very likely behind NAT. The ISP who
the average. We can explain this by the fact that some IP           provided the DNS dataset also provided us with IP address
addresses, in particular mobile IP addresses, are NATed and         ranges used for ADSL and mobile networks. While mobile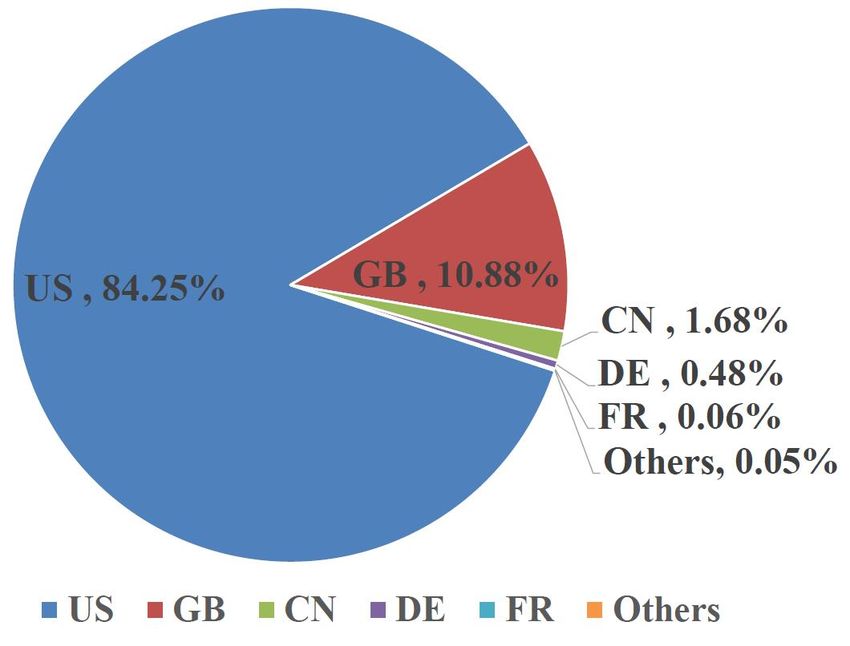
users are very likely behind a NAT, ADSL users might also            user-session might consist of several TCP connections, opened
decide to share their ADSL connectivity and become NATed.            by the same host toward possibly different servers.
Because of the difference between these two category of users           There are relatively rich literatures on web user-session
we decided to analyze each one separately and compare the            identification [14–16]. Most of the existing works rely on
outcome.                                                             exhaustive packet or connection level traces and assume that
   NATed and non-NATed are separated through a mixture               only a single user is behind an IP address. In this paper, we
based classification. We fit the joint distribution of the average   propose a new methodology to detect user-sessions leveraging
and maximum values of DNS requests rate to a mixture of              only on DNS traces.
correlated General Gamma (GG) Distributions [12]. This GG               We first order the DNS dataset by source IP addresses and
distribution kernel is used in place of the classical Gaussian       generate for each observed IP address in the dataset a temporal
component because of the positivity constraint and its heavier       sequence of DNS requests. In the second step, we split each IP
tails. We further use a maximum Akaike information crite-            source address sequence’s into an alternation of user-sessions
rion [13] in order to select the number of mixture components.       and inactivity periods. A simple approach proposed in [14, 15]
This criterion gives that 2 components are enough to classify        used a chosen threshold θ. The splitting is done by aggregating
the observations. After classification we got two classes in         into a user-session any DNS request arriving before time
each category.                                                       threshold θ. This approach has been shown to work well if
                                                                     the threshold value is correctly chosen.
              Category     Class   Average   Maximum                    The choice of θ is generated through a mixture of distribu-
            Mobile users    1       0.012      2.45                  tion of the DNS request gap, i.e. the arrival time between DNS
            Mobile users    2       5.03      29.21                  requests. Because of the integer valued nature of the data, we
            ADSL users      1       0.046      3.83                  use a mixture of Poisson components to model the probability
                                                                     distribution of DNS request gaps. The Aikeke information
            ADSL users      2       0.78      18.60
                                                                     criteria shows that 3 classes are enough to model the empirical
TABLE II: Mixture Classification results: Average and Max-           distribution. Figure 2 shows the CCDF of the DNS request
imum number of DNS requests per second for each class                gaps measured over all DNS request sequences. We got three
obtained from the mixture of correlated GG distribution              classes after measuring: one class with an average of 0.05
                                                                     second, one with an average of 2.9 seconds, and the last with
   We present in Table II the result of the classification for       an average of 45 seconds. The first class contains only DNS
the two category of IP addresses. The table shows for each           gaps that are 0 (not shown in the Figure), the second class
class, the average and maximum values of the number of DNS           (shown as INSIDE user-session gaps in Figure 2) contains all
requests per second. In both IP address categories, there is a       DNS request gaps less than 5 seconds and the last class (shown
strong differentiation between two classes: one class generated      as BEYOND user-session gaps) contains the remaining DNS
very low number of DNS requests per second on average                request gaps. Based on the above observation, we have chosen
(0.012 for mobile users and 0.046 for ADSL users) and the            the threshold equals to 5 seconds, i.e., all DNS requests that
second class generated a much larger number of DNS requests          are distant by less than 5 seconds are assumed to belong to
per second. The first class is more compatible with a single         the same user-session.
user usage than the second class.
   Based on the above observation, we decided to use IP                        100
addresses detected in class 1 for single user analysis and
to assume that IP addresses detected in class 2 are NATed.                10-2
                                                                        CCDF

To see the filter impact on the original DNS dataset, we
took 10 million records which include 5,581,899 distinct IP
                                                                          10-4
addresses, after running the classification method, 29.2% of                         BEYOND user-session gaps
                                                                                     INSIDE user-session gaps
multi-users IP addresses have been pruned, remains 3,951,640                         Overall gaps
                                                                          10-6
single user IP addresses. We use only the logs from non-NATed                100                    101                102      103
                                                                                                          DNS request gaps
IP addresses in the following analysis.
                                                                                     Fig. 2: Distribution of DNS request gaps
B. Extraction of User-sessions
   Using DNS logs from non-NATed IP addresses, we further               Generally, a user-session has the following structure: an
deal with DNS caching impact. To this end, we first extract          initial site request which is made to a service/content provider,
user sessions.                                                       followed by a sequence of forthcoming requests to other
   The typical user behavior on Internet consists in activity        servers. As we are interested in trackers, we will consider only
period, where the user browses the Internet, alternating with        connections made to servers detected as tracker/advertiser by
silent period over which the user is not active. The active          the blacklists we describe in Section II. A user-session begins
period will be coined through the paper as user-session. A           with an access to a website and it is closed when the next DNS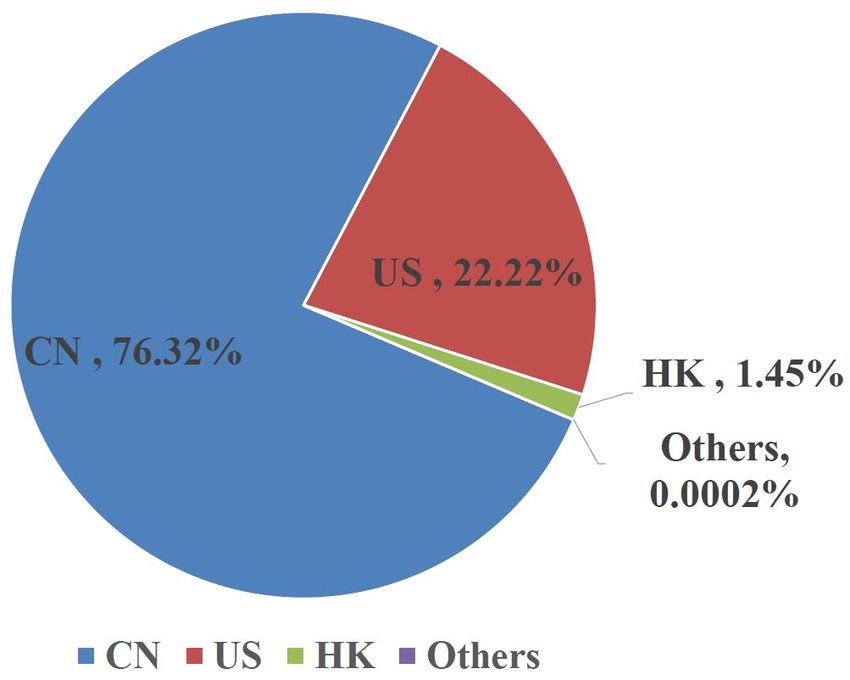
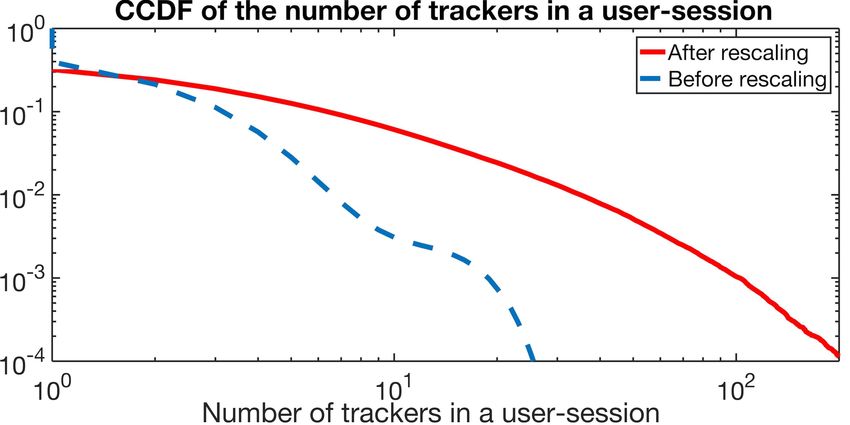
request arrives later than the threshold θ. In between, any DNS      user-session, while after rescaling this number increases to
request arriving is aggregated into the same user-session.           200. We investigated the source of these cases, and observed
   In summary, a user-session relative to a user k (more             that they are all linked to webpages or Internet services that
precisely relative to a non-NATed IP address with a single user      relies on several others, so that a contact to one of them results
behind it) that begins at time t is a set Sik (t) containing the     in a cascade of DNS accesses. News aggregators or Internet
canonical name of the first non-tracker server contacted during      portals are example of such situations. In these cases, trackers
the user-session followed by a sequence of tracker domain            in each contacted server add to each other resulting into a
names contacted during the same user-session. The sets Sik (t)       large number of trackers in the session.
are the main raw data we will use in the forthcoming.
C. DNS Cache Impact
   Using the above user-session extraction methodology, we
deal with the issue of DNS cache. A network client accessing
an online resource with a canonical name as to translate this
name to an IP address. However, before sending the DNS
request to the DNS server of its operator, the client first checks
if this information is available in its local DNS cache.
   A requested DNS record not in the cache initiates a miss that
results in querying the DNS record from higher level of the
DNS cache hierarchy. When the record is retrieved, it is cached      Fig. 3: CCDF of the number of trackers observed in a user-
during a time defined by the TTL ( time-to-live) attached to the     session.
DNS request. A request arriving during the caching gets a hit.
In the DNS server at the ISP level, we will only observe the            3) Accuracy verification with Lightbeam: The last evalua-
first request and not the subsequent requests inside the caching     tion we made is to validate the accuracy of the trackers in each
duration. This means that local cache filters out a relatively       final user-session after applying the above two methodologies
large proportion of DNS requests that never reach the ISP            to solve the NAT and DNS cache impact. We compare our
caches that we are monitoring, i.e., any observation using DNS       result with Lightbeam, which is an add-on for browsers that
traces is a partial sampling of real Internet activity [17].         displays third party tracking cookies placed on the user’s
   We propose a rescaling methodology to solve the above             computer while visiting various websites. Lightbeam displays
cache issue based on user-session structure.                         a graph of the interactions and connections of sites visited
   1) Rescaling the DNS observations: We have described              and the tracks to which they provide information [18]. We
how to split the DNS requests into sets of user sessions             revisit a sample of 809 sites (these sites are extract from DNS
Sik (t) in the previous subsection. However, different users,        dataset), and use Lightbeam to monitor the tracking activities.
at different timestamps, and different locations that access the     The comparison results are remarkable, an average accuracy
same destination service/content provider, will not observe all      rate over the 809 sites is 91.7%.
the same DNS cache state. In other words, different user-
sessions going to the same content/service might contain                  IV. G EO - POPULARITY OF T RACKING ACTIVITIES
different but still incomplete list of contacted trackers. We can       The previous analysis provides strong basis for using the
leverage these differences and merge the different sets Sik (t)      DNS traces to analyze the audience of different web activities.
relative to the same initial site site1. This will results into      This section takes tracking activities as an example to show the
an inflated set of trackers that will contain all that have been     use of passive DNS traces after applying our methodologies to
missed through the DNS caching. We can rescale the DNS               infer web activities. Specially, we consider the trackers from
observations, by replacing this merged set in place of any set       the point of view of the geography.
Sik (t) beginning with the site site1.                                  For simplicity but without lack of relevance, we assign a
   2) DNS Rescaling results: We show here the results of do-         tracker service to the country that is registered in the WHOis
ing the user-session splitting and rescaling the DNS requests.       database[19] along with the corresponding canonical domain
As we will examine tracking activities, we focus here on             name. The WHOis database contains contact information for
the effect of DNS rescaling methodology on trackers. After           administrative and technical contact points along with the
doing the user-session splitting on the dataset, we ended up         country. We therefore assign to each tracker the country
with 160 million user sessions containing at least one tracker       reported in the WHOis database to the corresponding DNS
with an average of 1.86 DNS requests per user-session. After         canonical domain name entry. The traffic resulting from the
rescaling, this number increases to 2.73. We show in Figure          DNS traces we have analyzed can thus be attached to desti-
3 the distribution of the number of trackers observed in a           nation countries. More precisely, the traffic load of a country
user-session both before and after the DNS rescaling. It can         is measured as the number of DNS requests that resolve to an
be seen the DNS rescaling fattens strongly the tail of the           IP address in this country, or more precisely to an IP address
distribution. Before rescaling we had up to 40 trackers in a         that belongs to a corporation based in this country.
A. Geographical inequality of tracking activities
(a) Mobile (b) ADSL
Fig. 6: Overall mobile traffic share among mobiles and ADSL.
Fig. 4: Traffic share between countries from China.
We show the global view of geographic distribution by (a) Mobile (b) ADSL
measuing on the whole dataset. As can be seen in Figure 4,
Fig. 7: Advertisers/Trackers DNS traffic share among mobile
China is the destination of more than 73% percent of the traffic
and ADSL.
from China; while the US account for 24%. All other countries
account for less than 3% of the whole traffic.
When we consider instead the tracker traffic, we observe a ecosystem.
rather different trend. We show in Figure 5 the distribution of
the traffic to tracker services worldwide. It can be observed B. Mobile/ADSL comparision
that the US is attracting more than 87% of all the tracker traffic In Figure 6(a) and Figure 6(b), we show the share of
from China. The second rank is occupied by the GB with traffic we have observed over all DNS traces between different
7.2% of tracking traffic, while China itself only occupies the countries, on mobile and ADSL platforms. It can be seen that
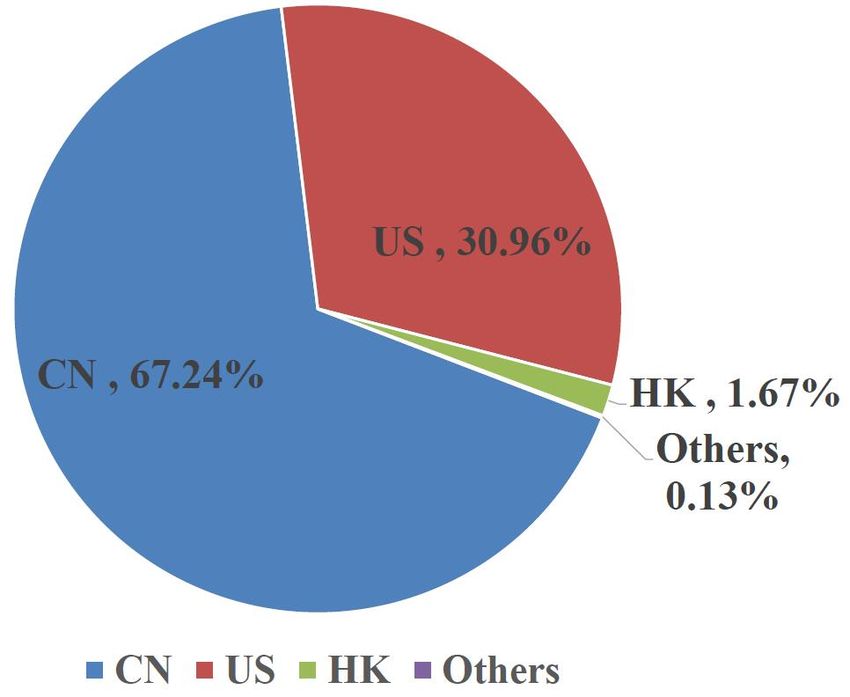
third rank with 3.2% of the tracker traffic on its own territory. China is the destination of 76.32% of mobile and 67.24% of
These results confirm trends observed previously on a different ADSL based traffic; US accounts for 22.22% of mobile traffic
dataset in [20], where it was shown that China dominates its and 30.96% of ADSL. All other countries account for less
local Web with more than 80% of local sites, while these sites than 2% of traffic. China has a relatively higher occupancy on
contain a majority of US trackers. mobile over ADSL when compared to the second dominator
US.
We continue look at the tracker traffic and observe whether
it follows the above described trend. We show in Figure
7(a) and Figure 7(b) the geographical distribution of overall
traffic and tracking traffic respectively. We can see that US is
attracting more than 84% of both mobile and ADSL tracker
traffic. Interestingly the second rank is occupied by GB with
8.95 to 10.88% of tracking traffic and China only appears
at the third rank with 1.68% of mobile traffic and 4.37% of
ADSL traffic. Generally, the traffic share follows the similar
trend on mobile and ADSL platforms.
V. R ELATED WORKS
As DNS is perceived as a critical infrastructure [21], studies
have focused on DNS for the purpose of identifying malicious
activities [22, 23], managing large DNS infrastructures [24],
Fig. 5: Traffic share of tracking services from China. understanding how DNS server selection and caching works
in reality [25, 26], and modeling its infrastructure in order to
It should be noted that this surprising situation holds despite predict how DNS traffic will change under specific conditions
the fact that China has a rich advertisement and e-commerce [27]. In contrast, there has been little work on how to solvethe DNS inherent issues as explained in this paper, our work [12] P. S. Bithas, N. C. Sagias, et al., “Distributions involving
is to fill this gap. correlated generalized gamma variables,” in Proc. Int.
Another aspect related to our work is about online web Conf. on Applied Stochastic Models and Data Analysis,
tracking. Web tracking ecosystem has been well analyzed vol. 12, 2007.
[28–31]. However the previous studies either focused on [13] Wikipedia, “Akaike information criterion.” https://en.
the analysis of specific types of third-party trackers or the wikipedia.org/wiki/Akaike information criterion, 2017.
classification over world without inspect deep into China. Our [14] V. Paxson and S. Floyd, “Wide area traffic: The failure
study examined the geographical distribution of web tracking of poisson modeling,” IEEE/ACM Trans. Netw., vol. 3,
services that serve Chinese netizens. . pp. 226–244, June 1995.
[15] C. Nuzman, I. Saniee, W. Sweldens, et al., “A compound
VI. C ONCLUSIONS model for tcp connection arrivals for lan and wan appli-
In this paper, we have developed new methodologies to cations,” Comput. Netw., vol. 40, pp. 319–337, Oct. 2002.
accurately analyze the DNS log data, and get around the [16] A. Bianco, G. Mardente, M. Mellia, M. Munafo, and
optimized behavior of the DNS system to recover a realistic L. Muscariello, “Web user session characterization via
view of the real traffic, and recollect user-sessions. We used clustering techniques,”
a large passive DNS dataset to illustrate the impact of DNS [17] N. C. Fofack and S. Alouf, “Modeling modern dns
cache and NAT, and validate our methodologies. Specially, caches,” ValueTools ’13, pp. 184–193, ICST, 2013.
we applied our methodologies on the dataset to infer web [18] Lightbeam, “Shine a light on who is watching you.”
tracking activities through the DNS dataset. We observe that https://www.mozilla.org/en-US/lightbeam/.
although the Chinese Internet is mostly organized around on- [19] “Whois.net.” https://www.whois.net.
line services offered by Chinese corporations, the underlying [20] C. Castelluccia, S. Grumbach, and L. Olejnik, “Data
trackers are mostly dominated by US corporations. Similar harvesting 2.0: from the visible to the invisible web,”
observations are seen on mobile and ADSL platforms. Collection of Czechoslovak Chemical Communications,
vol. 24, no. 3, pp. 760–765, 2013.
VII. ACKNOWLEDGEMENT [21] L. Deri, S. Mainardi, M. Martinelli, and E. Gregori,
This work is supported in part by National Key R&D “Graph theoretical models of dns traffic,” in IWCMC,
Program of China (Grant No. 2016YFE0133000): EU-China 2013, pp. 1162–1167, IEEE, 2013.
study on IoT and 5G(EXCITING), National Natural Science [22] M. Antonakakis, R. Perdisci, et al., “Building a dynamic
Foundation of China (Grant No. 61572475 and 61502460), reputation system for dns.,” in USENIX security sympo-
and the Youth Innovation Promotion Association CAS. sium, pp. 273–290, 2010.
[23] A. Berger and E. Natale, “Assessing the real-world dy-
R EFERENCES namics of dns,” Traffic Monitoring and Analysis, pp. 1–
[1] C. Liu and P. Albitz, DNS and Bind. ” O’Reilly Media, 14, 2012.
Inc.”, 2006. [24] C.-S. Chen et al., “A unifying framework for intelli-
[2] J. Technologies, Network Protocols Handbook. Javvin gent dns management,” International journal of human-
Technologies Inc., 2005. computer studies, vol. 58, no. 4, pp. 415–445, 2003.
[3] N. Schmucker, “Web tracking,” in SNET2 Seminar [25] D. Wessels, M. Fomenkov, et al., “Measurements and
Paper-Summer Term, 2011. laboratory simulations of the upper dns hierarchy,” in
[4] A. Yamada, H. Masanori, and Y. Miyake, “Web track- PAM’04, pp. 147–157, Springer.
ing site detection based on temporal link analysis,” in [26] J. S. Otto, M. A. Sánchez, et al., “Content delivery
WAINA’2010, pp. 626–631, IEEE, 2010. and the natural evolution of dns: remote dns trends,
[5] W. Palant, “Adblock plus: Save your time and traffic.” performance issues and alternative solutions,”
https://easylist.adblockplus.org/en/, 2017. [27] Y. Koc, A. Jamakovic, and B. Gijsen, “A global reference
[6] R. Bilton, “Ghostery: A web tracking blocker that actu- model of the dns,” Sponsoring Institutions, p. 7, 2011.
ally helps the ad industry,” vol. 31, 2012. [28] B. Krishnamurthy and C. Wills., “Privacy diffusion
[7] Disconnect. https://disconnect.me/lists/malvertising. on the web: A longitudinal perspective,” WWW ’09,
[8] “Adblock plus easylist china.” https://easylist-downloads. pp. 541–550, 2009.
adblockplus.org/easylistchina+easylist.txt, 2017. [29] B. Krishnamurthy, K. Naryshkin, and C. Wills, “Privacy
[9] F. Audet and C. Jennings, “ Network Address Translation leakage vs. protection measures: the growing discon-
(NAT) Behavioral Requirements for Unicast UDP,” RFC nect,” in Proceedings of the Web, vol. 2, pp. 1–10, 2011.
4787, RFC Editor, January 2007. [30] F. Roesner, T. Kohno, and D. Wetherall, “Detecting
[10] S. M. Bellovin, “A technique for counting natted hosts,” and defending against third-party tracking on the web,”
IMW ’02, pp. 267–272, ACM, 2002. NSDI’12, pp. 12–12, USENIX Association, 2012.
[11] G. Maier, F. Schneider, and A. Feldmann, “Nat usage [31] M. Falahrastegar, H. Haddadi, S. Uhlig, and R. Mortier,
in residential broadband networks,” PAM’11, pp. 32–41, “Anatomy of the third-party web tracking ecosystem,”
Springer-Verlag, 2011.You can also read