Reliable Crowdsourced Event Detection in SmartCities - KDD Lab
←
→
Page content transcription
If your browser does not render page correctly, please read the page content below
Reliable Crowdsourced Event Detection in
                            SmartCities
                   Ioannis Boutsis, Vana Kalogeraki                                        Dimitrios Gunopulos
                     Department of Informatics                           Department of Informatics & Telecommunications
        Athens University of Economics and Business, Greece                       University of Athens, Greece
                     {mpoutsis, vana}@aueb.gr                                             dg@di.uoa.gr

   Abstract—In recent years crowdsourcing systems have shown        repair and development of Johannesburg’s road network and
to provide important benefits to Smartcities, where ubiquitous      storm water infrastructure, and the CrowdAlert app2 that we
citizens, acting as mobile human sensors, assist in responding to   have developed (shown in figure 1), where citizens con-
signals and providing real-time information about city events, to
improve the quality of life for businesses and citizens. In this    tribute traffic related events (e.g., congestion) through opt-in
paper we present REquEST, our approach to selecting a small         crowdsourcing mechanisms. Furthermore, CrowdAlert enables
subset of human sensors to perform tasks that involve ratings,      users to receive traffic information observed through city-
which will allow us to reliably identify crowdsourced events. One   wide heterogeneous sensor network infrastructures that exist in
important challenge we address is how to achieve reliable event     SmartCities such as road sensors, bus sensors, traffic cameras
detection, as the information collected from the human crowd
is typically noisy and users may have biases in the answers         and feedback from the human crowd [1], [2].
they provide. Our experimental evaluation illustrates that our         SmartCity apps provide important benefits: First, they put
approach works effectively by taking into consideration the bias    new capabilities in the hands of city administrators, where
of individual users, approximates well the output result, and has   innovative technologies and system infrastructures work in
minimal error.
                                                                    concert to provide insights, identify events of interest, which
   Index Terms—crowdsourcing; smart cities; bias
                                                                    allow them to effectively cope with emergency situations.
                          I. I NTRODUCTION                          Second, they provide a platform and engagement mechanisms
                                                                    (through crowdsourcing, open data, etc.) where citizens ac-
   With overwhelming population growth on the rise, we              tively participate and contribute data into the system toward
are moving toward a world where digital technology and              implementing city wide solutions. Crowdsourcing is the pro-
intelligent design are harnessed to create smart, sustainable       cess of soliciting contributions from the human crowd, a large
cities that offer creative services to improve the quality of       group of self-identified city volunteers, where each contributor
life for their businesses and citizens. Making cities smarter       can perform a task via a mobile device, this task adds a
is emerging as a key area of focus for governments and              small portion to the final result. Tasks typically cover a wide
the private sector to address the projected demands of cities       variety of domains including traffic monitoring systems where
in the future. SmartCities use technologies from a wide             users are asked to identify the volume of the traffic from their
range of origins, from fixed and mobile sensors to large-           corresponding location (such as in Waze3 or in CrowdAlert),
scale monitoring infrastructures, and can come from public or       or social feedback applications where users are asked to rate
private sources. These can provide advanced services such as        or recommend social venues such as bars and restaurants (e.g.,
smarter urban transport networks where sensors, cameras, and        Foursquare4 ), etc.
global positioning system (GPS) devices provide information            Thus, one important challenge in SmartCities is how reliable
on traffic, identifying congestion and recommending alternate       are the responses collected from the human crowd and what
routes to improve travel times and reduce emissions, resource       process is used to verify the received information. While
management processes (e.g., upgraded water supply and waste         crowdsourcing has proven to be a cost-effective approach
disposal facilities), and more efficient ways to light and heat     to soliciting input about an event, compared to traditional
buildings to optimize energy consumption in smart buildings.        methods such as employing human experts that check all data
   One significant tool in SmartCities is the use of ubiquitous     manually, humans are prone to errors which can greatly affect
citizens, acting as mobile human sensors, that are able to assist   the result of a crowdsourcing task. This is attributed to the
in responding to signals and providing real-time information        following two main factors: First, users have different abilities
about city events. Recently, several applications driven by city    which may be unknown to the task requester a priori, thus
authorities have emerged, such as the JRA Find and Fix app1         selecting the appropriate set of users to perform a task is not
where users report road related defects for the maintenance,
                                                                      2 http://crowdalert.aueb.gr
  1 http://www.jra.org.za/index.php/find-and-fix-mobile-app
                                                                      3 https://www.waze.com/

Copyright 978-1-5090-1169-8/16/$31.00 c 2016 IEEE                     4 https://foursquare.com/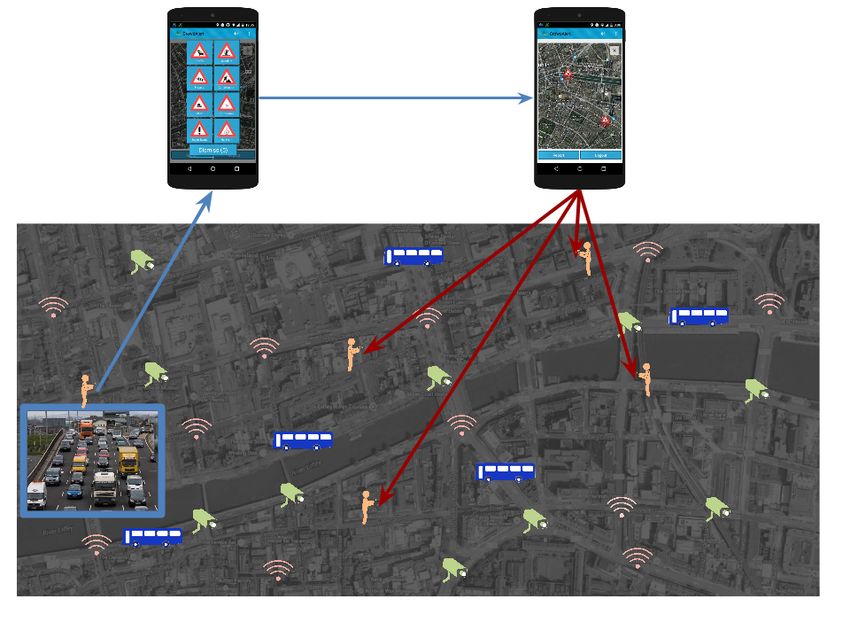
crowdsourced events reliably. We summarize our contributions
                                                                    below:
                                                                      •   We present REquEST, our approach that exploits the
                                                                          human crowd to perform crowdsourcing tasks in smart
                                                                          cities that involve ratings. The goal of REquEST is to
                                                                          approximate the rating that all users would provide using
                                                                          only a small set of users.
                                                                      •   REquEST aims to select human workers with minimal
                                                                          bias by examining the behavior of the users in their
                                                                          previously executed tasks. Moreover, it exploits linear
                                                                          regression to estimate user bias in each task and attempts
                                                                          to eliminate it when the user provides her rating, before
                                                                          aggregating the responses.
            Fig. 1. SmartCity Traffic Monitoring Paradigm.            •   We present experimental results to evaluate REquEST
                                                                          and we show that it can approximate the rating that all
an easy challenge. Second, verifying user responses obtained              users would provide with a minimal error, even when the
from a small set of mobile sensors is not easy since users                sample size is small.
typically provide only a few responses, as they require human
effort, which are subjective and might contain bias.                                      II. S YSTEM M ODEL
   In this paper we address the problem of reliable crowd-             We assume a crowdsourcing system comprising a set of
sourced event detection in SmartCities. We focus on selecting a     mobile users, denoted as u ∈ U , that act as human sensors and
small set of human users to perform tasks that involve ratings,     participate to the system through their mobile devices. Human
such as rating the traffic congestion or air pollution in their     workers register into the system to receive Crowdsourcing
geographical area. The challenge is how to select a subset of       tasks t ∈ T . Each human worker u is associated with the
users whose aggregated responses would closely approximate          following attributes: hidu , latu , longu , biasu , prevu []i, where
the final response that the entire set of users would provide.      idu is the worker’s unique identifier in the system, latu , longu
In order to provide accurate results we need to deal with the       correspond to the user’s current location in terms of latitude,
user bias of the selected users, since many recent examples         longitude, biasu represents the user bias which captures the
(e.g., political elections) indicate that the results may contain   likelihood of a user to make specific mistakes (this depends
a lot of noise when the bias is not considered properly, or         on user capabilities and expertise) when estimating the value
when the sample is not random. Thus, in our work we focus           of a task, and prevu [] is used to store information about the
on taking into account the user bias before aggregating the         tasks completed by the worker u.
user answers, and we show that such an approach has a great            In this work we focus on crowdsourcing tasks where users
improvement towards estimating the rating that the whole set        respond with a rating based on the issued query. Thus, every
of users would provide.                                             crowdsourcing task t ∈ T has the following attributes: hidt ,
   Recent works in the literature aim to identify a sample          latt , longt , descriptiont i, where idt is the identifier of task t,
from the human crowd to determine the most probable answer          latt and longt , represent the geographical location that the task
for each task [3], [4], while other works study the problem         refers to, and descriptiont contains the textual description of
of truth discovery in crowdsourcing systems [5], [6], [7].          the task, (e.g., Report the level of traffic congestion at your
However, our problem is radically different since we do             location from 1 (No Traffic) to 10 (Heavy Traffic)). Hence, in
not aim at determining the true answer among a set of               this example, each user will respond to the task with a rating
predefined answers. Since we deal with rating systems all           denoted as au,t with a value in the range of [1, 10]. We assume
answers might be subjective but they are truthful, and our          that users have their own biases and each bias is independent
goal is to determine the average rating that we would retrieve      of other users’ biases.
if all users participated. Task assignment approaches have also        Our goal is to identify the correct value for the task via
been proposed for crowdsourcing environments [8], [9], [10],        aggregating the responses received from all users queried
including work from our group [11], [12]. Although these            about the task. We denote as valtX the estimated value for
works aim at selecting a good set of users to perform tasks         task t, computed based on input from all users in set X. Since
based on individual user characteristics, they do not focus on      we focus on tasks that involve ratings, we assume that user
estimating quantitative values, such as ratings, and they do not    responses can be subjective but truthful. This corresponds to
consider user bias in the responses.                                behaviors where users express their own ideas and knowledge
   In this paper we present REquEST (Reliable crowdsourcEd          when labeling tasks, based on their personal abilities, char-
Event detection in SmartciTies), our approach to select the         acteristics and expertise. This occurs because users will be
most appropriate set of mobile human sensors to perform             subjective when they provide numerical responses (e.g., when
a task that minimizes the error and allow us to identify            rating traffic congestion or estimating rain precipitation).
8 obtained from the users. Unlike existing approaches, since we
6 focus on ratings, we are able to model bias as a linear function
Average Rating of the user responses which is more flexible and easier to
Difference from
4
2
compute at run-time.
0 The intuition in our approach is that user ratings have a
-2
bias, defined as a linear function of their answers with respect
-4
to the difference of their ratings from the average rating when
all users in U are considered. We visualize this relationship
-6
0 2 4 6 8 10 exploiting our dataset (further discussed in in the experimental
User Rating evaluation section), that contains ratings regarding the traffic
Fig. 2. User Bias.
conditions provided by human users. In figure 2 we show for
Problem Definition. In this work we aim at collecting a single user, who has provided the highest amount of ratings
input from multiple human sensors (workers) regarding an in our dataset, the relationship among her ratings compared to
ongoing event. Collecting responses mitigates these biases the difference of her ratings from the average rating for each
when collecting a large number of user responses and then task. This relationship can be captured with a linear function,
aggregating them to negate the effect of individual biases. We denoted as the user bias. We note that similar behavior exists
perform sampling on the user set to retrieve such information. in all users as well as in other datasets that capture rating that
Given the amount of users that we can query, our goal is to we have examined.
determine a set of users to sample that will allow us to estimate In our setting we assume that each user u ∈ S, selected
the output that we would get if all users were queried. More from the sampling process providesP an answer au,t with a
au,t
formally: bias b(au,t ) and thus: au,t = u∈U |U | + b(au,t ). The bias
Assume a set of human workers U located near the location b(au,t ) is defined as a linear function of the user response.
of task t: latt , lont . Our goal is to identify an appropriate set This enables us to estimate the difference from the average
of workers S ⊂ U to provide a response au,t ∀u ∈ S for task value for each user response au,t .
t, whose location latu , lonu is within a predefined threshold REquEST exploits linear regression to adjust the user bias
to the location of the queried task. We can then estimate the estimation whenever the user provides a response. Linear
final result valtS taking into account user biasu ∀u ∈ S in regression is a useful tool in many applications to find the
order to minimize the error compared P to the average rating hedge ratio between two assets. In our scenario these assets
au,t
obtained from all users in U : |valtS − u∈U |U | | → 0. After are defined from the user response au,t and its difference
S from the average value of the task. Thus, we record the
estimating valt , the system verifies the user responses and
re-estimates the biasu for each user that participated in the response au,t provided for each task and the respective
sampling process. difference from the average rating and we define the ratio
among these two dimensions. This is computed easily using
III. T HE RE QU EST APPROACH simple linear regression[18] that produces a linear function:
In this section we present our approach that aims at identi- b(au,t ) = µ∗au,t +ν where µ is the slope and ν is the interval
fying an appropriate subset of mobile human workers S that of the line, which are estimated from the linear regression.
will enable us to compute reliably the output of tast t. Once Thus, we can estimate the difference of each user rating
the human sensors are identified, we query them and retrieve compared to the average rating from all users by computing
their crowdsourcing answers au,t . Finally, we determine the b(au,t ) for each rating au,t .
output of the task while considering user biases, and use the Selecting users for the task. For each task we select among
estimated result to update the user biases. the nearby workers with minimal bias in their responses. Thus,
User Bias. Recent works have shown that users have bias we first extract the set of available users whose distance is
when responding to crowdsourcing tasks [13] and several smaller than a predefined threshold from the location of the
approaches have been proposed to eliminate bias from their event. Then, we select among those users that will provide
responses [14], [15], [16], [17]. However, existing approaches answers with minimal bias. Assuming that the list of possible
are not sufficient since (i) they either focus on binary re- ratings
P is defined as R, we compute for each user the score
sponses [14], [15] instead of numerical responses, (ii) they use ∀au,t ∈R |b(au,t )|, that accumulates the absolute difference
active learning approaches [13] which need several iterations of the user rating compared to the average rating retrieved
to converge, while in crowdsourcing processes users typically from all users, for each possible answer au,t . Hence, the score
answer sparsely, or (iii) they use hybrid models where the provides an estimation of the bias that the user may introduce
bias may depend either on the worker’s confusion matrix in her ratings and a small score implies minimal bias. Thus,
or on a population-wide representation that can introduce we select the top-K users with the smallest scores.
additional noise [17]. On the contrary, we propose an approach Computing the output of the task. The next step is to
that aims to eliminate user bias from the responses which determine the output of the task. As mentioned above, human
works efficiently even with a small set of numerical responses users have biases in their responses [13], and thus, we need to1600
1400
Amount of Answers
1200
1000
800
600
400
200
0
0 2 4 6 8 10
Ratings
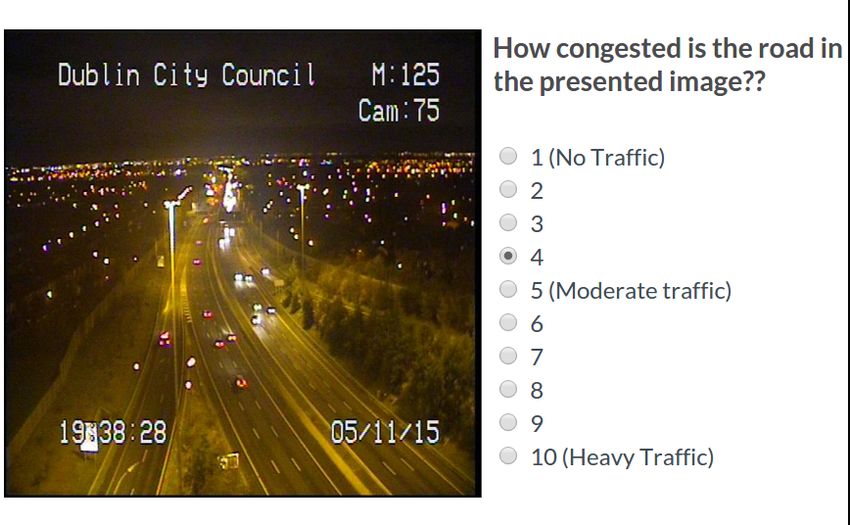
Fig. 3. Assigned Task Fig. 4. Amount of Answers for each Traffic Rating
compute the rating that all users would provide, subject to user tasks. We extracted 287 individual images from the traffic
biases. We compute the output of the task using the following cameras and we asked from users to classify traffic. An
equation: example of such a task as shown in figure 3. Thus, users are
P presented with an image out extracted from one of the 287
(au,t − b(au,t ))
valt = u∈S
S
(1) cameras and the following question “How congested is the
|S| road in the presented image?”, and then users respond with
Thus, we compute the average value of the retrieved ratings a rating from 1 (No Traffic) up to 10 (Heavy Traffic). We
after eliminating the estimated bias that each individual user received answers from 157 individual users that tagged from
introduces in her rating. 1 up to 100 individual images (different users can rate the
Updating user bias. Once we estimate the aggregate values, same image). Hence, our dataset consists of 10,070 individual
we update the function b(au,t ) for the users that participated in traffic ratings for the 287 traffic images.
the crowdsourcing task. This is achieved for each user u ∈ S In figure 4 we present the total amount of answers that
that provided an answer au,t by inserting the new rating and we retrieved for each of the ratings for all tasks. As can be
the respective difference from the estimated value valtS in the observed, “2” was the most common traffic rating, while most
set of user responses and perform linear regression to update of the ratings were between 1 (No Traffic) and 5 (Moderate
the parameters µ, ν. Traffic). This is because the majority of the traffic images do
Since our approach assumes that we should estimate the not capture heavy traffic or congestion.
correlation among users, we may face bootstrapping issues. Additionally, we present in figure 5 the average rating,
Thus, in the first iterations of assigning crowdsourcing tasks, provided by the users, for each individual task. As can be
we can select some users randomly in order to train the system observed, 38% of the traffic images is rated within Moderate
with their answers. and Heavy Traffic; these are the images that the city personnel
should take into account when managing the city traffic.
IV. E XPERIMENTS Figure 6 illustrates the average rating for the tasks per-
For our experiments we have developed a dataset that formed by each individual user. As the figure shows, the
includes user ratings for a number of images related to traffic majority of the users provide ratings with a small bias on av-
events. The images are extracted from traffic cameras provided erage (users with identifiers between 30 and 120), while other
by the Dublin City Council (DCC), the local authority in users seem to underestimate traffic (120-157) or overestimate
Dublin that manages traffic. traffic (0-30). These users prove that bias should be taken into
DCC maintains approximately 270 traffic cameras located account when aggregating user ratings since their responses
throughout the city that provide images every 10 minutes. are different from the majority of the users.
Thus, it is impossible for a human operator to manually check In the following we evaluate our approach in terms of
all images to identify whether there are traffic events and also efficiency to accurately determine the response that users from
classify the types of traffic events. On the other hand, users a small sample would provide. In order to achieve that, we use
can easily tag the traffic in their own location and automate the the root mean square error (RMSE) to evaluate the accuracy
procedure for DCC. However, as users have bias we cannot which is defined as:
trust each individual response, but given a sample of ratings
s
we are able to compute the traffic rating that all users would
P
1 X u∈Ut au,t
provide. We have implemented our REquEST approach in RM SE = (valtS − )2
|T | t |Ut |
Java. We performed the experiments on an Intel Core i7 PC
with 16GB of RAM, that provides a controlled environment. where Ut represents the complete set of users in our dataset
In order to extract traffic ratings from real human users that have rated task t. We use the RMSE metric as it penal-
we performed the following experiment in the CrowdFlower izes large errors more and a smaller RMSE indicates better
platform [19] that employs users to perform crowdsourcing performance.10 7.5
9 7
6.5
8
Average Rating
Average Rating
6
7 5.5
6 5
5 4.5
4 4
3.5
3
3
2 2.5
1 2
0 50 100 150 200 250 300 0 20 40 60 80 100 120 140 160
Camera Images Users
Fig. 5. Average Rating per Traffic Camera Image Fig. 6. Average Rating per User
Random Sampling Random Sampling
Average from Users with Low Bias Average from Users with Low Bias
REquEST REquEST
0.7 0.34
0.6 0.32
0.3
0.5 0.28
RMSE
RMSE
0.4 0.26
0.3 0.24
0.22
0.2 0.2
0.1 0.18
5 10 15 20 25 30 35 40 45 100 150 200 250
Sample Size User Population
Fig. 7. Evaluation on Varying Sample Size Fig. 8. Evaluation on Varying Total Users
We compare REquEST in terms of RMSE with the follow- V. R ELATED W ORK
ing baseline approaches: (i) Random Sampling, that queries
a random set of users and computes their average rating, Several approaches have been proposed in the literature for
(ii) Average from Users with Low Bias, that exploits our task assignment in crowdsourcing environments, including our
approach to select the set of users to be queried and computes previous work [11] [12] that aims to assign tasks to humans
their average value without considering regression to eliminate in order to satisfy reliability and real-time requirements. Other
bias. The experimental evaluation focuses on evaluating the approaches that consider user reliability have focused on
benefit of our approach compared to the baselines, when minimizing the number of task assignments to fulfill an overall
varying the Sample size and the Set of Total Users. reliability constraint [8], selecting users based on their quality
[9] and considering human factors, such as expertise, wage
Figure 7 presents the RMSE score for the traffic images requirements and availability [10]. However, in our setting
under various numbers of sample size (5-45). Obviously, we assume tasks where the answers can be subjective and
the RMSE decreases as we increase the sample size for thus all user responses can be considered as reliable, although
all approaches. However, as can be observed, our approach they may variate a lot. Moreover, while these works focus on
manages to improve the RMSE in all cases, especially when selecting a good (reliable) sample to perform the tasks, they do
the sample size is small. Thus, for a sample size of 5 users not focus on estimating quantitative values, such as the rating
the Random Sampling performed a value of RMSE of 0.69, that the whole set of users would provide for a data item, and
the Average from Users with Low Bias performed 0.56, while also they do not consider the user bias in their responses.
REquEST performed 0.48.
Existing works have also studied the problem of selecting
In figure 8 we illustrate how RMSE behaves when we keep a sample of users. Authors in [3] aim at selecting a sample
the sample size to 25 users, but we vary the amount of total of reliable users to approximate the crowd’s majority vote
users from 100 to 250 out of 287 users who are available in by collecting opinions from a subset of the crowd. However,
total. As can be observed, our approach outperforms the two they do not consider the user bias and our goal is different
baselines in all cases. Moreover, it is clear that the Random as we aim at approximating the solution of the aggregation
Sampling approach is only slightly affected by the amount based on all user responses. Daly et al. in [4] also select a
of total users, while the other two approaches that aim to small subset of the users to respond based on their individual
select good workers improve their performance as more users characteristics (reputation, mobility, etc.) but they do not focus
become available. Hence, the approach that computes the on representing the whole set of human users.
Average from Users with Low Bias improves the RMSE from Active learning approaches have also been proposed for
0.32 (100 users) to 0.22 (250 users), while REquEST reduces truth discovery in crowdsourcing systems. Authors in [5]
the RMSE from 0.25 for 100 users to 0.18 for 250 users. capture the sources of bias by describing labelers influencedby random effects and propose an active learning approach and processes them to estimate the response that we would get
to learn the model. Similarly, in [6] they aim to learn the if all users would participate. Our experimental results show
expertise and reliability of each user based on Gibbs Sampling that our approach is effective and has minimal error.
to estimate the true answer of a task, while in [20] they propose
ACKNOWLEDGMENT
an approach, based on Gibbs Sampling, to determine whether
an event occurs in a spatial area, according to crowdsourcing This research has been financed by the European Union through
the FP7 ERC IDEAS 308019 NGHCS project and the Horizon2020
reports. However, all previous approaches have no control 688380 VaVeL project.
on the user selection and they need a lot of iterations until
the model converges which is unrealistic for crowdsourcing R EFERENCES
environments where most of the users are transient. [1] A. Artikis, M. Weidlich, F. Schnitzler, I. Boutsis, T. Liebig, N. Pi-
In [21] they aim to estimate the reliability of crowd-workers, atkowski, C. Bockermann, K. Morik, V. Kalogeraki, J. Marecek, A. Gal,
S. Mannor, D. Gunopulos, and D. Kinane, “Heterogeneous stream
the difficulty of the different tasks, and the probability of the processing and crowdsourcing for urban traffic management,” in EDBT,
true labels using a unified model. However, they focus on Athens, Greece, March 2014, pp. 712–723.
labeling items rather than ratings which implies subjective [2] N. Zacheilas, V. Kalogeraki, N. Zygouras, N. Panagiotou, and D. Gunop-
ulos, “Elastic complex event processing exploiting prediction,” in Big
but truthful responses. Authors in [22] integrate machine Data, Santa Clara, CA, Oct 2015, pp. 213–222.
learning techniques into crowdsourced databases to minimize [3] Ş. Ertekin, C. Rudin, and H. Hirsh, “Approximating the crowd,” Data
the number of questions asked to the crowd, allowing crowd- Mining and Knowledge Discovery, vol. 28, no. 5-6, 2014.
sourced applications to scale. However, in case of inappropri- [4] E. Daly, M. Berlingerio, and F. Schnitzler, “Crowd sourcing, with a
few answers: Recommending commuters for traffic updates,” in RecSys,
ate workers the variance can be high, causing the system to Vienna, Austria, September 2015, pp. 253–256.
ask too many questions or provide erroneous responses. [5] F. L. Wauthier and M. I. Jordan, “Bayesian bias mitigation for crowd-
Techniques that aim to estimate user biases in crowdsourc- sourcing,” in NIPS, 2011, pp. 1800–1808.
[6] F. Ma, Y. Li, Q. Li, M. Qiu, J. Gao, S. Zhi, L. Su, B. Zhao, H. Ji, and
ing environments have recently been proposed in the literature. J. Han, “Faitcrowd: Fine grained truth discovery for crowdsourced data
In [14], [15] they study the data annotation bias when data aggregation,” in KDD, Sydney, Australia, August 2015, pp. 745–754.
items are presented as batches to the workers. However, [7] S. Zhi, B. Zhao, W. Tong, J. Gao, D. Yu, H. Ji, and J. Han, “Modeling
they focus on binary answers and their goal is to correctly truth existence in truth discovery,” in KDD, Sydney, Australia, Aug 2015.
[8] D. R. Karger, S. Oh, and D. Shah, “Iterative learning for reliable
categorize each data item instead of estimating the aggregated crowdsourcing systems,” in NIPS, Granada, Spain, December 2011.
response that all users would provide. Authors in [13] show [9] R. Khazankin, H. Psaier, D. Schall, and S. Dustdar, “Qos-based task
that crowdsourcing users have both bias and variance and they scheduling in crowdsourcing environments,” in ICSOC, Paphos, Cyprus,
December 2011, pp. 297–311.
propose an approach to recover the true quantity values for
[10] S. B. Roy, I. Lykourentzou, S. Thirumuruganathan, S. Amer-Yahia,
crowdsourcing tasks. However, their approach needs several and G. Das, “Task assignment optimization in knowledge-intensive
iterations (tasks) to converge which is a strong assumption for crowdsourcing,” The VLDB Journal, pp. 1–25, 2015.
crowdsourcing and they focus on debiasing existing responses [11] I. Boutsis and V. Kalogeraki, “On task assignment for real-time reliable
crowdsourcing,” in ICDCS, Madrid, Spain, June 2014, pp. 1–10.
rather than estimating the response that would be provided [12] ——, “Crowdsourcing under real-time constraints,” in IPDPS, Boston,
from all users. Authors in [17] aim to solve the above MA, May 2013, pp. 753–764.
problem by using a hybrid approach where the user bias [13] R. W. Ouyang, L. Kaplan, P. Martin, A. Toniolo, M. Srivastava, and
depends heavily on a unified population-wide representation T. J. Norman, “Debiasing crowdsourced quantitative characteristics in
local businesses and services,” in IPSN, Seattle, WA, April 2015.
for workers with small number of reports and uses an accurate [14] H. Zhuang, A. Parameswaran, D. Roth, and J. Han, “Debiasing crowd-
worker confusion matrix for each worker with a large number sourced batches,” August 2015.
of reports. On the contrary, in REquEST, user bias depends on [15] H. Zhuang and J. Young, “Leveraging in-batch annotation bias for
crowdsourced active learning,” in WSDM, Shanghai, China, Jan 2015.
the user responses even for a small number of responses, due to [16] A. Das, S. Gollapudi, R. Panigrahy, and M. Salek, “Debiasing social
our flexible representation of user bias, since a population wide wisdom,” in KDD, Chicago, IL, August 2013, pp. 500–508.
representation might introduce additional noise. Das et al. in [17] E. Kamar, A. Kapoo, and E. Horvitz, “Identifying and Accounting for
[16] focus on debiasing crowdsourcing answers to estimate the Task-Dependent Bias in Crowdsourcing,” in HCOMP, San Diego, USA,
November 2015.
average innate opinion of the social crowd with a small number [18] D. C. Montgomery, E. A. Peck, and G. G. Vining, Introduction to linear
of samples. However, their approach depends on the social regression analysis. John Wiley & Sons, 2015.
dependency among users that does not exist in our setting. In [19] “CrowdFlower.” [Online]. Available: http://crowdflower.com/
[23] they investigate a game-theoretic scheme that motivates [20] R. W. Ouyang, M. Srivastava, A. Toniolo, and T. J. Norman, “Truth dis-
covery in crowdsourced detection of spatial events,” in CIKM, Shanghai,
users with monetary rewards to counter bias, but they assume China, November 2014, pp. 461–470.
that bias is introduced when users adopt heuristic strategies to [21] J. Whitehill, T.-f. Wu, J. Bergsma, J. R. Movellan, and P. L. Ruvolo,
solve the task, while we assume that users answer subjectively. “Whose vote should count more: Optimal integration of labels from
labelers of unknown expertise,” in NIPS, December 2009.
VI. C ONCLUSIONS [22] B. Mozafari, P. Sarkar, M. Franklin, M. Jordan, and S. Madden, “Scaling
up crowd-sourcing to very large datasets: a case for active learning,”
The paper presents REquEST, our approach to reliable Proceedings of the VLDB Endowment, vol. 8, no. 2, pp. 125–136, 2014.
crowdsourced event detection in smart cities. We present a [23] B. Faltings, P. Pu, B. D. Tran, and R. Jurca, “Incentives to Counter
Bias in Human Computation,” in HCOMP, Pittsburgh, USA, 2014, pp.
methodology that selects a sample of mobile sensors from the 59–66.
human crowd to acquire their responses for a specific event,You can also read