The challenge of increasing safe response of antivirus software users
←
→
Page content transcription
If your browser does not render page correctly, please read the page content below
The challenge of increasing safe response of
              antivirus software users

                Vlasta Stavova, Vashek Matyas, Kamil Malinka

          CRoCS Laboratory, Faculty of Informatics, Masaryk University
                      {vlasta.stavova@mail.muni.cz,
                             matyas@fi.muni.cz,
                           malinka@ics.muni.cz}

      Abstract. While antivirus software is an essential part of nearly every
      computer, users often ignore its warnings and they are often unable to
      make a safe response when interacting with antivirus software. The aim
      of our study was to find working connections to increase a number of
      mobile device users who select a premium license with more security
      features over a free license with a limited level of security. We cooperated
      with the antivirus company ESET and more than fourteen thousand
      users participated in first phase of our experiment. We tested two new
      types of a user dialog on the Android platform. The first user dialog was
      designed with a text change and the other with a new button “Ask later”.
      As a result, we found out that the text change increased the number of
      premium license purchases by 66% in the first phase of our experiment,
      the version with the “Ask later” button increased this number by 25%
      in the same period.

1   Introduction
User security often depends on user’s ability to comprehend information and
warnings. Since a user is the weakest point of the security chain, it is crucial to
empower him/her to make informed decisions when cooperating with security
software.
    Our study aimed to find working connections between user dialog design and
user security behavior when using certain components of antivirus software. We
have been undertaking experiment in cooperation with a company developing
antivirus software, ESET. Cooperation with the company brings us a benefit of
real life experiment participants. Unlike many other studies [1, 2] whose results
were based on participants recruited among students or Amazon Mechanical
Turk users, our study is based on real product users.
    Our team consists of experts from three faculties of Masaryk University.
People from Faculty of Informatics, Faculty of Social Studies and Faculty of
Law have been involved. This innovative connection brings a multidisciplinary
view into the experiment.
    Our challenge is to increase overall user security by empowering the user
to make a qualified decision on the use of antivirus software on the Android
platform. Thus, we designed an experiment where we made changes in the user
dialog offering the upgrade to the one-year premium license after a trial version
has expired. The effect is measured by monitoring a conversion rate of the prod-
uct. The conversion rate is defined as a percentage of customers who opted for
the one-year premium license out of all users. Despite all effort provided by the
company so far, the conversion rate on the Android platform is still low. Our
challenge is to increase this number by changes in the user dialog offering the
upgrade to the one-year premium license after a trial version has expired. The
second chapter is focused on related work in visual warning design and persua-
sive approach. The third chapter describes our experiment design. The fourth
chapter concludes with experiment results and observations.
2 Related work
User dialogs and warnings design has its place in the field of security. Despite an
increasing trend of automatic decisions, there are still many problems that must
be decided by a user himself. Since the user sees dozens of warnings and user
dialogs every day, a general blindness to them is widely observed simply due to
a process of habituation [3].
There is a common term “safe response” used for a choice that brings security
benefits to the user [4]. A user dialog is considered to be successful when the
safe response was selected by the user. There is a question that has been asked
for many times. How to empower the user to select the safe response?
2.1 Best practises in visual warning design
An effective warning structure consists of a signal word to attract atten-
tion, identification of the hazard, explanation of consequences and directives for
avoiding the hazard [5]. The other approach prefers a different structure. A good
warning should contain a signal word panel with signal words, color coding and
an alert symbol [6]. Since the structure is not enough to increase the power of
warning, use of attractors is recommended.
Attractors are parts of warnings or user dialogs serving to attract user
attention [7]. Wogalter [8] recommended to add a bold type in contrast with a
standard type or to add a color in contrast with a background. Especially red and
yellow are very good in increasing readability [9]. Pictorial symbols in contrast
with rest of background, special effects, frames, personalization and dynamic
elements also work as good attractors.
Some user dialog designs become successful, but with a great loss of usabil-
ity. For example, authors in the study [7] proved that the user dialog with the
greatest influence requires rewriting the most important word of the whole user
dialog by a user himself. Since text rewriting makes the whole process very slow,
this approach is not recommended to be widely used. Other good user dialog
designs highlight important text of the warning and make the user to swipe itwith his mouse or simply add 10 second delay before a decision can be made. All
these features inhibit the user and empower him to comprehend the text better.
Providing an explanation is a tricky question. The study [7] proved that
a detailed explanation serves as a bad attractor, but other authors [10] pointed
out that a warning with a “purpose string” has a higher impact on a user over
the warning without any purpose. Surprisingly, an effect of different content in
a purpose string is statistically insignificant. When a hazard is communicated
in an explanation, the description should be specific, complete and the most
important risks should come first [8].
Text structure also influences warning effectiveness. Many studies have
shown that warnings in bullets or in an outline form are considered more readable
than a continuous text [11]. A common fact is that people are not reading the
texts, they are scanning them. Rules following from this observation are: putting
most important content first, avoid being vague, get to the point quickly and
structure the text [12]. Eye tracking studies proved that the area where users
really read has the F-shaped pattern [13]. They read first one or two paragraphs
at the top of the text and then briefly scan down in the nearly similar shape
that the letter F has.
2.2 Persuasive approach
Apart from visual principles, a persuasive approach is also involved in our study.
Persuasion can be defined as a set of influence strategies based on inner human
reactions and needs. Cialdini [14] introduces six basic principles of persuasion.
These principles are: Reciprocity, Commitment, Social Proof, Liking, Scarcity
and Authority.
– Reciprocity says that people tend to reciprocate behavior towards them.
– Commitment speaks about fact that people like being consistent in their
opinions and decisions. People who did a favor for something in past, tend
to do same favor in future because they feel obliged to do so.
– Social proof principle is simply declaring “safety is in numbers”. People in
an ambiguous situation tend to behave similarly as the majority.
– Liking says that we are more influenced by people who are similar to us.
For example, they like same things as we do.
– Scarcity says that rare objects are more desired by people than the widely
available ones.
– Authority emphasizes that we are easily persuaded by people who speak
to us from the position of authority.
The decoy effect is also involved in persuasive approach. It describes a
change in user preferences after an introduction of a decoy option. When a user
decides between two equally selected options (if presented on their own) and the
decoy option is introduced, consequently one option looks more favorable and
the user tends to prefer it over the other. Dan Ariely in his book [15] describes
an experiment to illustrate the decoy effect. The study was conducted on MITstudents. They should have selected the most favorable offer of a newspaper
subscription. The first offer was to buy the online newspaper subscription for $59.
The second offer was to buy the newspaper subscription in a paper version for
$125. The third offer was to buy both paper and online newspaper subscription
for $125. The middle offer ($125 for the paper version) then seems without sense,
because it is very unfavorable for a customer, but it has large impact on a user
decision strategy. It serves as a decoy offer.
When respondents were selecting from the first and third offer only, they
preferred the first offer (68 picked the first offer and only 32 the third offer)
mostly. When the experiment settings changed, the decoy offer was introduced,
and respondents were selecting from first, second and third offer, they preferred
mostly the third one (more than 80 out of 100 picked that offer). We can observe
that adding the decoy option changed the user’s decision and influence him to
pick a different offer.
The book [15] also mentions the power of the word “free”. When something
can be obtained without money, it is far more attractive than when it costs $1
or any similar small price. Word “free” works as a very powerful attractor.
People do not like making decisions and also prefer to make changeable deci-
sions over the unchangeable ones. They do not want to lose any possibility [16].
3 Experiment design decisions
Our experiment was divided into two phases. First, initial phase started in De-
cember 2014, and was stopped on the first of April, and the inflow of results
slowly came to an end by early May. A zero variant together with first and sec-
ond variants were tested. The follow-up phase started in May 2015. Based on
results from the first phase, where the most successful variant was that with a
text change, we applied this text change to all variants tested in the follow-up
phase. Moreover, a questionnaire about a smart phone use was included. Initial
phase participants were English-speaking antivirus users mostly from USA and
UK. The follow-up phase was designed in four language versions – English, Ger-
man, Czech and Slovak. Results of the follow-up phase will be available at the
end of 2015. We focused on the product’s user dialog that appears after a trial
license expired. Unfortunately, we can not influence several other factors, for
example marketing campaigns running in different countries differently or users’
satisfaction with the product. Similarly, we can not influence the overall product
workflow – there are several ways to buy the premium license and several ways
to reach this user dialog.
Experiment limitations
Unfortunately, we could not follow several good principles that have been al-
ready introduced due to several limitations that follow from cooperation with
the company.Limitations reflecting company specific requirements must be taken into ac-
count. Only minor changes could be done in a GUI because a complete redesign
was ruled out by the company. We also can not influence the whole workflow or
anything out of the scope of the user dialog. Several variants can not be tested
due to system limitation because implementation in the system would be costly
or impossible. Some variants were canceled due to unexpected turn of events. For
example, to increase attractiveness of buying the premium license, we used the
principle of Reciprocity and designed a user dialog offering “something more” in
addition to the user who bought the premium license, in our case it was a charity
donation. Due to excessive bureaucracy connected with the donation, company
ruled out this variant.
Principles used in design
We also made a descriptive text redesign to increase its readability and compre-
hension. We have used several mentioned visual design principles. As attractors
we used only those that do not influence overall usability of the system. Large
attractors were ruled out by the company because flashing, framing or aggres-
sive colors do not fit the company visual style. So as an attractor we used the
bold type that stresses important information which should not be overlooked
by user.
As for the persuasion principle use, we added a decoy option that should
give special preference to buying the premium license over using free version.
The decoy option pricing was set after a negotiation with the company. We also
have used principle of postponing the decision by implementing the button “Ask
later”. Principle of reciprocity to invoke a feeling of an obligation was used in a
last variant.
Variants in consideration
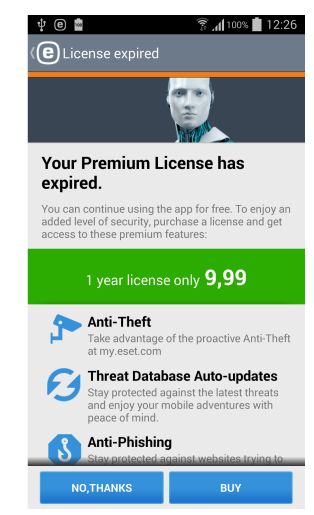
The initial screen (Figure 1) contains a descriptive text, an offer to buy an
one-year license, description of the one-year license features and action buttons.
The descriptive text was: “You can continue using the app for free. To enjoy
an added level of security, purchase a license and get access to these premium
features:” The redesigned text is: “To continue with highest level of security,
purchase your license and get access to these premium features:” We redesigned
the text to make it shorter and better understandable for a user. The word “free”
was removed because it stresses an undesired option of not buying the premium
license.
The features description was also redesigned to be more concrete, because
users with lack of technical skills may have difficulties to understand what general
features description represents. Thus we pinpoint illustrative subset of function-
ality for each feature. For example, instead of Take advantage of the proactive
Anti-Theft at my eset.com we recommended Locate your missing device at my
eset.com.Fig. 1. The initial user dialog encouraging a user to buy the one-year license. Initial experiment variants – Var. 0 is an initial variant with no change. – Var. 1 uses the new redesigned text instead of the old one. – Var. 2 implements a button “Ask later” due to an assumption that some people do not like quick decisions and may want to make an installation later. The text remained the same. There are three buttons on the screen – “Buy”, “No, thanks” and “Ask later”. When a user presses “Ask later”, the screen appears again after a couple of days. Button “Ask later” can be pressed 3 times at most. After the third “Ask later” pressing, the screen never appears again. Following variants are currently involved in the follow-up phase. All variants contain also the text change taken from the first variant. – Var. 3 uses a principle of adding the decoy option next to the standard one. In this option a basic version is for free, a three-month license for $4.99 (the decoy option) and a one-year license for $9.99. – Var. 4 uses the same principle as in the first variant. In this option a basic version is for free, a one-year license for $9.99 (the decoy option) and a two-year license for $14.99.
– Var. 5 introduces a principle of reciprocity and experiments with a business
      model “Pay what you can” where the user can select among three prices
      for the same antivirus product. Users have used an antivirus trial version
      for free and we assume that they may feel “obliged” to the company and
      buy a license. The user is asked to value his/her security and user can select
      a price he/she wants to pay for the product out of the three offers ($6.99,
      $9.99, $12.99).

Technical solution of initial experiment: Only English speaking customers were
involved in the study, an estimated number of respondents was 500 users per the
variant. Finally, we got 14,142 participants in total after three months. Following
attributes were logged in company’s systems. Unfortunately, we had no other
information source (for example user questionnaire) to gain more information
about product users in this phase.
    –   Variant of the screen displayed.
    –   User’s country.
    –   Summed time spent on “Premium expired screen”.
    –   User tapped “Buy” button (yes/no).
    –   User actually bought the license (yes/no).
    –   Final decision (yes/no).
    –   Number of “Ask later” decisions (if applicable).
    –   Date – screen displayed for the first time.
    –   Date – user bought the license.
    –   Date – user tapped “No, thanks”.
    –   Device manufacturer.
    –   Device resolution.
    –   Device model.
    –   Android version.

4       Results and observations
The initial experiment ran from December 2014 to early May 2015. However,
there was a marketing campaign in early March 2015. Our analyses of the data
showed that this campaign had a significant impact, the trends observed from
the data from first three months of experiment (December 2014 to early March
2015) are completely different from trends observed afterwards. We are currently
(September 2015) investigating details of this marketing campaign, but we did
not come to a rational explanation and conclusion of the causes and consequences
in detail. The zero variant together with the first and the second variant were
tested in the first phase. Results are described in Table 2. Participants were
English speaking users of trial antivirus software running on the Android plat-
form. All variants were randomly distributed among countries, manufacturers
and device users to gain an equal representation. There were 14,142 partici-
pants in total. Half of them came from USA (49.1%). Others came mostly from
UK (33.1%) or India (5.9%). Nearly 90% of them use antivirus in their mobile
phones, only 10% in tablets. As for device manufacturers, nearly half of them use
Samsung (48.8%). The other half is split among many producers, for example
Sony (7.4%) or HTC (5.3%).
Table 1. Crosstable of results at the end of December 2014.
Purchased Not purchased Total
Purchased Not purchased
Var. 0 34 1,099 1,133
Var. 0 1.96% 98.04%
Var. 1 52 1,114 1,166
Var. 1 3.18% 96.82%
Var. 2 36 960 996
Var. 2 2.65% 97.35%
Total 122 3,173 3,295
Table 2. Crosstable of results in early March 2015.
Purchased Not purchased Total
Purchased Not purchased
Var. 0 77 4,780 4,857
Var. 0 1.59% 98.41%
Var. 1 125 4,731 4,856
Var. 1 2.64% 97.36%
Var. 2 87 4,342 4,429
Var. 2 2% 98%
Total 289 13,853 14,142
We set up a null hypothesis claiming that there is no difference in a number
of purchases among variants. An alternative hypothesis was claiming that the
difference exists.
We have conducted a Pearson Chi-Square test (χ2 =12.062, p < .05, df=2).
[17] Since the p-value is less than the significance level .05, we rejected the null
hypothesis in favor of the alternative hypothesis and proved a difference in the
number of purchases among variants.
We made a post-hoc analysis among variants based on arcsine transformation
of each variant. At the significance level α=.05 we have proved difference between
the zero variant and the first variant. The difference between the zero variant
and the second variant was not statistically significant.We proved that a simple text change can provide a clearer presentation of
security benefits to the user and lead to an increased uptake of a more advanced
security solution.
Other observations
Observing the data, we can see interesting trends in increase and decrease of
obtaining the license. Comparing the first variant with the zero variant, the first
variant has 62% increase in getting the license over the zero variant in December
(Table 1) this trend continued to early March when the increase was also about
66%. Comparing the zero variant with the second variant, the second variant has
35% increase in December but only 25% increase in early March 2015. December
increase in obtaining the premium license was quite likely influenced by overall
Christmas shopping spree.
Average time spend on the screen is same for all variants. It is good news
for the company that new variants do not imply any delay for users. We can
observe that customers who bought the license spend more time on the screen
than customers who did not.
We have observed that people who bought the license via the second variant
did not use the button “Ask later” mostly. 96.2% out of all customers who
obtained the license after being exposed to the second variant did not used
the button “Ask later”. 3.5% used the “Ask later” button once. Only one user
obtained a license after pressing “Ask later” twice. The current results indicate
(while still not being statistically significant) that postponing the decision does
not lead to purchase in a future.
We made also several observations based on the other attributes of collected
data. All are at the significance level α = 0.05.
– There is a statistically significant difference in a number of purchases in India
and USA (χ2 =15.86, p < .001, df=1), and India and UK (χ2 =11.813, p <
.001, df=1). Users from USA and UK purchase statistically more than users
from India.
– There is a statistically significant difference between zero and first variant
among USA users (χ2 =13.98, p < .001, df=1), whereas UK users do not
prefer any of variants significantly.
– Tablet users buy a license more often (statistically significant) than non-
tablet users (χ2 =42.586, p < .001, df=1). Average conversion rate for tablet
users is 4.4%, whereas for non-tablet users is 1.78%. There are no statistically
significant preferences in variants among tablet users, but non-tablet users
prefer the first variant significantly more.
– Comparing manufacturers who are represented by at least 500 participants,
the highest conversion rate was observed for users of LG (3.27%), Samsung
(3.06%) and Motorola (2.92%), whereas the lowest rate was observed for
Huawei customers (around 0.2%). There is also a statistically significant dif-
ference in purchases among Huawei and any of the following manufacturers:
Sony, Samsung, Motorola, LG. We also have observed statistically significantpreferences among zero and first variant in HTC (χ2 =7.631, p < .005, df=1)
and Samsung (χ2 =4.264, p < .05, df=1).
Conclusion
Our task was to increase user security by empowering him/her to select the safe
choice and obtain the premium license that offers more security features than the
free license. We have cooperated with the antivirus company ESET and 14,142
real users of their product participated in our experiment. We have rejected
the null hypothesis claiming that there is no difference in a number of purchases
among variants (p < .05). When comparing the number of purchases of the same
version of software with better security features description, a slight difference in
presenting the features implies a 62% (December) and 66% (March) increase in
purchases as a result of using the first variant. The difference between the zero
variant and the first variant with the text change was statistically significant at
the significance level α=.05. Increase in the number of purchases by implement-
ing the button “Ask later” was about 35% in December and 25% in March, but
not enough to be statistically significant. Based on results and observations, we
decided to use a text change for all variants in the follow-up experiment.
Considering limitations of our experiment, we focused strongly on user di-
alogs in our study and we did not take into consideration a lot of other related
issues. For example, the conversion rate on the Android platform is quite likely
influenced not only by the user dialog, but also with overall satisfaction with the
product and with the complex product workflow which offers many ways to buy
a product.
References
1. J. Sunshine, S. Egelman, H. Almuhimedi, N. Atri, and L. F. Cranor, “Crying wolf:
An empirical study of ssl warning effectiveness.,” in USENIX Security Symposium,
pp. 399–416, 2009.
2. A. Sotirakopoulos, K. Hawkey, and K. Beznosov, “On the challenges in usable
security lab studies: lessons learned from replicating a study on ssl warnings,” in
Proceedings of the Seventh Symposium on Usable Privacy and Security, p. 3, ACM,
2011.
3. T. Amer and J.-M. B. Maris, “Signal words and signal icons in application control
and information technology exception messages-hazard matching and habituation
effects,” Journal of Information Systems, vol. 21, no. 2, pp. 1–25, 2007.
4. C. Bravo-Lillo, L. Cranor, J. Downs, S. Komanduri, and M. Sleeper, “Improving
computer security dialogs,” in Human-Computer Interaction – INTERACT 2011
(P. Campos, N. Graham, J. Jorge, N. Nunes, P. Palanque, and M. Winckler, eds.),
vol. 6949 of Lecture Notes in Computer Science, pp. 18–35, Springer Berlin Hei-
delberg, 2011.
5. M. S. Wogalter, D. R. Desaulniers, and J. W. Brelsford, “Consumer products: How
are the hazards perceived?,” Proceedings of the Human Factors and Ergonomics
Society Annual Meeting, vol. 31, no. 5, pp. 615–619, 1987.6. M. Wogalter, Handbook of Warnings. Human Factors and Ergonomics, Taylor &
Francis, 2006.
7. C. Bravo-Lillo, S. Komanduri, L. F. Cranor, R. W. Reeder, M. Sleeper, J. Downs,
and S. Schechter, “Your Attention Please: Designing Security-decision UIs to Make
Genuine Risks Harder to Ignore,” in Proceedings of the Ninth Symposium on Usable
Privacy and Security, SOUPS ’13, (New York, NY, USA), pp. 6:1–6:12, ACM, 2013.
8. M. S. Wogalter, V. C. Conzola, and T. L. Smith-Jackson, “Research-based guide-
lines for warning design and evaluation,” Appl. Ergon., vol. 33, pp. 219–230, May
2002.
9. P. B. Kline, C. C. Braun, N. Peterson, and N. C. Silver, “The impact of color
on warnings research,” Proceedings of the Human Factors and Ergonomics Society
Annual Meeting, vol. 37, no. 14, pp. 940–944, 1993.
10. J. Tan, K. Nguyen, M. Theodorides, H. Negrón-Arroyo, C. Thompson, S. Egelman,
and D. Wagner, “The effect of developer-specified explanations for permission re-
quests on smartphone user behavior,” in Proceedings of the SIGCHI Conference on
Human Factors in Computing Systems, CHI ’14, (New York, NY, USA), pp. 91–
100, ACM, 2014.
11. E. N. Wiebe, E. F. Shaver, and M. S. Wogalter, “People’s beliefs about the internet:
Surveying the positive and negative aspects,” Proceedings of the Human Factors
and Ergonomics Society Annual Meeting, vol. 45, no. 15, pp. 1186–1190, 2001.
12. J. Nielsen, “How users read on the web.” http://www.nngroup.com/articles/
how-users-read-on-the-web/, 1997. Accessed: 2014-12-01.
13. J. Nielsen, “F-shaped pattern for reading web content.” http://www.nngroup.com/
articles/f-shaped-pattern-reading-web-content/, 2006. Accessed: 2014-12-
01.
14. R. Cialdini, Influence: The Psychology of Persuasion. HarperCollins, 2009.
15. D. Ariely, Predictably Irrational, Revised and Expanded Edition: The Hidden Forces
That Shape Our Decisions. Harper Perennial, Harper Collins, 2010.
16. D. T. Gilbert and J. E. Ebert, “Decisions and revisions: the affective forecasting of
changeable outcomes.,” Journal of personality and social psychology, vol. 82, no. 4,
p. 503, 2002.
17. G. Corder and D. Foreman, Nonparametric Statistics: A Step-by-Step Approach.
Wiley, 2014.You can also read