REPORT SMART SPEAKER CONSUMER ADOPTION - Voicebot.ai
←
→
Page content transcription
If your browser does not render page correctly, please read the page content below

SMART SPEAKER
    GIVING VOICE TO A REVOLUTION
                                   CONSUMER ADOPTION

                                   REPORT
                                   MARCH 2018

SPONSORED BY: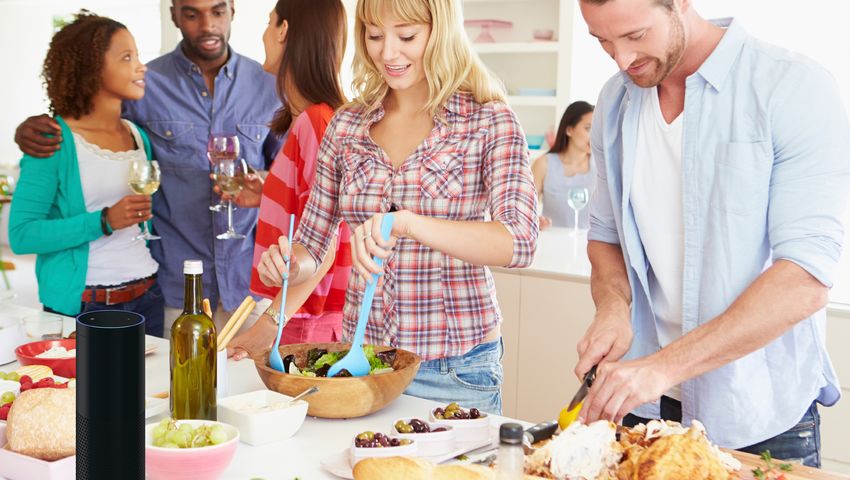
Table of Contents                  About Voicebot                                           Sponsors
1. INTRODUCTION // 3               Voicebot produces the leading online publication,
                                   newsletter and podcast focused on the voice and AI
2. METHODOLOGY // 4                industries. Thousands of entrepreneurs, developers,            GIVING VOICE TO A REVOLUTION

                                   investors, analysts and other industry leaders look to
3. SMART SPEAKER OWNERSHIP // 6
                                   Voicebot each week for the latest news, data, analysis

4. SMART SPEAKER USE CASES // 16   and insights defining the trajectory of the next great
                                   computing platform. At Voicebot, we give voice to a
5. VOICE COMMERCE // 19            revolution.

6. VOICE APP DISCOVERY // 23

7. NON-OWNERS SPEAK OUT // 26

8. CONCLUSION // 28
SMART SPEAKER CONSUMER ADOPTION REPORT

      19.7% of American Adults Have Access to Smart Speakers Today
                             The Voicebot   Smart speakers were the number one gift during the 2017 holiday season. Sixteen percent of our
                                            survey participants reported either giving a smart speaker as a gift or receiving one as a present.
                           Smart Speaker    However, product momentum started much earlier.

              Consumer Adoption Report      Amazon is the largest ecommerce retailer in the U.S. and its Amazon Echo smart speaker was the
                 found that 19.7% of U.S.   number one selling product on its online store in both 2016 and 2017. CEO Jeff Bezos claimed
                                            before the 2017 holiday shopping season that the company had already sold tens of millions of
                    adults have access to   Alexa-enabled products. Google revealed in January that more than one Google Home products
                                            were sold every second between October and December 2017. That is at least 7.6 million units
                   smart speakers today.    for a single vendor that commanded no more than one third of the market in 2017.
                That is up from less than   What is clear is that smart speakers are popular and unit sales are consistently exceeding analyst
                1% of the population just   projections. In addition, the devices are introducing consumers to voice interaction in the home
                                            and carrying that expectation over to smartphones and a variety of use cases, including shopping.
                           two years ago.   Welcome to the new voice-first world.

VOICEBOT.AI                                                                                                                                       PAGE 3
SMART SPEAKER CONSUMER ADOPTION REPORT

                                                      Rapid Adoption That Consistently Exceeds Forecasts
                                                      Analysts at Activate have a chart that shows              The Voicebot Smart Speaker Consumer Adoption
                                                      consumer adoption of smart speakers as faster than        Report found that 19.7% of U.S. adults have access to
                                                      smartphones. That all depends on what you classify        smart speakers today. That is up from less than 1% of
                                                      as a smartphone, but there is clear evidence that         the population just two years ago.
                                                      the smart speaker adoption rate has exceeded every
                                                      analyst forecast. So far in this market, forecasts only   It’s clear that smart speakers and the voice assistants
                                                      get revised upwards. Mary Meeker of KPCB saw this         that power them now matter. Smart speakers have
                                                      earlier than most:                                        undeniable consumer reach and Voicebot set out
                                                                                                                with PullString and RAIN Agency to find out how they
              Methodology                             “In the computing industry, inflection points are         are being used today and by whom. There are five
                                                      typically only obvious with hindsight. So ask the         categories of findings in the attached report.
              The survey was conducted online in
                                                      question – iPhone sales may have peaked in 2015
              January 2018 and was completed                                                                        • Smart Speaker Ownership
                                                      per most analyst estimates that are out there while
              by 1,057 U.S. adults age 18 or
                                                                                                                    • Use Cases
              older. Because we only reached          Amazon Echo sales are just beginning to take off.
                                                                                                                    • Voice Commerce
              online adults which represent 88.5%     Food for thought.”
                                                                                                                    • Voice App Discovery
              of the population, the overall device
              ownership numbers are adjusted          Since Meeker’s presentation in 2016, total smart              • What Non-owners Have to Say

              downward to provide an aggregate        speaker sales have grown about fifteen fold. That
              ownership level. Other findings are     was less than two years ago. The brains behind smart      We hope you find the data informative and encourage
              relative to smart speaker owners        speakers have also refused to be contained within         you to read Voicebot.ai throughout the year to track

              and do not require adjustment.          audio devices. You can now find voice assistant access    updates to market adoption figures and stay informed
                                                      in televisions, household appliances, lamps, smoke        about other studies tracking the trajectory of voice
                                                      detectors and hundreds of millions of smart phones.       and AI technologies.

VOICEBOT.AI                                                                                                                                                               PAGE 4
Smart Speaker Ownership

SMART SPEAKER CONSUMER ADOPTION REPORT

                                         Nearly 1 in 5 U.S. Adults Have Access to a Smart Speaker
                                         Men make up nearly 58% of all users today
                                         Smart speaker adoption has exceeded all analyst                           an important channel for marketers and media
                                         expectation and has moved from just about 1% reach                        organizations to reach consumers. The market reach
                                         among U.S. adults to nearly 20% in just two years.                        today is not uniform. It is expanding quickly, but smart
                                         This growth means that smart speakers and the voice                       speakers users are more likely to be male by a ratio of
                                         assistants that power them have rapidly become                            58% to 42%.

                                           19.7% of U.S. Adults Use Smart Speakers                                Gender Breakdown of U.S. Smart Speaker Users

                                                                                                                           42.2%                 57.8%
                                                                                                                           Female                Male

                                           Source: Voicebot Smart Speaker Consumer Adoption Report January 2018

VOICEBOT.AI                                                                                                                                                                   PAGE 6
SMART SPEAKER CONSUMER ADOPTION REPORT

       Total Smart Speaker Users Have Risen to 47.3 Million
       The 19.7% consumer reach figure translates into 47.3
       million U.S. adults with access to a smart speaker. This
                                                                                                                                            Total US
                                                                                      US Smart Speaker Total Audience Reach                   Adult
       will typically mean they live in a home where they
                                                                                                                                           Population
       have access to one or more smart speakers although
       they may not be the primary owner. This is one way
       that smart speakers differ from mobile. Most mobile
                                                                                                                                           252
       devices have a single user, whereas smart speakers                                                                                MILLION
       are communal devices used by entire households.

       How does the march to nearly 50 million smart                                                                                         Smart
       speaker consumers in 3 years compare to growth                                                                                    Speaker Owners
       rates of other communications channels? Television
       took 13 years, the internet four years and Facebook
                                                                                                                                             47.3
       just two years. Smart speakers are devices but are                                                                                  MILLION
       growing almost as quickly as social media apps. That is
       what has surprised so many analysts.

                                                                  Source: Voicebot Smart Speaker Consumer Adoption Report January 2018

VOICEBOT.AI                                                                                                                                               PAGE 7
SMART SPEAKER CONSUMER ADOPTION REPORT

                                         Consumers Own an Average of 1.8 Smart Speakers
                                         However, nearly two-thirds own only a single device
                                         Another factor of smart speaker adoption that                          The implication for device manufacturers is that the
                                         has surprised analysts is how many devices some                        market is nowhere near saturation. Eighty-percent
                                         consumers will purchase. There is an average of 1.8                    of the population are still prospects for their first
                                         devices per household, but it is really a bifurcated                   smart speaker and 85% of current smart speaker
                                         adoption model. About two-thirds of households                         owners are prospects for additional devices for their
                                         own a single device and 85% have no more than two                      home. So, the average is 1.8 devices, but the median
                                         devices. Then there are the 15% of households that                     ownership is still just one device. There is widespread
                                         have three or more. Over 2% of households claim                        speculation that smart speaker sales will peak in just
                                         to have 5-10 devices and 1.7% have more than 10                        a couple of years due to saturation. It appears the
                                         devices in use.                                                        market has much more growth ahead of it.

                                         Ratio of Devices Per Household

                                                          65.7%

                                                    19.3%

                                                     8%

                                           7%                                    +
                                         Source: Voicebot Smart Speaker Consumer Adoption Report January 2018

VOICEBOT.AI                                                                                                                                                               PAGE 8
SMART SPEAKER CONSUMER ADOPTION REPORT                                                                                                                SMART SPEAKER OWNERSHIP

                                         Living Room and Kitchen Are Most Popular Locations
                                         Bedrooms come in third place and everywhere else is uncommon
                                         The living room has become the most common                                 Bedrooms have become the next most popular
                                         location choice at 46% for smart speaker owners.                           spot at 37% and that number has climbed over the
                                         However, that is trailed closely by the 41% that                           past year. No other location comes close to the
                                         choose the kitchen. These are the primary communal                         big three locations with home office at 11% and
                                         gathering spots in the household which expose more                         everywhere else in single digits. Trailing far behind
                                         people to the devices.                                                     is the workplace. Low penetration in offices is a big
                                                                                                                    opportunity for additional smart speaker sales.

                                         Primary Household Location for Smart Speakers

                                           Bedroom                               Home Office                    Kitchen
                                           36.8%                                 10.9%                          41.4%                       Work Office
                                                                                                                                            2.7%
                                                                                 Living Room
                                                                                 45.9%

                                           Bathroom                                                             Dining Room         Garage
                                           5.9%                                                                 4.6%                5.9%
                                         Source: Voicebot Smart Speaker Consumer Adoption Report January 2018

VOICEBOT.AI                                                                                                                                                                     PAGE 9
SMART SPEAKER CONSUMER ADOPTION REPORT

       Amazon Still Has a 3.5 Times Larger Installed User Base Than Google
       Independent device manufacturers reach nearly 10% market share

       Amazon commands nearly 72% market share today             narrowed considerably in 2017 and both companies          Smart Speaker Market Share Installed Base 2017
       among U.S. adults followed by Google with 18.4%           launched products in Japan in the same week.
       and other manufacturers posting 9.7%. There are
       many forecasts that show Google with a higher             U.S. consumers also have a wide variety of smart                           9.7%
       market share for 2017 sales. To be clear, this survey     speakers to select from manufacturers not named                            Other
       measured total installed user base or cumulative          Amazon or Google. The leader of the back-of-the-
       market share and Amazon is still benefitting from its     pack is Sonos. The important footnote about Sonos is
       two-year time to market lead. With that said, Google      that it uses Amazon Alexa as its voice assistant. That
       made impressive inroads in 2017 and the market            means the market share of the Alexa voice assistant is
                                                                                                                                   18.4%
       share gap is likely to close further in 2018.             even higher than 72% of users. Other Alexa-enabled
                                                                                                                                   Google
                                                                 smart speakers include the low-priced Eufy and a                                   71.9%
       The biggest voice technology story of 2017 was the        high-priced Harman Kardon model. Harman Kardon                                     Amazon
       fierce battle between Amazon and Google. Amazon’s         also has the Microsoft Cortana-enabled Invoke and
       Echo smart speaker position in the U.S. is particularly   Google Assistant is available through JBL, Sony and
       strong. Google Home by contrast has staked out a          a few other devices. The data in this chart is strictly
       lead in several other countries such as Canada, France    related to device market share and not voice assistant
       and Australia. Amazon’s lead in UK and Germany            user share.

VOICEBOT.AI                                                                                                                                                           PAGE 10
SMART SPEAKER CONSUMER ADOPTION REPORT
Amazon Echo and Dot Command about Two-Thirds of the Market
Google Home Mini surpassed total Google Home sales in just three months
The Amazon Echo and Echo Dot smart speakers have been in the market the longest Device Market Share Breakdown 2017
and unsurprisingly command the largest share of users. An interesting finding is the
AMAZON GOOGLE OTHER
higher priced Echo and Google Home have matched sales with the lower priced Dot
Other
and Mini respectively. Part of this is a function of timing. Both Dot and Mini entered Echo Home Devices
the market about one year after Echo and Home respectively. However, while Mini 35.8% 8.7% 6.4%
overtook its older sibling in just three months, the Amazon Echo Dot still trails the
Echo in total user reach after about 15 months.
This parity in high and low priced model adoption is an interesting development.
It may be that many owners of single devices opt for the higher priced and better Home
Echo Dot
Mini
sounding Echo and Home. By contrast, it may be that many of the additional devices 32.3% 9%
in households are the lower-priced units. This share breakdown does not reveal Sonos
One
total volume of sales. It represents users with access to particular devices. The other
2.6%
notable data point is how few Harman Kardon Invoke devices are in use at only 0.6%.
On the other end of the spectrum there is Sonos One. The Alexa-enabled smart
speaker carved out a respectable 2.6% market share in only about three months. Harman Kardon
Other Echo Devices Home Max Invoke
3.9% 0.6% 0.6%
VOICEBOT.AI PAGE 11SMART SPEAKER CONSUMER ADOPTION REPORT
Amazon Devices More Likely to Be Owned by Upper Income Households
and Google by the Less Affluent
Device Ownership by Household Income
The data show that upper income households are marginally more likely to own
OME
Amazon Echo devices. However, households with income below the national average
E INC
are 20.6% more likely to own a Google smart speaker. This data appears to show E R AG
OM AVE
Google smart speakers following a similar path as Android OS smartphones. Earlier
INC >
studies showed income of Apple iPhone users averages about 40% above the AGE
R
VE
national average whereas Android user income is lower.SMART SPEAKER CONSUMER ADOPTION REPORT
iPhone Users 22% More Likely to Own a Smart Speaker
And 30% Less Likely to own a Google Home
iOS users are attractive consumers and far more In addition, iPhone owners are a good fit for Amazon
likely to own a smart speaker overall, but far less because they are far more likely to have made a
likely to own a Google device. However, the data also purchase by voice and more likely to use the 30,000
suggests that Google is at less risk of losing share to Alexa skills offered to Echo users. The favoritism
Apple HomePod than Amazon. Apple and Amazon shown by Apple owners to Alexa devices may also
may be the focus of multi-manufacturer households appeal to developers. Historically, iPhone app users
where HomePod is a luxury item for music listening have been far more valuable to developers on a
in living spaces while Echo products get placed in the revenue basis than Android users.
kitchen and bedrooms for utilitarian tasks.
Device Market Share for iPhone Users
22%
More likely to own a smart speaker
8.5%
More likely to have made a purchase
4.6%
More likely to use 3rd party skills
30%
Less likely to own a Google smart speaker
VOICEBOT.AI PAGE 13SMART SPEAKER CONSUMER ADOPTION REPORT
Siri Has Broad Awareness Among iPhone Users
Google Assistant has been tried by fewer than half of Android smartphone users
Siri has received a lot of bad PR over the years, but Google has had voice interaction on Android devices
she has broad awareness among iPhone owners for years, but Google Assistant is new so the 43% trial
and has been tried by about 77% of them. Apple rate has room to expand. This usage rate suggests
announced in June 2017 that there were 375 million about 51 million US Android users have tried Google
monthly active Siri users globally which makes it the Assistant. These data points also illustrate the
most widely used voice assistant globally. Keep in advantage Siri and Google Assistant have over Alexa
mind that Google Assistant’s 400 million number in reaching consumers with voice assistants beyond
refers to devices and not users. the smart speaker.
Voice Assistant Trial Rate on Smartphones
76.7% 42.7%
of iOS iPhone of Android
owners have smartphone
tried Apple Siri owners have tried
Google Assistant
Source: Voicebot Smart Speaker Consumer Adoption Report January 2018
VOICEBOT.AI PAGE 14Smart Speaker Use Cases
SMART SPEAKER CONSUMER ADOPTION REPORT
Questions, Music and Weather Most Common Use Cases
There are a number of studies about smart speaker Smart Speaker Use Case Frequency January 2018
use cases, but they have not adequately quantified
frequency of use. The Voicebot smart speaker data Ask a question 91% 72.9% 33.3%
provides more insight into use case frequency which Listen to streaming music service 89.5% 76.2% 41.9%
is a better indicator of actual smart speaker utility. Check the weather 85.2% 69.1% 41.4%
Set a timer 71.4% 51.8% 24.1%
The top seven categories are identical for the daily,
Listen to radio 68.8% 47.6% 25.5%
monthly and ever tried response categories but the
Set an alarm 65.7% 48% 25.3%
order changes and smart home creeps into the daily
Listen to
news / sports 58.1% 39.4% 14.8%
list pushing out news and sports. Use daily
Play game or answer trivia 52.3% 31.2% 11.1%
Find a recipe or cooking instructions 49.5% 26.5% 5.1% Use monthly
This is completely logical. Activities such as listening 46.5% 29.8% 14.7%
Use a favorite skill or assistant app
to music, checking the weather and controlling smart 41.2% 25.8% 7.7% Have ever tried
Check traffic
home devices occur already with high frequency Call someone 40.7% 22.7% 10.3%
and smart speakers are simply shifting that behavior Listen to podcasts and other talk formats 40.7% 24.1% 10.1%
to voice interaction. The data confirm that smart Control smart home devices 38.1% 29.9% 20.8%
speakers are being incorporated into everyday lives of Access my calendar 35.1% 19.6% 6.2%
consumers: 63% report using them daily and 77% at Message someone 34.2% 17.9% 8.2%
Made a purchase 26% 11.5% 2.1%
least weekly.
VOICEBOT.AI
0 50 100 150 200 PAGE 16SMART SPEAKER CONSUMER ADOPTION REPORT
Adoption of Voice Apps, Smart Home, Calling and Messaging Have Room for Growth
Third-Party Voice Apps through their voice assistant and about 46.5% have both callers to have a smart speaker. Even with the
tried a “favorite skill or assistant app.” The games recent updates to enable calling directly to telephone
Listening to music is the top use case for both are most likely third-party voice apps as are smart numbers not associated with a smart speaker, this
monthly and daily periods. Checking the weather and home controls so the overall numbers seem close to feature still requires more than one person to execute.
asking questions are also popular, but you also see 50% to match our other finding that 48.2% report The other use cases can be done alone so there
radio listening along with timers and alarms as high in having tried a third-party voice app. Maybe the more are no dependencies. The fact that 10.3% of smart
both consumer trial and frequency of use. Answering important finding is that only about 30% of users speaker owners say they are using their devices to
questions, timers and alarms are first-party skills. They access third-party voice apps at least monthly. That call or message someone daily is a significant change
are provided directly by the voice assistant platform. may mean that few voice apps today are designed in behavior. The increased availability of video calling
Weather can be first-party or provided by third-party to drive frequent repeat usage. Developers have an through smart displays may cause this figure to grow
voice apps. Music is generally considered second- opportunity to significantly grow their user base by even faster in 2018.
party (same company but offered by a different attracting new users that historically haven’t tried
division so not truly native to the voice assistant) or third-party voice apps and then getting everyone to Smart Home
third-party. Radio is always third-party as are most come back for more. The re-engagement challenge
smart home and news and sports offerings. We can was addressed on mobile predominantly through Smart home voice apps are used frequently by people
conclude from the data that users routinely access a notifications. It is unlikely developers will be able to that adopt the capabilities. While only 38% of smart
mix of first-party skills and third-party voice apps. rely on that tactic for voice. speaker owners have ever tried a smart home voice
app, over half of them use the features daily. This makes
Beyond the most popular use cases, the story of Calling and Messaging sense as smart home devices such as turning on lights
third-party voice app usage is mixed. There is likely or controlling the thermostat are daily activities in the
some confusion among smart speaker owners about Calling and messaging usage represents another physical world that are simply being made accessible by
the difference between a third-party skill or voice interesting finding. The fact that 40% have tried voice. Contrast this with asking questions where only
app and the native, first-party capabilities. We see to call or message someone through their smart about one-third of smart speaker owners that have
that over 50% of users have tried a game or trivia speaker is interesting because it previously required tried this feature claim to use it daily.
VOICEBOT.AI PAGE 17SMART SPEAKER CONSUMER ADOPTION REPORT
Use Frequency Fits a Bell Curve But is Skewed Toward Daily
Nearly 63% use smart speakers daily and over 77% at least weekly
Once a smart speaker enters a household it appears Even more interesting is the finding that 34% of smart
to generate regular use. And, this isn’t just about speaker owners utilize the devices several times per
music listening. Answering questions, checking day. The data suggest that smart speakers are no fad,
the weather and playing games all rate highly on a but instead are being incorporated into consumers’
monthly basis. daily lives.
Frequency of Smart Speaker Use 28.6%
23.2%
21.4%
12.7% 12.7%
Never or At least 1 - 2 times 3 - 5 times 6 + times
rarely monthly per day per day per day
VOICEBOT.AI PAGE 18Voice Commerce
SMART SPEAKER CONSUMER ADOPTION REPORT

       11.5% of Smart Speakers Owners Shop By Voice Monthly
       And 26% have made at least one purchase by voice
       Maybe the most intriguing use case is voice                              There was widespread skepticism about the likelihood
       commerce. 26% of smart speaker owners say they                           of voice becoming a purchasing channel, but appar-
       have made a purchase using the device and 11.5%                          ently consumers are more interested in this feature
       make purchases monthly. When we adjust this for                          than the experts. When you consider the general
       total population, we see that about 23% of the                           population, about 16.7% consider themselves likely
       population has tried voice commerce. This is nearly                      or very likely to order products by voice. And, iPhone
       identical to the Edison Research finding that 22% of                     owners maintain their advantage over Android with
       consumers had made a purchase by voice.                                  8.5% more likely to have made a purchase by voice.

       Voice Commerce is More Popular Than Expected

                                                26%                             11.5%                                 16.7%
                                                                                                     $$$
                                                of smart speaker                of smart speaker                      of general population
                                                owners have made                owners make                           is likely or very likely
                                                a purchase by                   purchases by voice                    to order products by
                                                voice                           monthly                               voice

         Source: Voicebot Smart Speaker Consumer Adoption Report January 2018

VOICEBOT.AI                                                                                                                                      PAGE 20
SMART SPEAKER CONSUMER ADOPTION REPORT
Amazon Echo Owners Account for Two-thirds of Voice Shoppers
But, a higher proportion Google Home owners have made a purchase by voice
Google Home users are surprisingly 50% more Echo owners that have shopped by voice than
likely to have made a voice purchase than Amazon Google Home owners. That is because Echo has a
Echo buyers which are 50% more likely to have much larger installed base. Of the sample of voice
made a voice purchase than owners of other smart commerce shoppers, two-thirds own and Amazon
speakers. However, there are still many more Amazon Echo device.
Total Percent of All Voice Commerce Users by Device Ownership
63.6% 32.7% 3.6%
AMAZON ECHO $ GOOGLE HOME OTHER
Voice Commerce Usage Rate by Device
23.3% 36.8% 16.7%
AMAZON
Device $ GOOGLE
Device $ OTHER
Device
Owners Owners Owners
Source: Voicebot Smart Speaker Consumer Adoption Report January 2018
VOICEBOT.AI PAGE 21Voice App Discovery
SMART SPEAKER CONSUMER ADOPTION REPORT

                                         48% of Smart Speaker Owners Using 3rd-Party Voice Apps
                                         An astonishing 11% have submitted voice app reviews
                                         There is still a lot of friction in voice app discovery        Have Used a 3rd-Party Voice App
                                         and promotion. We have seen some data that show
                                         voice app retention numbers are very low. So, app
                                         developers need to take a two-pronged approach.                             48%
                                                                                                                   have used a
                                         First, they need to design their apps to facilitate                        third-party
                                                                                                                     voice app
                                         re-engagement over time to establish repeat users.
                                         Second, they need to promote their voice apps
                                         through a variety of channels to generate awareness
                                         among more consumers.

                                         Having 11% of smart speaker owners leave a review
                                         doesn’t seem like a lot but some estimates suggest
                                         that only about 0.5% of online product buyers leave        Have Submitted a 3rd-Party Voice App Review
                                         reviews. Mobile app reviews routinely fall at less than
                                         1% and some as low as 0.15%. In comparison, voice
                                         app review rates are very high, 10-20x higher. App
                                                                                                                       11%
                                                                                                             of users have left
                                         reviews can help with discovery and trial so every                       a third-party
                                                                                                             voice app review
                                         voice app developer should make it part of their
                                         promotion strategy. This is particularly important since
                                         a large number of users appear to be willing to leave a
                                         review and voice app developers need to make sure
                                         they capture as many positive reviews as possible and
                                         minimize negative reviews.

VOICEBOT.AI                                                                                                                                       PAGE 23
SMART SPEAKER CONSUMER ADOPTION REPORT
Friends Help Friends Find Voice Apps
22.5% rely on friends for suggestions, other discovery is random
It is worth noting from the start that 48.2% of smart The Mechanisms of Voice App Discovery
speaker owners claim to not discover third party voice
apps at all. Of those who do, most discover voice apps I don’t
through friends (22.5%). Beyond generating strong 48.2%
word of mouth promotion, voice app publishers need to Friends
employ a variety of tactics to drive user adoption since 22.5%
no single approach has enough effectiveness to work on Alexa skill store / Google Assistant discover section
Promotion at 17%
its own. discretion of
voice assistant Email newsletter from Alexa or Google Assistant
platforms 13.8%
After friends, the voice app/skill promotion by Google
and Amazon are the most effective tactics, but not Social media
something in the control of developers. Less effective 13.8%
are the Amazon and Google suggestions about what News media
voice apps to try. And, developers have no control of 10.6%
this promotion tactic either. Social media and PR are the Things to try in Alexa app or discover section in Google Assistant app
best bet to generate interest and the tactics where voice 8.7%
app publishers can make the most direct impact. Other
5.1%
VOICEBOT.AI PAGE 24Non-Owners Speak Out
SMART SPEAKER CONSUMER ADOPTION REPORT

       Only 16% of Non-Owners Cited Privacy as Concern
       Many consumers believe their smartphones have the features they need

       There is often conjecture that consumers will be wary
                                                                   Why Some Consumers Have Not
       of adding a listening device to their homes, but two
                                                                    Purchased a Smart Speaker
       data points undermine this line of thought. The first is
       the rapid adoption of smart speakers by consumers.
       The second is that only a small percentage of                                    4.2%
                                                                                        Other
       consumers that do not own smart speakers
       reported that privacy concerns were a reason for
                                                                        8.8%
                                                                        Too expensive
       not purchasing a device. Either this is a non-issue in
       general or consumers believe that Amazon, Google
                                                                                                37.9%
       and others have taken sufficient precautions to
                                                                  11.8%                         Not Interested
       protect consumer privacy.                                  Plan to buy one

       By contrast 37.9% of consumers without smart                    16%
                                                                       Privacy
       speakers said they are simply not interested in
       the devices and 21.2% believe their smartphones
                                                                       concerns
                                                                                           21.2%
                                                                                           Smart
       have all the functionality they need today. A mere                                  phones have
       9% suggested they thought the devices were too                                      the fuctionality
                                                                                           they need
       expensive. Given that Amazon Echo Dot and Google
       Home Mini were routinely selling for under $30 in
       2017, this finding is not too surprising but might fall
       even further in 2018.

VOICEBOT.AI                                                                                                      PAGE 26
SMART SPEAKER CONSUMER ADOPTION REPORT
Consumers Say Smart Speakers Headed Toward 50% Growth
26% of these consumers plan to buy Apple HomePod
9.8% of consumers that do not own a smart speaker of useful capabilities that are either not available
today expect to purchase one in 2018. If true, this on smartphones or provide a richer experience in
would account for 50% growth in the smart speaker some settings where mobile devices are suboptimal.
user base and help the installed base surpass Of those consumers expecting to purchase a
25% of U.S. adults during the year. After that, smart speaker in 2018, 26% are focused on Apple
the fat part of the market will involve convincing HomePod. This will not represent 26% market share,
consumers that smart speakers truly offer a new set but rather 26% of new smart speaker owners.
Consumers That Plan to Purchase First Smart Speaker in 2018
19.7%
current smart
speaker
owners
9.8%
Non-owners who
expect to
purchase a smart
speaker this year
VOICEBOT.AI PAGE 27SMART SPEAKER CONSUMER ADOPTION REPORT
What Have We Learned?
Many people own smart speakers and use them frequently
The reported data reveals several important details
about smart speaker adoption.
• There are now a lot of users (19.7% of adults).
This represents a consumer channel with Read Voicebot Listen to the Get the
substantial reach. Voicebot Podcast Weekly Newsletter
• There are many smart speaker use cases that
consumers employ frequently with 63% reporting
daily use and 77% weekly use.
• Smart speaker owners skew towards males (58%)
and Amazon Echo. However, Google is closing
the gap.
• One in five adults have purchased something by
Smart Speaker Smart Speaker Voice Assistant
voice and 11% of smart speaker owners use voice
Alexa Stats Google Stats Device Support List
commerce monthly.
• Consumers saying they plan to buy smart
speakers in 2018 could increase the installed
base by another 50%.
VOICEBOT.AI PAGE 28SMART SPEAKER CONSUMER ADOPTION REPORT
Report Sponsors
PullString RAIN Voicebot
At PullString, we strive to help people talk effortlessly RAIN is an agency that combines strategy, Voicebot produces the leading online publication,
with the technology that surrounds us. Working at engineering, and creativity to help brands innovate newsletter and podcast focused on the voice and AI
the intersection of creative expression and artificial at the intersection of marketing and technology. industries. Thousands of entrepreneurs, developers,
intelligence, PullString Converse empowers brands A pioneer in Conversational AI, RAIN designs and investors, analysts and other industry leaders look to
and agencies with the leading solution for designing, implements system-minded solutions that drive Voicebot each week for the latest news, data, analysis
prototyping, and publishing highly engaging voice business results for clients. and insights defining the trajectory of the next great
applications for Amazon Alexa, Google Assistant, and computing platform. At Voicebot, we give voice to a
IoT devices. RAIN.agency revolution.
PullString.com Voicebot.ai
Report Authors
Bret Kinsella Ava Mutchler
Managing Editor Associate Editor
bret@voicebot.ai ava@voicebot.ai
To request custom voice or AI industry research
contact: info@voicebot.ai
VOICEBOT.AI PAGE 29You can also read