The State of Salesforce DevOps Report - How the Leading Companies Operate Salesforce at Scale - Copado

Page created by Ashley Murphy
 
CONTINUE READING
The State of Salesforce DevOps Report - How the Leading Companies Operate Salesforce at Scale - Copado
The State of
Salesforce DevOps Report
How the Leading Companies Operate Salesforce at Scale
2019 Annual Report
The State of Salesforce DevOps Report - How the Leading Companies Operate Salesforce at Scale - Copado
About this report

The first annual report on how the most sophisticated companies   company founded in 2004, specialized in technology advisory,
operate Salesforce at scale using DevOps best practices. Based   research and publishing. Thank you to the Tableau team whose
on thousands of data points collected from over 300 global       Analytics we used to analyze the data. Their intuitive interface
Salesforce customers using DevOps to accelerate and improve      and powerful visualizations provided many of the important
the speedand quality of their implementations, this report was   cross referenced insights in the report.
conducted by Beagle Research, an independent research

                                                                                            Copyright 2019 Copado |   The State of Salesforce DevOps Report   2
The State of Salesforce DevOps Report - How the Leading Companies Operate Salesforce at Scale - Copado
04 Executive Summary

06 Key Findings

08 Who Took the Survey?

15 How Do You Compare?

22 How You Can Improve

31 Future Strategy
                                             75% of CIOs say IT Departments
34 The Five Stages of Salesforce Evolution
                                              are experiencing the biggest
                                               historical shift of their role
The State of Salesforce DevOps Report - How the Leading Companies Operate Salesforce at Scale - Copado
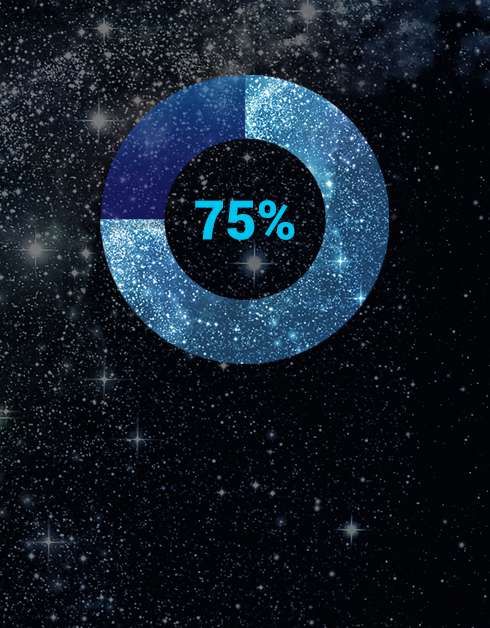
Why Salesforce DevOps?

                                                                                                                      Which of these areas do you believe you could improve
Executive Summary                                                                                                     for your organization if your team was able to prioritize
Every year, thousands of companies spend millions of dollars on Salesforce as the foundation of their digital           improvements to your Salesforce development and
transformation strategy. With such a large investment, you want to ensure you are getting the maximum
                                                                                                                             release process over the next 3-5 years?

return. Our research shows that in order to maximize your Salesforce investment, teams must align it with a
DevOps strategy that will unify the entire team, optimize the delivery pipeline, and establish the highest levels
of security and governance.                                                                                                  Productivity 58%

The Copado State of Salesforce DevOps Report is the first report of its kind focused solely on the                              Security 37%

emerging benchmarks and DevOps best practices within the Salesforce ecosystem. Our goal was to
                                                                                                                              Innovation 36%
identify and understand the capabilities and practices that lead to excellence in innovation delivery and
drive real business results among the leading Salesforce customers.                                                      Speed to market 33%

This research is inspired by the Accelerate State of DevOps Report. We would like to acknowledge and thank                        Costs 33%

them for their inspiration and for 6 years of research and data-driven insights into the impact of DevOps.
                                                                                                                     Customer Relevance 28%
They’ve clarified how to measure the most effective and efficient ways to develop and delivery technology
for the entire industry.                                                                                                  Release quality 26%

The survey was conducted by Beagle Research Group who demonstrated the deepest understanding of the                 Employee satisfaction 23%

Salesforce ecosystem and ensured a broad and deep data set of Salesforce customer executives.
                                                                                                                               Revenue 19%

                                                                                                                           Market share 7%

                                                                                                                                                                                  3
The State of Salesforce DevOps Report - How the Leading Companies Operate Salesforce at Scale - Copado
Salesforce DevOps Is Paying Off

                                                                                                                         5M
We surveyed over 300 executives, managers, and members of Salesforce delivery teams to learn about their
development lifecycles. Here’s what we learned. Software Delivery Performance has been studied carefully

                                                                                                                    $
over 6 years by the team at DevOps Research and Assessment. Guided by their insights, we analyzed
performance among these Salesforce teams in terms of the dual goals of innovation velocity and quality. We
were able to identify four performance profiles to further analyze the characteristics and causes of both high
and low performance.
                                                                                                                                        ROI
The research shows that the industry-standard Four Key Metrics of software delivery performance drive                             17% of Respondents
organizational performance in technology transformations. We also see a clear confirmation that it is
possible to “optimize for stability without sacrificing speed”.

                                                                                                                     46X                         2555X
At the end of this report, we have identified five distinct stages of the Salesforce DevOps evolution, and the
critical practices at each stage that help you achieve success and progress to the next phase of your journey.

While no company starts their Salesforce DevOps journey in the same place, the methods and processes for         more deployments                shorter lead times
improvement are becoming clear. Companies who pursue a three-layered strategy that balances the
organization of the team, establishment of end to end CI/CD processes, all running on an integrated

                                                                                                                       8X                              96X
technology platform outperform the rest.

                                                                                                                 less change failures          faster recovery times
Key findings

1                                                                            2
    Companies that combine the Salesforce                                        The primary driver of DevOps is speed but
    platform with a disciplined DevOps strategy                                  velocity alone won’t make you elite.
    drive real business results.
                                                                                 The study confirms that innovation speed is the #1 reason companies
    The highest performing companies are building a DevOps strategy              adopt DevOps. But top performers scored high in both velocity and
    around Salesforce to maximize their returns, with over 17% reporting         quality. High innovation delivery performance has been shown to drive
    an ROI of over $5M. One big surprise in the survey is the level of           organizational performance.
    velocity and stability that teams using Salesforce experience compared
    to the broader IT industry. Even teams with relatively immature DevOps
    processes compared to the broader IT industry performed better on
    average through the power of the platform.

3                                                                            4
    The size of your delivery team is the #1 factor                              The enterprise Salesforce delivery team has
    affecting the throughput of innovation.                                      evolved over the last few years as the scale of
                                                                                 Salesforce deployments has grown.
    We see the size and complexity of the largest Salesforce
    implementation teams growing exponentially as multi-million dollar           Teams are regularly comprised of very large numbers of admins and
    global implementations become more common. The organization and              developers. Almost 50% of our respondents had more than 25
    discipline of these heterogeneous teams is the key to maximizing             contributors, and many teams were managing 10 or more production
    performance of Salesforce projects.                                          orgs.

                                                                                                Copyright 2019 Copado |   The State of Salesforce DevOps Report   6
Key findings

5                                                                          6
    The Rise of Salesforce DevSecOps.                                          Innovation Performance requires both CI and CD.
    The security and regulatory risks facing Salesforce customers are          Higher performers were far more likely to integrate developers’ changes
    more numerous and sophisticated today than ever before. Specific            on an ongoing basis. Practices such as version control are widespread,
    regions including EMEA and most industries such as Financial               and Elite performers were five times more likely to automate all of their
    Services, Life Sciences, and even Consumer Goods face massive fines         deployments.
    for the mishandling of customer data. We see a new level of
    collaboration between the IT development, operations, compliance and
    security teams running Salesforce.

7                                                                          8
    Teams want to go faster.                                                   Larger teams rely on commercial tools.
    Teams admire the progress in DevOps made outside of the Salesforce         80% of larger teams used Salesforce-specific commercial tools to aid
    ecosystem. Teams with more than 10 contributors were four times            in their development lifecycle. While smaller teams relied on generic
    more likely to agree that non-Salesforce teams have more mature            DevOps tools or tools built in-house, none of the larger teams of Elite
    practices for managing the development lifecycle.                          performers did so.

                                                                                               Copyright 2019 Copado |   The State of Salesforce DevOps Report   7
Who took the survey?
   DEMOGRAPHICS & FIRMOGRAPHICS
Global Regions
Participation across regions generally aligns with Salesforce growth
with the majority in NA, then EMEA and Asia.

                                                      50%                   29%
                                                                                   1%

                                                                                  1%
                                                             1%                         9%

                                                                            1%
                                                                       2%
                                                                                             4%

                                                                                                  Copyright 2019 Copado |   The State of Salesforce DevOps Report   9
Demographics
Role                                                                                            Industry
DevOps is mostly being supported through IT operations. The survey drew deep                    All major industries were represented in the survey with Technology 21.4% and
participation from Operations and Security roles at 45%. The Second highest was SIs             Financial Services 16.4% leading the way as they have historically lead the transition to
at 21.9%. The majority of respondents in the survey come from technical backgrounds             the Salesforce and the Cloud.
often working for IT.

Which most closely describes your work role?                                                    Which industry are you in?

 DEVELOPMENT OR ENGINEERING                           16.55%                                                      EDUCATION

                                                                                                          FINANCIAL SERVICES                                                     16.4%
                        OTHER    1.44%
                                                                                                                     ENERGY
                 C-LEVEL EXEC                         16.19%
                                                                                               HEALTHCARE & PHARMACEUTICALS                         8%
   CONSULTANT, COACH, TRAINER       4.32%
                                                                                                INDUSTRIALS & MANUFACTURING                                               14.48%
SALES ENG, SALES OR MARKETING        4.68%                                                                       INSURANCE

         RELEASE ENGINEERING      2.52%                                                                MEDIA/ENTERTAINMENT

                                                                                                    RETAIL/CONSUMER/E-COMM                                                     15.9%
    QUALITY ENG OR ASSURANCE             6.12%
                                                                                                                TECHNOLOGY                                                                         21.4%
               PRODUCT MGNT                  9.71%
                                                                                                        TELECOMMUNICATIONS
  INFORMATION SECURITY, IT OPS                                                        35.61%                          OTHER                                   10.9%
                DEVOPS OR SRE
                                  2.88%                                                                        GOVERNMENT

                                                                                                                                 Copyright 2019 Copado |   The State of Salesforce DevOps Report     10
Demographics
Company Size                                                                          Production orgs
The survey included companies of all sizes with an emphasis on enterprise companies   One surprise was the number and scale of different orgs companies are using to run
with over 10,000 employees. Company size will prove a central theme contributing to   their Salesforce implementations. Over 59% of customers surveyed were supporting
overall platform performance.                                                         more than 5 production orgs with over 11.9% supporting more than 10 production
                                                                                      orgs. The ratio of Sandboxes and development orgs per production org are many to
                                                                                      one and represent massive challenges in managing, deploying and synchronizing
                                                                                      metadata and data across orgs.

                                                                                                     11.9%         9.5%
                                 14.9%
            21.9%
                                                            1 - 100
                                                                                           11.9%                                                        1
                                                            101 - 500
                                                                                                                                                        2-4
                                           15.4%            501 - 1,000
                                                                                                                                30.8%                   5-7
     7%
                                                            1,001 - 5,000
                                                                                                                                                        8 - 10
                                                            5,001 - 10,000
                                                                                                                                                        10+
                                                            10,000+
            20.9%                  19.9%
                                                                                                    35.8%

                                                                                                                       Copyright 2019 Copado |   The State of Salesforce DevOps Report   11
Years on Salesforce                                                                       Salesforce Users
Every year of Salesforce’s 20 year history is represented in the survey. It was           Salesforce implementations are far bigger now than ever before. The survey showed
interesting to see the number of years with Salesforce did not directly affect overall    that over half of companies supported over 5,000 users and 22% support over 10,000
performance metrics.                                                                      users.

Aproximately what year did your company first begin using Salesforce?
                                                                                                                                                                               1 - 100
1999
2000
2001
                                                                                          How many Salesforce users do you serve?                                              101 - 500
2003
2004
                                                                                                                                    19.9%
                                                                                                                                                                               501 - 1,000
2005                                                                                         19.4%                  18.9%
                                                                                                         17.9%
2006
2007
                                                                                                                                                                14.9%          1,001 - 5,000
2008
                                                                                                                                                    9%
2009                                                                                                                                                                           5,001 - 10,000
2010
2011
2012
                                                                                                                                                                               10,000+
2013
2014
2015
2016
2017
2018
2019

       0%          2.5%            5%             7.5%            10%             12.5%
                                                                                          How many business units use Salesforce?
                                                                                                            30.8%
Business Units                                                                                                              27.9%
                                                                                                                                                                               1

                                                                                                                                                               20.4%
                                                                                                                                                                               2-4
The survey shows that many companies run different Salesforce orgs based on
                                                                                                                                                                               5-7
business units. Only 8% reported running Salesforce for a single business unit while           9%
                                                                                                                                            11.9%
                                                                                                                                                                               8 - 10
over 40% supported Salesforce on behalf of 8 or more business units. Managing the
needs of different Business Units creates additional strain on managing and deploying                                                                                          10+

the Salesforce metadata.

                                                                                                                             Copyright 2019 Copado |     The State of Salesforce DevOps Report   12
Demographics
Business or IT Leadership                                                            Size of the Delivery Team
Salesforce is perhaps the technology platform most commonly shared between the       Salesforce teams are large and growing. Almost 75% of the teams we surveyed had
business and IT. We see a clear evolution away from the days when the business ran   more than 10 contributors, and 16% had more than 100 contributors. Larger teams
Salesforce on their own to a hybrid model with IT driving much of the DevOps best    require more sophisticated methods for collaborating.
practices.
                                                                                     How many people are currently involved in customizing your Salesforce org
                                                                                     (including admins, developers, etc)? Please include consultants, employees,
Which team is in charge of your Salesforce implementation?                           contractors, etc.

                               15.9%                                                              15.92%

                                                                                                                         27.86%
                                                                                                                                                  1-10
                                                         BUSINESS /SALES TEAMS

                                                                                         10.45%                                                   11 - 25
     42.8%                                               IT LEADERSHIP
                                                                                                                                                  26 - 50
                                                         BUSINESS AND IT TOGETHER
                                                                                                                                                  51 - 100
                                                         OTHER
                                                                                                                                                  101+
                                    40.3%
                                                                                              20.9%
                                                                                                                     24.88%

                                                                                                                     Copyright 2019 Copado |   The State of Salesforce DevOps Report   13
Demographics
Expectations of SIs
As Salesforce implementations grow, they require additional expertise in operations and development. Naturally the largest customers turn to System Integrators to help them build out their
customizations and tailor the platform to their business. We see many customers use multiple SIs. Customers were overwhelmingly expected System Integrators and Consultants to come
prepared with DevOps COEs and best practices.

                                                                                                         12.4%
                                                                         34.3%
                                                                                                                              STRONGLY DISAGREE

                                                                                                                              DISAGREE
              We expect our consultants and SI to come
                                                                                                                              NEITHER AGREE OR DISAGREE
                  prepared with DevOps Best Practices
                                                                                                                              AGREE

                                                                                                                              STRONGLY AGREE

                                                                                                       47.3%

                                                                                                                                      Copyright 2019 Copado |   The State of Salesforce DevOps Report   14
How do you compare?
How do you compare?
Innovation delivery performance

                                                     INNOVATION VELOCITY
                  BUILD     TEST      DEPLOY   RELEASE

                                                                 SFDC DEVOPS NEEDS
                                                                    NO STRUCTURED RELEASE PROCESS

                           DELIVERY PIPELINE                        NO SOURCE REPOSITORIES

                                                                    LACK OF VERSION CONTROLS

                                                                    KEEPING SANDBOXES IN SYNC

                                                                    MERGE CONFLICTS

                                                                    NO COLLABORATION TOOLS

     SALESFORCE PLATFORM   FEEDBACK LOOP                            NO 3RD PARTY DEVOPS TOOLS                                 GO LIVE
                             PLAN   MONITOR                         LACK OF SECURITY & COMPLIANCE

                                                                       GO-LIVE GAP

                                                         TRUST & QUALITY

                                                                                                    Copyright 2019 Copado |    The State of Salesforce DevOps Report   16
The Four
How do we compare?                                                                                                                       Measures of
                                                                                                                                         Salesforce

                        PLATFORM DELIVERY PERFORMANCE

               INNOVATION VELOCITY                                          RELIABILITY & TRUST

                                                                                                                                   The research shows that the industry-standard Four
      20 MIN

                                                                                                 5 MIN
                                                                                                                                    Key Metrics of software delivery performance and
                                0.43                           0%
                                                                                                                                  operations apply to the development and operation of
       LEAD TIME for                   deployment                   change failure                       mean time to              Salesforce just as they do for other industries. This
          change                        frequency                       rate                           recovery (MTTR)               finally provides us an industry standard way to
                                                                                                                                  evaluate how a company is performing on Salesforce
 Time from code committed to    How often you release to   How long it takes to recover from   Percentage of releases requiring                 compared to their peers.
          production                  production                failures in production              rollback and/or fixes

                                                                                                                                       It is clear the four key metrics drive positive
                                                                                                                                  organizational performance and business outcomes in
      Shorter is better              More is better               Shorter is better                     Less is better
   Faster feedback cycles           Small batch size        Decrease customer exposure            Early detection is critical          Salesforce transformations. We see a clear
 Adjust quickly to the market      More market agility          Decrease down time                Automation is important
                                                                                                                                  confirmation that it is possible to “optimize for stability
                                                                                                                                                 without sacrificing speed”.
The Velocity vs.
                                                                                                                                                   Stability Balance
The Four Performance Profiles
                                                               8

             Performance Profile
                                                               6
      % of Total Number of Records

                                                   Stability
 0%    20%       40%            60%   80%   100%
                                                               4

                                                               2

                                                               0

                                                                   -1        0          1             2             3           4            5        6             7            8           9

                                                                                                                                 Velocity

                                                                   Median performance by Profile
                       Elite

                       High

                       Medium                                      Performance profile       Lead Time (Minutes)         Deployments / Year          Change fail %       Time to restore (Hours)
                       Low
                                                                   Low                                    153,300                       32                    63%                           96
                                                                   Medium                                  10,080                      209                    38%                           96
                                                                   High                                     1,440                      209                    8%                            12
                                                                   Elite                                      60                     1,460                    8%                             1

                                                                                                                                    Copyright 2019 Copado |    The State of Salesforce DevOps Report   18
The Four Performance
                                                                                                               Profiles
The Best Companies Balance Speed
and Quality on the Salesforce
                                                                                                    Salesforce innovation performance

                                                                       Elite                       High                    Medium                  Low

                                                                       On-demand                   Less than a day         Between a day and       More than a week
                                            ELITE       Release                                                            a week
                                                      frequency
                                            12%
                                  HIGH
                               PERFORMERS
                                                                       Less than a day             Between a day and       Between a week          More than a month
                                 23%                Development
                                                      Lead Time
                                                                                                   a week                  and a month

                    MEDIUM
                  PERFORMERS
                    40%
                                                        Change         0-15%                       16% - 40%               41% - 75%               76% - 100%
                                                        Failures

         LOW
     PERFORMERS
        7%
                                                        Restore        Less than one               Less than a day         Between a day and       More than a week
                                                          Time         hour                                                a week

                                                                   State of DevOps 2019 Report

                                                                                                 Copyright 2019 Copado |     The State of Salesforce DevOps Report     19
Innovation Delivery
                                                                                                                                               Performance
Overall Industry Benchmarks
Aspect of Software Delivary Performance*                                         Elite                High                 Medium                           Low

Deployment frequency                                                             On-demand            Between once per     Between once per                 Between once per
For the primary application or service you work on, how often does your          (multiple deploys    day and once per     week and once per                month and once
organization deploy code to production or release it to end users?               per day)             week                 month                            every six months

Lead time for changes
                                                                                 Less than a day      Between one day      Between one week                 Between one
For the primary application or service you work on, what is your lead time for
                                                                                                      and one week         and one month                    month and six
changes (i.e., how long does it take to go from code committed to code
                                                                                                                                                            months
successfully running in production)?

Time to restore service
For the primary application or service you work on, how long does it generally   Less than one hour   Less than one daya   Less than one daya               Between one week
take to restore service when a service incident or a defect that impacts users                                                                              and one month
occurs (e.g., unplanned outage or service impairment)?

Change failure rate
For the primary application or service you work on, what percentage of changes
to production or released to users result in degraded service (e.g., lead to     0-15% b,c            0-15% b,d            0-15% c,d                        46-60%
service impairment or service outage) and subsequently require remediation
(e.g., require a hotfix, rollback, fix forward, patch)?

                                                                                                                               Copyright 2019 Copado |   The State of Salesforce DevOps Report   20
Innovation Delivery
                                                                                                                                   Performance
ROI Benefits from Salesforce DevOps

                                                                  What business impacts have you seen from
                                                                      your Salesforce DevOps strategy?

                                                                                             17.4%
                                                                             8%
DevOps ROI Impact
                                                                                                                 OVER $5M IN BENEFITS
The most striking results of the survey was the clear business
                                                                                                                 $5M - $1M
impact of DevOps when combined with the Salesforce Platform.         16.4%
                                                                                                                 $1M - $500K
The faster a business can adjust to changing market conditions,                                          18.4%
                                                                                                                 $500K - $250K
the more competitive it can be. This competitiveness underlines
the new differentiators in the modern digital economy.                                                           UNDER $250K

                                                                                                                 NA

                                                                                   34.4%

                                                                                                                 Copyright 2019 Copado |   The State of Salesforce DevOps Report   21
How you can improve
THE TOP FACTORS THAT AFFECT DELIVERY PERFORMANCE
# Contributors by Performance
                                                                                                                                                                               Performance Profile

       What Factors Affect Performance? – Company Size and Scale                                                                                  100%

       We very quickly noticed that size (especially when measured against the number of delivery team members),                                                                                                                   1-10

                                                                                                                   % of Total Number of Records
       negatively impacted performance. The Accelerate 2019 State of DevOps Report also noticed a decline in
                                                                                                                                                                                                                                   11-25
       performance for organizations over 5,000 employees.
                                                                                                                                                   50%                                                                             26-50

                                                                                                                                                                                                                                   51-100
                      Size of the delivery team
                      Size of the Salesforce User Base                                                                                                                                                                             101+

                      Number of Production Orgs
                      Number of Employees
                                                                                                                                                    0%
                      Number of Business Units                                                                                                            ELITE                HIGH            MEDIUM             LOW

                                                                                                                                                                    Performance by # Contributors
                                                            Median Lead by # Contributors                                                                                        Admin/Developers
                                                                    Admin/Developers
                                                                                                                                                  100%

                      100,000

                                                                                                                   % of Total Number of Records
                       10,000
Lead Time (Minutes)

                                                                                                                                                                                                                                  ELITE

                        1,000                                                                                                                                                                                                     HIGH
                                                                                                                                                  50%

                                                                                                                                                                                                                                  MEDIUM
                         100
                                                                                                                                                                                                                                  LOW

                          10

                           1                                                                                                                       0%
                                      1-10               11-25               26-50          51-100   101+                                                1-10          11-25           26-50        51-100         101+

                                                                                                                                                                  Copyright 2019 Copado |      The State of Salesforce DevOps Report        23
What Factors Affect Performance? – Team Organization
There were a large number of “elite performing” teams of 10 people or less. Salesforce as a platform is extremely stable and easy to customize, so it’s not surprising that small teams can
thrive on this platform. But we were particularly interested in what factors enable larger teams of 10+ contributors to thrive. The remainder of this analysis focuses on these larger teams and
their characteristics.

Who’s responsible for Salesforce (Teams of 10+)                                                       Leadership understanding (Teams of 10+)
Salesforce's ease of customization means that it can be directly managed by business                  Teams generally felt that their leadership understood their Salesforce DevOps strategy.
teams. This is in contrast to most IT systems, which need to be managed by IT                         Elite performing teams were 28% more likely than low performing teams to say that both
specialists. Elite performing teams of 10+ were 145% more likely to have Business teams               Business and IT leadership understood their DevOps strategy.
in charge of their Salesforce implementation.

               53%                      27%
                                                                                                                                                  18.4%
   53%                     50%                                                                                        55%
                                                         BUSINESS AND IT TOGETHER                                                                                  BUSINESS AND IT TOGETHER
                                                                                                                                  65%
                                                                                                          65%
                                                         IT LEADERSHIP                                                                                             IT LEADERSHIP DOES
                                                                                                                                               82%
                                                         BUSINESS/SALES TEAMS                                                                                      BUSINESS LEADERSHIP
                                        45%
                                                         OTHER (PLEASE SPECIFY)                                                                                    OTHER (PLEASE SPECIFY)

   32%         32%

                           40%                                                                            15%         36%

                                                                                                                                  31%
                                        27%                                                               15%
   11%                                                                                                                                         12%
               11%         10%                                                                                        7%

   LOW        MEDIUM        HIGH        ELITE                                                             LOW        MEDIUM       HIGH         ELITE

                                                                                                                                         Copyright 2019 Copado |   The State of Salesforce DevOps Report   24
What Factors Affect Performance? – Development Lead Time Roadblock
                                          Median Lead by # Contributors                                                              Median Deployment Frequency by # Contributors
                                                  Admin/Developers                                                                                      Admin/Developers

                      100,000                                                                                           400

                       10,000
Lead Time (Minutes)

                                                                                              Lead Time (Minutes)
                        1,000
                                                                                                                        200

                         100

                          10

                           1                                                                                             0
                                1-10   11-25               26-50              51-100   101+                                   1-10        11-25                  26-50              51-100               101+

                                       Median Change Fail by # Contributors                                                             Median Time to Recover by # Contributors
                                                  Admin/Developers                                                                                      Admin/Developers

                          0.4                                                                                           100

                                                                                                                         80
                          0.3

                                                                                              Time to Restore (Hours)
                                                                                                                         60
Change Fail %

                          0.2

                                                                                                                         40

                          0.1
                                                                                                                         20

                           0                                                                                              1
                                1-10   11-25               26-50              51-100   101+                                   1-10        11-25                  26-50              51-100               101+

                                                                                                                                                  Copyright 2019 Copado |   The State of Salesforce DevOps Report   25
What Factors Affect Performance?
                          The Effect of Continuous Integration

                                                                      Integration Frequency (Teams of 10+)                                                                                                                             Collaboration with Security (Teams of 10+)

                                                                                 Performance Profile                                                                                                                                                Performance Profile

                                                                                                                                                                  Avg. Security and Compliance Collaboration
                                                                                                                                                                                                               4.5                                                                                 4.3636
                               100%
                                                                                                                                                                                                                                                    4.1563
% of Total Number of Records

                                                                                                                                                                                                                                                                           4.2206
                               80%                                                                                                                                                                                   Agree
                                                                                                                                                                                                               4.0

                               60%
                                                                                                                                                                                                                             3.7500

                               40%                                                                                                                                                                             3.5

                               20%

                                0%                                                                                                                                                                             3.0
                                                                                                                                                                                                                                 Low                Medium                  High                    Elite

                                                                                     Integrating developers’ code changes daily is a hallmark of continuous
                                      On demand (multiple deployments per day)
                                                                                     integration. Integrating smaller changes more frequently reduces the
                                      Between once per hour and once per day         complexity of merges, and allows teams to refactor and keep their codebase
                                                                                     more maintainable. Elite performers were 173% more likely to integrate
                                      Between once per day and once per week         changes between developers at least daily.
                                      Between once per week and once per month

                                      Less than once per month

                                                                                                                                                                                                                                             Copyright 2019 Copado |    The State of Salesforce DevOps Report   27
What Factors Affect Performance?
                               The Journey to Continuous Delivery

                                             CI Drives Performance                                                                      Version Control is Widespread                                                                                                         Deployment Method
                                                                                                                                                   Performance Profile

                                                                                                                        100%

                               1.0

                                                                                % of Total Count of Number of Records
Median Integration Frequency

                                                                                                                        80%
                               1.5                                                                                                                                                                                             6

                                                                                                                                                                                                 Median Deployment Frequency
                               2.0                                                                                      60%
                                                                                                                                                                                                                               4

                               2.5
                                                                                                                        40%

                               3.0                                                                                                                                                                                             2

                               3.5
                                                                                                                        20%

                                     4   6     8        10       12   14   16
                                                                                                                                                                                                                               0
                                                   Performance                                                           0%                                                                                                        0   2                4              6              8             0              2              4                 6   8

                                                                                                                                                                                                                                                 Performance                                                                  Stability

                                                                                                                                Use of version control is widespread but version control alone                                                Increasingly sophisticated deployment methods are positively correlated with release velocity.
                                                                                                                               does not correlate with performance. Version control should be                                              Concerningly, they are negatively correlated with stability. This means that as teams are speeding up,
                                                                                                                               understood as a basic foundation for more advanced practices.                                               they are inducing more failures. The State of DevOps Report also observed a ‘J’ curve effect wherein
                                                                                                                                                                                                                                           teams experienced initial setbacks as they began to move faster. Increasing stability should be a key
                                                                                                                                                                                                                                                                       goal for teams as they begin to move faster.

                                                                                                                                                                                                                                                               Copyright 2019 Copado |                  The State of Salesforce DevOps Report               28
Salesforce DevSecOps Emerges
Our team works closely with security and compliance     When the automated tests pass, I am confident the          We are making the appropriate investments in the
     teams while developing and deploying new                         software releasable.                            security and compliance of our Salesforce
              capabilities on Salesforce.                                                                                             deployments.

                                   8.5%                                                    10.4%                                                        10%

                                                             38.8%

      41.3%                                                                                                            42.3%

                                                                                                                                                                       44.3%
                                                46.3%                                                     47.8%

                        STRONGLY DISAGREE                                 STRONGLY DISAGREE                                                 STRONGLY DISAGREE

                        DISAGREE                                          DISAGREE                                                          DISAGREE

                        NEITHER AGREE OR NOR DISAGREE                     NEITHER AGREE OR NOR DISAGREE                                     NEITHER AGREE OR NOR DISAGREE

                        AGREE                                             AGREE                                                             AGREE

                        STRONGLY AGREE                                    STRONGLY AGREE                                                    STRONGLY AGREE

                                                                                                                  Copyright 2019 Copado |      The State of Salesforce DevOps Report   26
Future strategy
                                                                                  Feel Prepared for the Future?
                                                                                            Performance Profile                                                                                                Are You Making Adequate Investment in Security?
                                                                                                                                                                                                                                   Admin/Developers
Avg. Feel Prepared for the Future

                                          Agree
                                      4
                                                                                                                                                                                    Agree
                                                                                                                                                                             4.0

                                                                                                                                                       Lead Time (Minutes)
                                    3.5
                                                                                                                                                                             3.5

                                          Neutral
                                      3
                                                                                                                                                                                    Neutral
                                                                                                                                                                             3.0

                                                                 LOW                        MEDIUM                         HIGH                ELITE
                                                                                                                                                                                              1-10                   11-25                   26-50                   51-100                  101+
                                          Higher performers are more likely to feel prepared for future years of digital disruption
                                                                                                                                                                                   Larger teams are more likely to feel that they are making the appropriate investments in the security compliance of our
                                                                                                                                                                                   Salesforce deployments. Unfortunately that seems to be coming at the expense of long lead times. Significantly, it does not
                                                                                                                                                                                   seem to be reducing the incidence of failures!
                                                                                         Want to Go Faster
                                                                                            Performance Profile
                                                                                                                                                                                                                  Do Non-Salesforce Teams Perform Better?                       44.3%
                                                                                                                                                                                                                                   Admin/Developers

                                    30%                                                                                                                                      4.0
% of Total Number of Records

                                                                                                                                                       Lead Time (Minutes)
                                    20%
                                                                                                                                                                             3.5

                                    10%
                                                                                                                                                                             3.0

                                      0
                                                                 LOW                        MEDIUM                         HIGH                ELITE                                          1-10                   11-25                   26-50                   51-100                  101+
                                          Rougly 30% of Medium and Low performers feel they should be deploying more frequently than they are today                                Larger teams are more likely to feel that their processes are less mature than those of non-Salesforce teams.
                                                                                                                                                                                                                                                                                                                29
What Tools Should You Use?
                                                                                                                                                            Choice of Tools by Size
                                                                                                                                                                   Admin/Developers

                      80%
                                                                                                                                                                                                                                                                                                      Uses Commercial Tools
% of Total Count of

                      60%

                      40%

                      20%

                      0%

                      30%
% of Total Count of

                      20%

                      10%
                                                                                                                                                                                                                                                                                                      Uses Only Open Source
                      0%
                                         1-10                                                           11-25                                                          26-50                                                          51-100                                                  101+

                            As teams grow, the number who only use open source solutions drops from 32% to only 9%. Similarly, the number who use a commercial solution increases from 55% to more than 90%. More than 80% of teams of 10+ contributors use commercial tools.

                                                                                                                                                   Performance for Open Source Users
                                                                                                                                                          Admin/Developers/Choice of Tools

                                                       1-10                                                       11-25                                                        26-50                                                      51-100                                               101+

                       15
Performance

                       10

                        5

                        0
                                     Commercial Tools              Open Source                     Commercial Tools           Open Source                    Commercial Tools            Open Source                     Commercial Tools            Open Source                Commercial Tools       Open Source

                            Users of both open source and commercial tools struggle at larger sizesv
                                                                                                                                                                                                                                               Copyright 2019 Copado |          The State of Salesforce DevOps Report         30
Future strategy
          Thinking about your future Salesforce Devops Strategy, it's best to consider:

○ Be mindful of the size and makeup of your delivery team         ○ Adopt a Commercial DevOps Platform designed for the
                                                                    Salesforce Platform
○ Build a DevSecOps COE
                                                                  ○ Implement Continuous Integration Across All Dev, Security,
○ Strive for Daily Releases especially as your team gets bigger     and Admin Teams

                                                                  ○ Design and automate your Continuous Delivery Processes
DevOps Is a Teamsport
                                                                                                       Teamwork. Transparency. Trust.

  Closing The Salesforce Skills Gap: DevOps Is
                                                                                                       Companies are at a crux. The demand for Salesforce skilled jobs is
  the Fastest Growing Role in the                                                                      higher than ever, and the supply cannot keep up. This results in a skills
                                                                                                       gap. How does one solve for this without hiring more and more talent?
  Salesforce Ecosystem                                                                                 The answer is simple: DevOps.

                                                                                                       DevOps improves team productivity and collaboration. This, in turn,
  The demand for SFDC roles is higher than any other role                                              amplifies the skills and talent that you already have at your disposal,
                                                                                                       resulting in a single, focused delivery team. DevOps enables teamwork,
                                                                                                       transparency and trust, which ultimately yields to a better return on your
                       Total for Established Markets                                                   investment and a quicker path to innovation.

                                             10,000             20,000   30,000                        The 3 “Ts” of DevOps: Teamwork, Transparency and Trust. These three
                                                                                                       work in conjunction to streamline your release process, and help
                                                                                                       address the Salesforce skill gap. Copado provides solutions for each of
      Administrator                           12,410       19,855                               1.6
                                                                                                       the three DevOps “Ts”:

                                                                                                       Teamwork: Teams communicate and create team centric workflows
         Developer                                13,729                          32,337        2.4
                                                                                                       across the entire DevOps chain in order to increase collaboration.

                                                                                                       Transparency:    Copado    provides   complete     visibility   across   all
Technical Archtitect     620 5,134                                                              8.3    departments, shared goals and shared data with one common source of
                                                                                                       truth.

         Consultant                  9,465                                                             Trust: Protect your data and innovation with industrial-strength security
                                                                                                0.9
                                     9,133
                                                                                                       to increase the trust your customers and partners place on your
                                                                                                       business.
                                                                                           *2018 10K
Are you ready
Copado Drives Performance By Unifying
the Delivery Team With the
                                                    for tomorrow?
#1 Native DevOps Platform for Salesforce              WHAT DOES THE FUTURE OF
                                                    SALESFORCE DEVOPS LOOK LIKE?

                          CIO

   DEVELOPER                            ARCHITECT

               SECURITY         ADMIN
Key findings
Operational experience is driven by
5 levels of automation

                                                5 STEPS TO DEVOPS ENLIGHTENMENT

                                                                                                                                                              Continually release
               05 continuous delivery                                                                                                                       changes all the way to
                                                                                                                                                            production for a faster
                                                                                                                                                                time to value

                                                                                                                              Automate manual tasks
               04 intelligent automation                                                                                       to scale your delivery
                                                                                                                              and increase efficiency

                                                                                                  Releases based on user
                                                                                                      stories for better

               03 agile releases                                                                   collaboration/merging
                                                                                                between multiple developers
                                                                                                         and teams

                                                                      Version Control as the
                                                                      Single Source of Truth,
               02 version control                                        Manual Branch
                                                                          Management

                                            Salesforce as Source of
               01 select and deploy        Truth. Ad Hoc Component
                                                   Releases

                                                                                                                                                  Copyright 2019 Copado |             The State of Salesforce DevOps Report   34
Key findings              32,000,000
                                                                                                                                                                      Metadata Managed
                                                                                                                                                        Salesforce DevOps Suite Summer ‘19

Trusted by Top Customers                                                                                                                           Pathfinder Success Programs

                                                                                                                                                    Compliance Hub
ENTERPRISE TRUST                  DEVOPS LEADER                   SUPERIOR EXPERIENCE

   100%                                 #1                                   5X                                                               Agile Planning
 Salesforce Native                  AppExchange                       Development Velocity

                                                                  Academy   Accelerators   Support

                                                                                                                       3X Demo Jam Winner

                                                                                                             Selenium Testing

                                                                                                       ISO Certified

                                                                                       Branch Management
                                                                    100th Enterpise Customer

                                                          Change Management

                                        1st Enterprise Customer
                         Founded on AppExchange
                     Copado DX

                        2013                      2014                           2015                       2016                      2017                     2018                    2019
Copado provides a full end-to-end devops solution
                                                                                                PREBUILT INTEGRATION
SALESFORCE DEVOPS 360                           SFDC NATIVE EXPERIENCE
                                                                                                Agile Planning
Innovation Performance Metrics                  Lightning UX                                    IDEs
CI/CD Dashboards and Rpts                       Native Dashboards                               CI/CD
Real Time Monitoring and Alerts                 Einstein Analytics                              Monitoring
                                                Salesforce Mobile                               Testing
Team Benchmarking
                                                Salesforce Flow                                 AI/Analytics
                                                Chatter Collaboration                           Security/Compliance
COMPLETE CI/CD PROCESSES                        Workflows and Alerts
                                                Dev/Test Environments
AGILE PLANNING
Metadata Tracking
Agile Planning                                                                                  SECURITY & COMPLIANCE
CREATE                                                                                          100% Salesforce Security Rules
Metadata Tracking
Environments Mgt                                                                                All major certifications:
Static Code Analysis   Continuous Integration                                                   ISO, SOC, HIPAA, GDPR, Truste.
VERIFY                                          100% SALESFORCE                                 Secure API-based architecture
Selenium Recorder
Apex Tests
                                                NATIVE INTEGRATION                              Encrypted credentials
                                                                                                oAuth Support / SSO-enabled
Metadata Validation
Manual Test Scripts                             DevOps Orchestration    Alerts & Notifications   Secure access to repository
Pull Requests                                   Proxy Agent             Dashboard and Reports   On-premise or cloud repositories
                                                Merge Engines           Salesforce APIs         User access controls
DEPLOY
Pipelines                                       Security / Auth         Prod Environments       Compliance hub
Deployment                                      (OAuth 2.0 support)
Rollbacks
                                                                        Profiles                 Configurable compliance rules
Data Management                                 Process Builder         Permission sets         Exception reporting with Alerts
Env Branches                                    Webhooks                Page Layouts            Data Backup & Recovery
RELEASE                                         Job Scheduling          Roles                   Business Continuity
Permissioner                                    Global Find & Replace   Metadata XML            Disaster Recovery
Permission Sets
Release Dashboard        Continuous Delivery                            Updated Continuously
#1 Across Native Salesforce DevOps Platforms
     G2 Crowd named Copado a Leader in Continuous Integration
              and ranked #1 in Customer Satisfaction

    88%               94%
                      believe in
                                       89%                         96%
    ease of use                       say we’re easy                rated us
                     the product      to do business               4 or 5 stars
                      direction             with

                                                       Copyright 2019 Copado |    The State of Salesforce DevOps Report   37
You can also read