D3.3 - Report on power request prediction for electric vehicles
←
→
Page content transcription
If your browser does not render page correctly, please read the page content below
Electric Vehicle Enhanced Range, Lifetime And Safety
 Through INGenious battery management

 D3.3 – Report on power request prediction
 for electric vehicles
 February 2020

This project has received funding from the European Union’s Horizon 2020 research
 and innovation programme under grant agreement No 713771

 Public
D3.3 – Report on power request prediction for electric vehicles Author: Camiel Beckers (TU/e) - February 2020 EVERLASTING - Grant Agreement 71377 (Call: H2020-GV8-2015) Electric Vehicle Enhanced Range, Lifetime And Safety Through INGenious battery management PROJECT SHEET Project Acronym EVERLASTING Project Full Title Electric Vehicle Enhanced Range, Lifetime And Safety Through INGenious battery management Grant Agreement 713771 Call Identifier H2020-GV8-2015 Topic GV-8-2015: Electric vehicles’ enhanced performance and integration into the transport system and the grid Type of Action Research and Innovation action Project Duration 48 months (01/09/2016 – 31/08/2020) Coordinator VLAAMSE INSTELLING VOOR TECHNOLOGISCH ONDERZOEK NV (BE) - VITO Consortium COMMISSARIAT A L ENERGIE ATOMIQUE ET AUX ENERGIES ALTERNATIVES Partners (FR) - CEA SIEMENS INDUSTRY SOFTWARE SAS (FR) - Siemens PLM TECHNISCHE UNIVERSITAET MUENCHEN (DE) - TUM TUV SUD BATTERY TESTING GMBH (DE) - TUV SUD ALGOLION LTD (IL) - ALGOLION LTD RHEINISCH-WESTFAELISCHE TECHNISCHE HOCHSCHULE AACHEN (DE) - RWTH AACHEN LION SMART GMBH (DE) - LION SMART TECHNISCHE UNIVERSITEIT EINDHOVEN (NL) - TU/E VOLTIA AS (SK) - VOLTIA VDL ENABLING TRANSPORT SOLUTIONS (NL) – VDL ETS Website www.everlasting-project.eu Public 2 / 23
D3.3 – Report on power request prediction for electric vehicles Author: Camiel Beckers (TU/e) - February 2020 EVERLASTING - Grant Agreement 71377 (Call: H2020-GV8-2015) Electric Vehicle Enhanced Range, Lifetime And Safety Through INGenious battery management DELIVERABLE SHEET Title D3.3 – Power request prediction for electric vehicles Related WP WP3 (Extended driving range) Lead Beneficiary Eindhoven University of Technology (TU/e) Author(s) Camiel Beckers (TU/e) Igo Besselink (TU/e) Henk Nijmeijer (TU/e) Reviewer(s) Mário Paroha (Voltia) Anouk Hol (VDL ETS) Type Report Dissemination level PUBLIC Due Date February 29, 2020 Submission date February 27, 2020 Status and Version Final, version 1.0 Public 3 / 23
D3.3 – Report on power request prediction for electric vehicles Author: Camiel Beckers (TU/e) - February 2020 EVERLASTING - Grant Agreement 71377 (Call: H2020-GV8-2015) Electric Vehicle Enhanced Range, Lifetime And Safety Through INGenious battery management REVISION HISTORY Version Date Author/Reviewer Notes V0.1 04/12/2019 Camiel Beckers (TU/e) First draft Lead Beneficiary V0.2 04/02/2020 Camiel Beckers (TU/e) Finalizing draft V0.3 12/02/2020 Igo Besselink (TU/e) Peer review V0.4 17/02/2020 Henk Nijmeijer (TU/e) Peer review V0.5 21/02/2020 Mário Paroha (Voltia) Quality check / Confidentiality Anouk Hol (VDL ETS) check V1.0 27/02/2020 Carlo Mol (VITO) Submission to the EC Coordinator Public 4 / 23
D3.3 – Report on power request prediction for electric vehicles Author: Camiel Beckers (TU/e) - February 2020 EVERLASTING - Grant Agreement 71377 (Call: H2020-GV8-2015) Electric Vehicle Enhanced Range, Lifetime And Safety Through INGenious battery management ([1]–[8]) ([9], [10]). DISCLAIMER The opinion stated in this report reflects the opinion of the authors and not the opinion of the European Commission. All intellectual property rights are owned by the EVERLASTING consortium members and are protected by the applicable laws. Except where otherwise specified, all document contents are: “© EVERLASTING Project - All rights reserved”. Reproduction is not authorised without prior written agreement. The commercial use of any information contained in this document may require a license from the owner of that information. All EVERLASTING consortium members are committed to publish accurate information and take the greatest care to do so. However, the EVERLASTING consortium members cannot accept liability for any inaccuracies or omissions nor do they accept liability for any direct, indirect, special, consequential or other losses or damages of any kind arising out of the use of this information. ACKNOWLEDGEMENT This project has received funding from the European Union’s Horizon 2020 research and innovation programme under grant agreement No 713771 Public 5 / 23
D3.3 – Report on power request prediction for electric vehicles Author: Camiel Beckers (TU/e) - February 2020 EVERLASTING - Grant Agreement 71377 (Call: H2020-GV8-2015) Electric Vehicle Enhanced Range, Lifetime And Safety Through INGenious battery management EXECUTIVE SUMMARY This report summarizes the activities and results of Work Package (WP) 3 related to Task 3.3 of the EVERLASTING project. This task is aimed at model development for the purpose of predicting the future power request of an electric vehicle (EV). Two specific electric vehicles are considered; the Voltia eVan and the VDL electric city bus. Both vehicles are used in WP7 of this project for demonstration purposes. This report contains the results of multiple dedicated tests with these vehicles, thereby demonstrating the collaboration between the TU/e and the EVERLASTING partners VDL and Voltia. The work performed within Task 3.3 resulted in one peer-reviewed journal publication ([4]), four peer- reviewed conference contributions ([1], [3], [5], [6]), three MSc. theses ([2], [7], [8]), and two open access datasets ([9], [10]). This deliverable report for Task 3.3 summarizes the published results. Public 6 / 23
D3.3 – Report on power request prediction for electric vehicles Author: Camiel Beckers (TU/e) - February 2020 EVERLASTING - Grant Agreement 71377 (Call: H2020-GV8-2015) Electric Vehicle Enhanced Range, Lifetime And Safety Through INGenious battery management TABLE OF CONTENTS EXECUTIVE SUMMARY ........................................................................................................ 6 TABLE OF CONTENTS .......................................................................................................... 7 LIST OF ABBREVIATIONS AND ACRONYMS ......................................................................... 8 1 INTRODUCTION ............................................................................................................ 9 1.1 OVERVIEW OF ACTIVITIES ................................................................................................9 1.2 CONNECTION TO THE GRANT AGREEMENT ............................................................................ 10 1.3 LIST OF PUBLICATIONS ................................................................................................. 10 2 BASELINE ENERGY CONSUMPTION PREDICTION MODEL ............................................ 12 2.1 PHYSICAL MODEL ........................................................................................................ 12 2.2 IDENTIFICATION OF VEHICLE PARAMETERS ........................................................................... 12 2.3 IDENTIFICATION OF ENVIRONMENTAL PARAMETERS ................................................................. 14 2.4 VELOCITY PROFILE PREDICTION ....................................................................................... 14 2.5 RESULTS & CONCLUSIONS ............................................................................................. 15 3 ASSESSING THE IMPACT OF CORNERING LOSSES ON THE ENERGY CONSUMPTION OF ELECTRIC CITY BUSES ...................................................................................................... 17 3.1 INTRODUCTION .......................................................................................................... 17 3.2 MODEL APPROACH ...................................................................................................... 17 3.2.1 Model Results.................................................................................................... 17 3.3 MODEL VALIDATION..................................................................................................... 18 3.4 CORNERING LOSSES ON REAL BUS ROUTES ......................................................................... 18 3.5 CONCLUSIONS ........................................................................................................... 19 4 ON-BOARD PARAMETER ESTIMATION FOR IMPROVED ACCURACY .............................. 20 4.1 INTRODUCTION .......................................................................................................... 20 4.2 ONBOARD POWER REQUEST PREDICTION ............................................................................ 20 5 DRIVER BEHAVIOR CHARACTERIZATION .................................................................... 21 5.1 INTRODUCTION .......................................................................................................... 21 5.2 EXPERIMENT AND METHOD ............................................................................................. 21 REFERENCES ..................................................................................................................... 23 Public 7 / 23
D3.3 – Report on power request prediction for electric vehicles Author: Camiel Beckers (TU/e) - February 2020 EVERLASTING - Grant Agreement 71377 (Call: H2020-GV8-2015) Electric Vehicle Enhanced Range, Lifetime And Safety Through INGenious battery management LIST OF ABBREVIATIONS AND ACRONYMS ACRONYM DEFINITION API Application Programming Interface CoG Center of Gravity EV Electric Vehicle HVAC Heating, Ventilation and Air Conditioning WP Work Package Public 8 / 23
D3.3 – Report on power request prediction for electric vehicles Author: Camiel Beckers (TU/e) - February 2020 EVERLASTING - Grant Agreement 71377 (Call: H2020-GV8-2015) Electric Vehicle Enhanced Range, Lifetime And Safety Through INGenious battery management 1 INTRODUCTION Work Package (WP) 3 of the EVERLASTING project is aimed at extensing the driving range of electric vehicles (EVs). While the trivial solution to this challenge is the addition of extra battery cells to the vehicle battery pack, this option is not always physically possible or cost-optimal. Therefore, the activities in WP are specifically focussed on solutions that do not increase the size of the battery. As part of this research, Taks 3.3 is researching the prediction of the future power request of EVs. When combined with battery state information, the knowledge of the future power request can be translated into a remaining driving range of the EV. Having reliable knowledge of the future power request, and the remaining driving range, can reduce the range anxiety experienced by EV drivers. Furthermore it enables more efficient vehicle usage through efficient vehicle and charging scheduling, on-board energy management to optimize energy usage of various sub-systems, and can be used for early operational cost assessment. The focus of this report is on prediction of the power requested by the powertrain of the vehicle. Additionally, power is required for the auxiliary systems of the vehicle, such as the electrical system and Heating, Ventilation and Air Conditioning (HVAC). The modeling of the energy consumption due to these auxiliary loads is discussed in Deliverable 3.4 [11]. Furthermore, this report does not focus on the question how to maximize the driving range of the EV, which is extensively discussed in Deliverable 3.5 [12]. 1.1 OVERVIEW OF ACTIVITIES A baseline energy consumption prediction model is presented in [1]. The model is specifically developed for the EVERLASTING VDL electric city bus, and will be used in Task 7.6 as demonstrator. To this end, VDL & TU/e together conducted dedicated vehicle experiments, to determine several specific vehicle parameters, such as rolling resistance, aerodynamic resistance, and powertrain efficiency. These tests are documented in a MSc. thesis [2]. The measurement results are combined in a physics-based model that can predict the future powertrain energy consumption as function of vehicle velocity when the route is known. In order to extend the physical modeling of vehicle energy losses, research is performed regarding tire energy losses during cornering. This work is presented in [3], [4] and combined with a complete vehicle energy consumption model in [5]. Through development of a detailed vehicle dynamics model of a city bus, the energy losses in the tires during corners are quantized. Experiments performed in collaboration with VDL are used to validate the model and VDL fleet data enables an assessment of the impact of the discovered effects, which appear to be significant for electric city buses. The model first presented in [1] is further extended in [6], which is a joint publication by Voltia and TU/e. In this paper, dedicated vehicle tests are performed, this time to determine relevant vehicle parameters of the Voltia eVan; the vehicle that will contain the EVERLASTING demonstrator battery pack in Task 7.3. The model extension includes the incorporation of route information to translate a user-given route into a velocity profile, which is subsequently used for energy consumption estimation. This velocity profile prediction algorithm takes into account the intended route, local speed limits, road curvature, and the location of traffic signals. Also road slope information and current weather information, such as air density and wind speed and direction are included in the energy consumption prediction. All this information is obtained through open source online databases, such as OpenStreetMap, OpenWeatherMap, and NASA’s Shuttle Radar Topography Mission (STRM) map. Lastly, two MSc. graduation projects have been completed in close collaboration with VDL [7], [8], with the goal of applying on-board parameter identification to improve the accuracy of the energy consumption prediction model and to characterize the driver behavior. The simulation results of these Public 9 / 23
D3.3 – Report on power request prediction for electric vehicles Author: Camiel Beckers (TU/e) - February 2020 EVERLASTING - Grant Agreement 71377 (Call: H2020-GV8-2015) Electric Vehicle Enhanced Range, Lifetime And Safety Through INGenious battery management works are summarized in Chapters 4 and 5 of this report. The methods developed in both these MSc. projects will be applied to the VDL electric city bus demonstrator in Deliverable 7.6. 1.2 CONNECTION TO THE GRANT AGREEMENT In the Description of Activities (DoA), objective 6 states: Objective 6: Range prediction and optimization to decrease range anxiety To extend the driving range the EVERLASTING project will develop BMS technology that will increase driving range up to 15% without increasing the physical battery size. It will also decrease the charging time by 30%. EVERASTING Grant agreement, Part B, §1.2.2.c), p. 6. To reach the 15% increase of driving range, several topics have been listed in the DoA to be subject of research, where the results of these separate research activities all contribute to reach this 15% target. This Deliverable (D3.3) specifically focusses on the topic: This BMS technology […] calculates the remaining driving range of the vehicle with an error of max 5%. This gives the driver a more reliable figure to plan his trip. In order to arrive at a 5% driving range prediction error, a power request prediction error of less than 5% would be required. As will be described in Chapter 2 of this deliverable report, it is challenging to achieve this accuracy using offline predictions only, i.e., predictions that are made before the start of the trip. However, simulation results in Chapter 4 indicate that this accuracy can be improved by using on-board vehicle data. 1.3 LIST OF PUBLICATIONS A complete list of the publications describing the results of Task 3.3 is provided below. Except the three MSc. theses, all publications are published as either Gold or Green OpenAccess work. Due to confidentiality constrains, the work from the MSc. theses is not published publically. A summary of the work is provided in Chapters 4 and 5 of this report. At least one future scientific OpenAcces publication will be created based on these theses. [1] C. J. J. Beckers, I. J. M. Besselink, J. J. M. Frints, and H. Nijmeijer, “Energy consumption prediction for electric city buses,” in 13th ITS European Congress, 2019. [2] J. J. M. Frints, “An improved road load model for the VDL Citea electric bus,” MSc. Thesis, DC 2018.013, Eindhoven University of Technology, Eindhoven, 2018. [3] C. J. J. Beckers, I. J. M. Besselink, and H. Nijmeijer, “Modeling of Energy Losses During Cornering for Electric City Buses,” in 2019 IEEE Intelligent Transportation Systems Conference (ITSC), 2019, pp. 4164–4169. [4] C. J. J. Beckers, I. J. M. Besselink, and H. Nijmeijer, “Assessing the impact of cornering losses on the energy consumption of electric city buses (submitted),” Transp. Res. Part D Transp. Environ., 2020. [5] G. P. Padilla, C. Pelosi, C. J. J. Beckers, and M. C. F. Donkers, “Eco-Driving for Energy Efficient Cornering of Electric Vehicles in Urban Scenarios (submitted),” in IFAC World Congress, 2020. [6] C. J. J. Beckers, M. Paroha, I. J. M. Besselink, and H. Nijmeijer, “A Microscopic Energy Consumption Prediction Tool for Fully Electric Delivery Vans (in press),” in EVS33 International Battery, Hybrid and Fuel Cell Electric Vehicle Symposium, 2020. [7] K. Basu, “An Online Powertrain Power Request Predictor for Electric City Buses,” MSc. Thesis, DC 2019.103, Eindhoven University of Technology, Eindhoven, Dec. 2019. Public 10 / 23
D3.3 – Report on power request prediction for electric vehicles Author: Camiel Beckers (TU/e) - February 2020 EVERLASTING - Grant Agreement 71377 (Call: H2020-GV8-2015) Electric Vehicle Enhanced Range, Lifetime And Safety Through INGenious battery management [8] O. F. Hulsebos, “Driver Behaviour Analysis for Energy Consumption Prediction in Electric Buses,” MSc. Thesis, DC 2020.008, Eindhoven University of Technology, Eindhoven, Feb. 2020. Additionally, two OpenAccess datasets are published that contain the code describing the models in [4] and [6] respectively: [9] C. J. J. Beckers, “Dataset: A nonlinear steady-state cornering model for an electric city bus.” 4TU.Centre for Research Data, Eindhoven, 2020. https://doi.org/10.4121/uuid:e6560568- 4203-43c5-9fdb-a91bc5e2cee4 [10] C. J. J. Beckers, “Dataset: A Microscopic Energy Consumption Prediction Tool.” 4TU.Centre for Research Data, Eindhoven, 2020. https://doi.org/10.4121/uuid:721b2ea6-2634-4dd5-a0c8- 865a0aa41a99 Public 11 / 23
D3.3 – Report on power request prediction for electric vehicles Author: Camiel Beckers (TU/e) - February 2020 EVERLASTING - Grant Agreement 71377 (Call: H2020-GV8-2015) Electric Vehicle Enhanced Range, Lifetime And Safety Through INGenious battery management 2 BASELINE ENERGY CONSUMPTION PREDICTION MODEL This chapter provides a summary of the results presented in [1], [6]. These publications describe a physics-based energy consumption and power request prediction model specifically developed for the two demonstrator vehicles in EVERLASTING: the VDL electric city bus and the Voltia eVan. While the details are described in the publications themselves, a brief summary of the performed work is presented here. 2.1 PHYSICAL MODEL The energy consumption of the vehicle is modeled using a physics-based approach, i.e. by modeling the longitudinal dynamics of the vehicle. By doing so, the powertrain power can be expressed as 1 = [ + cos( ) + ( − )2 + sin( )] + ( ℎ , ℎ ). 2 This equation depends on the vehicle velocity as function of time. Secondly, there are several vehicle parameters, such as vehicle mass , effective mass , which also includes rotational inertia, rolling resistance coefficient , aerodynamic drag coefficient , frontal area , and powertrain losses as function of wheel speed ℎ and wheel torque ℎ . Lastly, also several environmental conditions are required, such as the gravitational acceleration , the air density , the local road slope , and the effective wind velocity . The total trip energy consumption can be determined by adding the auxiliary power and integrating over the trip time, according to = ∫ ( + ) . 0 The models describing the auxiliary power request for the VDL electric city bus are further detailed in Deliverable 3.4 [11]. While the physical description of the powertrain power request can be described by the above two equations alone, the true challenge lies in determining accurate values for all the input parameters to these equations. Therefore, these predictions require knowledge of the vehicle in the form of vehicle parameters, knowledge of the intended route, and knowledge of the driver behavior. 2.2 IDENTIFICATION OF VEHICLE PARAMETERS In order to find vehicle specific parameters, such as the rolling resistance coefficient , aerodynamic drag coefficient , and powertrain losses , dedicated vehicle tests were performed at the TU/e with both the VDL electric city bus and the Voltia eVan. These tests have been performed in close collaboration with respectively VDL and Voltia. Public 12 / 23
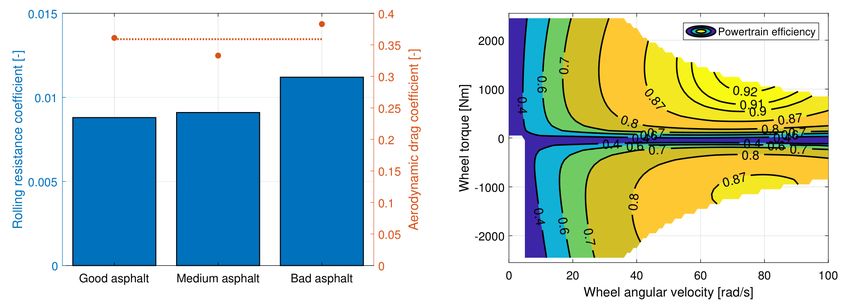
D3.3 – Report on power request prediction for electric vehicles Author: Camiel Beckers (TU/e) - February 2020 EVERLASTING - Grant Agreement 71377 (Call: H2020-GV8-2015) Electric Vehicle Enhanced Range, Lifetime And Safety Through INGenious battery management Figure 1: Graphical overview of the various test that have been performed with both the VDL electric city bus and the Voltia eVan at the ATlab of the TU/e. Firstly, dynamometer tests, as displayed in Figure 1, are performed with both vehicles to determine the energy losses that occur when power is transferred from the battery to the wheels. A detailed description of the physical nature of these losses is provided in [1]. The TU/e Heavy-Duty Dynamometer setup allows measurement of these losses. The measurement results are used to create models for the powertrain losses as displayed in Figure 2 (right). This model is also used as part of a complete vehicle model in Deliverable 1.3 of the project [13]. Secondly, multiple coast-down test are performed with both vehicles to assess the rolling resistance coefficient and aerodynamic drag coefficient . As the former can also vary as function of road surface, the tests are repeated for different road surfaces. The results for the Voltia eVan are described in Figure 2 (left). Exemplary results for the VDL electric city bus are shown in Figure 3. Lastly, several constant vehicle specific parameters, such as vehicle mass and frontal area are measured directly. While the mass of the Voltia eVan is considered constant for the duration of a trip, the VDL electric city bus demonstrator in D7.6 will make use of the available on-board mass estimation algorithm. Figure 2: Measured vehicle parameters of the Voltia eVan. Left: Rolling resistance coefficient and Aerodynamic drag coefficient. Right: Powertrain losses expressed as efficiency value [6]. Public 13 / 23
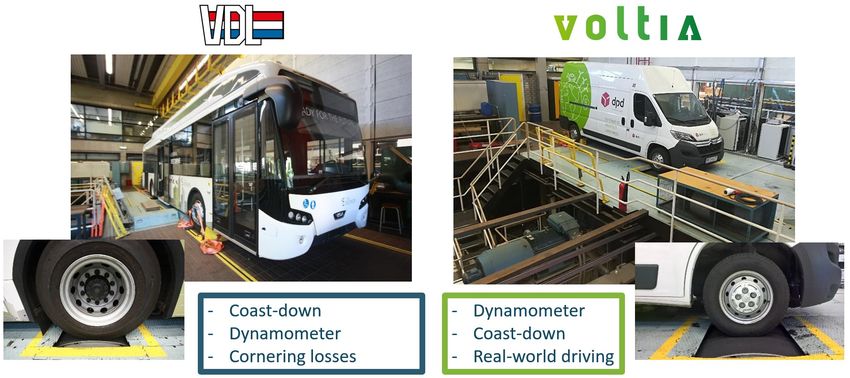
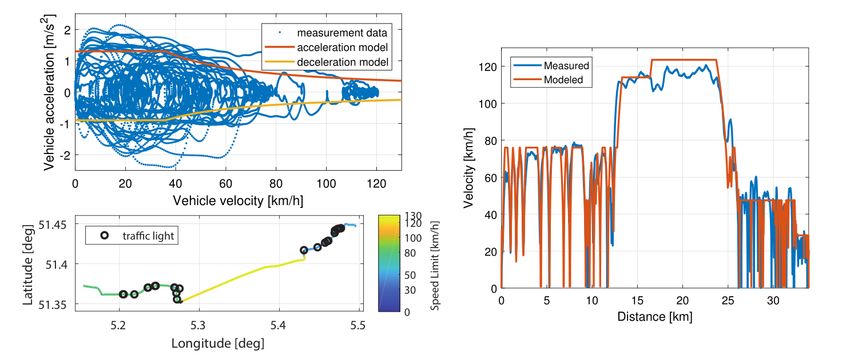
D3.3 – Report on power request prediction for electric vehicles Author: Camiel Beckers (TU/e) - February 2020 EVERLASTING - Grant Agreement 71377 (Call: H2020-GV8-2015) Electric Vehicle Enhanced Range, Lifetime And Safety Through INGenious battery management Figure 3: Normalized rolling resistance coefficient (w.r.t the tire manufacturer provided values) of the VDL electric city bus for various road surfaces [1]. 2.3 IDENTIFICATION OF ENVIRONMENTAL PARAMETERS The longitudinal dynamics model described in Section 2.1 also requires knowledge of several environmental parameters. Because the required environmental parameters vary as function of geographic location and/or time, relevant information can be obtained for an arbitrary route through use of online Application Programming Interfaces (APIs). The local road slope is determined from the publically available SRTM height database [14]. By querying the height of the route as function of position along the route, and subsequently filtering and differentiating the height profile, the road slope is calculated. Secondly, weather data, in the form of air density , wind magnitude, and wind direction, is used to adapt the calculation of the aerodynamicdrag force. By considering the wind direction and magnitude with respect to the vehicle heading, the effective longitudinal wind velocity is is calculated and included in the aerodynamic model. The weather data is freely available from [15]. 2.4 VELOCITY PROFILE PREDICTION The expression described in Section 2.1 also requires knowledge of the vehicle velocity for a certain route. A velocity prediction algorithm is developed, based on [16] that requires GPS coordinates of an intended route as input. The algorithm takes into account the local speed legislation, traffic sign locations, road curvature, and driver behaviour. The information required for the former two of these effects is obtained from OpenStreetMap [17], as displayed in Figure 4(bottom-left). Driver behavior is modeled as a deterministic acceleration as function of velocity, as also shown in Figure 4(top-left). The resulting velocity profile in Figure 4(right) shows a fair correspondence with a measured velocity profile and captures the most relevant aspects affecting the power request. Public 14 / 23
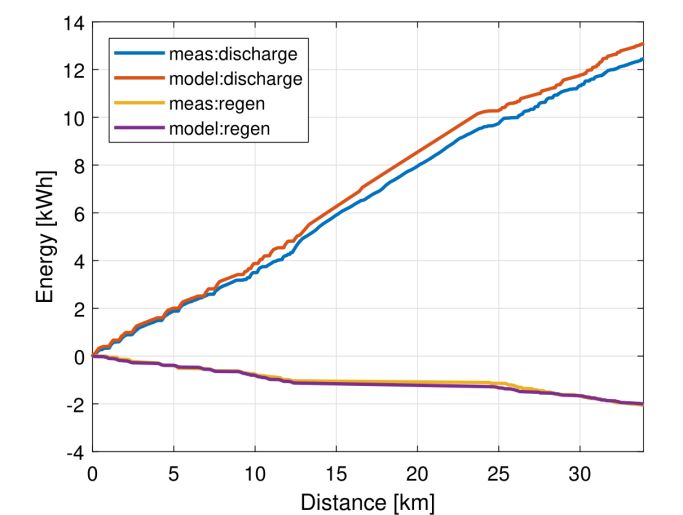
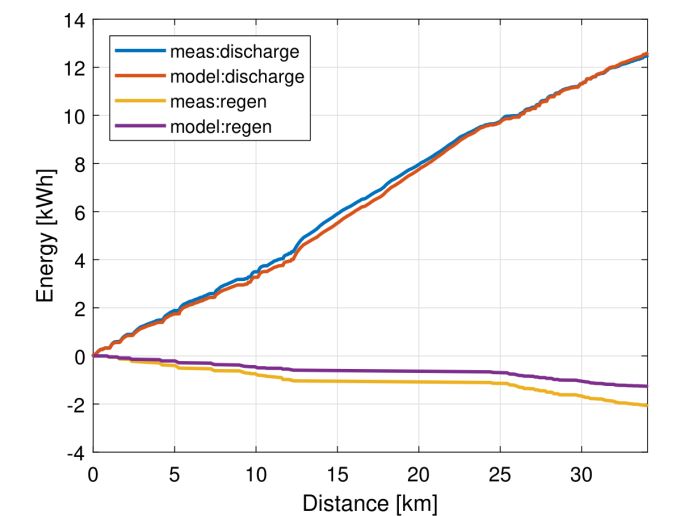
D3.3 – Report on power request prediction for electric vehicles Author: Camiel Beckers (TU/e) - February 2020 EVERLASTING - Grant Agreement 71377 (Call: H2020-GV8-2015) Electric Vehicle Enhanced Range, Lifetime And Safety Through INGenious battery management Figure 4: Input-information required for the velocity profile prediction algorithm (left) together with the resulting predicted velocity profile (right) [6]. 2.5 RESULTS & CONCLUSIONS In order to validate both parts of the model, a comparison with measured data is made. First of all, the energy consumption model is validated by using the measured velocity as input to the equations in Section 2.1. The results, displayed in Figure 5(left), show a good correlation between model and measurement, except for a slight under-estimate of the regenerated energy. Figure 5: Energy consumption comparison between prediction and measurement for a trip with the Voltia eVan, based on a measured velocity profile (left) and once based on the predicted velocity profile (right). Next, the same calculations are performed by taking the predicted velocity profile, shown in Figure 4(right), as input for the energy consumption model. The result is presented in Figure 5 (right). The result shows a correct estimation of the regenerated energy and a slight over-estimation of the dissipated energy. Ultimately, the difference between the measured and predicted energy consumption at the end of the trip is 4.48%. Note that this latter prediction only relies on the route to be supplied by the user. Public 15 / 23
D3.3 – Report on power request prediction for electric vehicles Author: Camiel Beckers (TU/e) - February 2020 EVERLASTING - Grant Agreement 71377 (Call: H2020-GV8-2015) Electric Vehicle Enhanced Range, Lifetime And Safety Through INGenious battery management Table 1: The difference between predicted and measured energy consumption for various trips. Energy Consumption Error [%] Trip 1 -1.53 Trip 2 -6.93 Trip 3 8.11 Trip 4 4.48 Trip 5 9.42 Average 6.1 The errors of other trips are listed in Table 1. Based on five analysed trips with an average length of 17.6 km, the model is fairly accurate and has an average deviation of 6% with respect to the measured energy consumption. In theory, the model is capable of including the influence of road slope and wind in the energy consumption. However, because the validation sets were recorded in the Netherlands during low-wind conditions, the model can still be validated for more extreme situations. During the development of the tool, it was concluded that the most accurate results are obtained by partial consideration of the wind speed and that adequate filtering of the height profile is important. Validation of the tool with more extreme slope and weather conditions is considered as future work. However, decent extrapolability is expected, based on the usage of a physical model and up-to-date map data. The full MATLAB-code for the tool, including connection to the aforementioned APIs, will be made freely available in [10]. Public 16 / 23
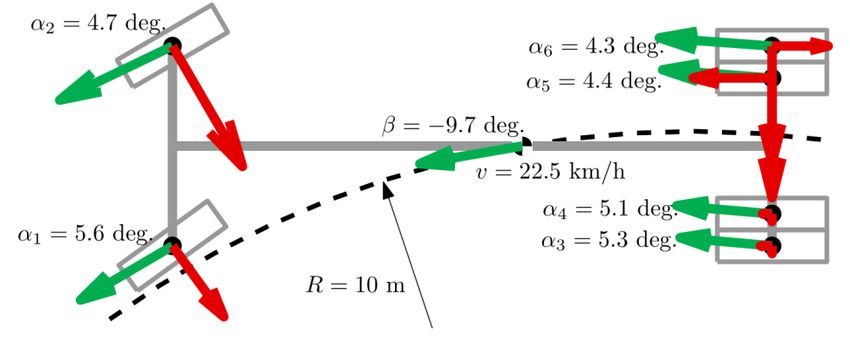
D3.3 – Report on power request prediction for electric vehicles Author: Camiel Beckers (TU/e) - February 2020 EVERLASTING - Grant Agreement 71377 (Call: H2020-GV8-2015) Electric Vehicle Enhanced Range, Lifetime And Safety Through INGenious battery management 3 ASSESSING THE IMPACT OF CORNERING LOSSES ON THE ENERGY CONSUMPTION OF ELECTRIC CITY BUSES This chapter presents results of EVERLASTING research that is focussed at extending the state-of- the-art of physical modeling of vehicle energy losses. Specifically energy losses due to tire slip while cornering are considered. This chapter is a summary based on the publications [3]–[5]. 3.1 INTRODUCTION Most conventional energy consumption prediction algorithms assume straight line driving, city bus routes have many corners. Here, we focus on the tire slip and accompanying forces that introduce additional energy losses during cornering. 3.2 MODEL APPROACH Based on a two-track model, a model accurately simulating the steady-state cornering behaviour of an electric city bus is developed. This model includes six wheels, where the two sets of double rear wheels have individual rotational velocities and . In the model derivation, linearizations are avoided: large angles are allowed and the non-linear Magic Formula is employed to calculate the tire forces. Additionally, lateral load transfer effects, due to the elevated center of gravity (CoG), are included. The developed non-linear model has four degrees of freedom: , , the steer angle 1 , and the side-slip angle . Steady-state solutions of the model are determined iteratively using an adapted Newton scheme. The model enables the calculation of all tire sliding velocities and tire forces for a given cornering situation characterized by the cornering radius and the velocity of the vehicle CoG. 3.2.1 MODEL RESULTS An exemplary result for a low radius corner is shown in Figure 6. From the result, two effects are identified that result in additional power loss during corners: cornering resistance is defined as the longitudinal rearward component of the lateral tire forces of the front tires; and tire scrub is the additional slip that occurs due to the fact that the double rear tires produce opposing longitudinal forces. Figure 6: Schematic top view of an electric city bus (gray) with the solution of the steady-state cornering model for the parameters v = 22.5 km/h and R = 10 m. The dashed line indicates the path of the center of gravity. Velocity vector = green, force vector = red. Public 17 / 23
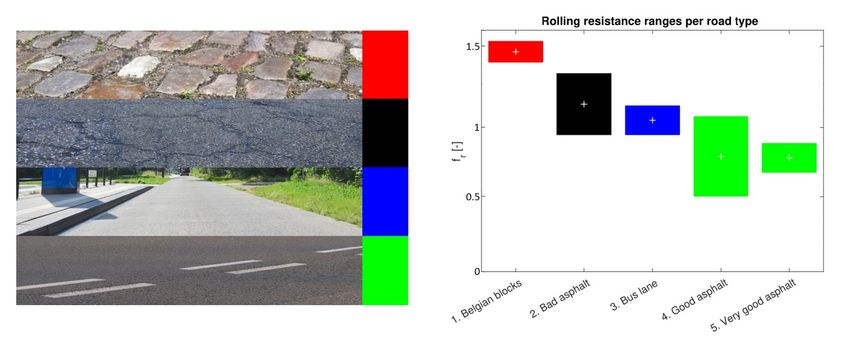
D3.3 – Report on power request prediction for electric vehicles Author: Camiel Beckers (TU/e) - February 2020 EVERLASTING - Grant Agreement 71377 (Call: H2020-GV8-2015) Electric Vehicle Enhanced Range, Lifetime And Safety Through INGenious battery management 3.3 MODEL VALIDATION The cornering energy losses model is validated by comparison to data recorded from dedicated vehicle tests, performed in collaboration with VDL. In these tests, the powertrain power was measured both during cornering and during straight line driving. The results indicate that the powertrain power indeed increases for increasing vehicle velocities and tighter corners. As indicated in Figure 7, the model is able to accurately predict the additional power that is required during driving through a tight turn. Figure 7: Average powertrain power as function of vehicle velocity as measured during steady-state cornering. Both measurements for right-hand turns and left-hand turns are shown. The straight line driving power and the power as predicted by the cornering model are also indicated. The corner radius during the shown measurement was 11m. 3.4 CORNERING LOSSES ON REAL BUS ROUTES Figure 8 presents the combined cornering losses as calculated from the model for a range of cornering situations. This figure shows that the combined cornering losses can be in the order of several kW's during real-world city trips, which is significant. Integrating the power losses over time reveals that these constitute roughly 3.1% of the total energy used by the powertrain of the vehicle. Public 18 / 23
D3.3 – Report on power request prediction for electric vehicles Author: Camiel Beckers (TU/e) - February 2020 EVERLASTING - Grant Agreement 71377 (Call: H2020-GV8-2015) Electric Vehicle Enhanced Range, Lifetime And Safety Through INGenious battery management Figure 8: Combined cornering losses as prediced by the steady-state cornering model as function of vehicle velocity and corner radius. Measured vehicle data of a city trip is also included. 3.5 CONCLUSIONS A steady-state cornering model is developed to estimate the power losses that occur during cornering of an electric city bus. It is shown that two effects can be significant for real-world driving conditions and should be included in power request prediction algorithms to improve its accuracy. Public 19 / 23
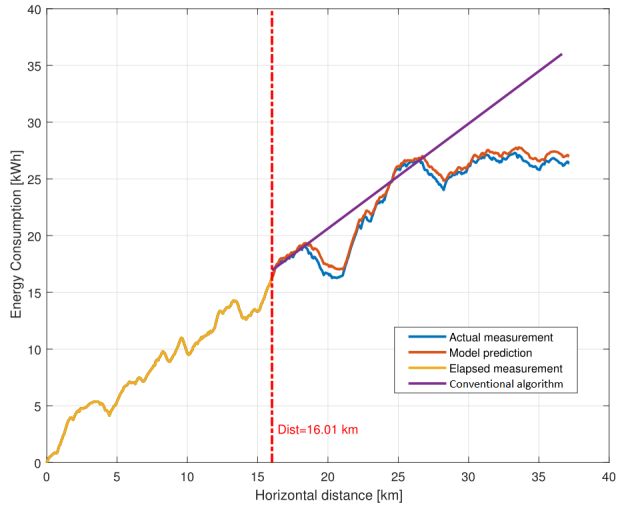
D3.3 – Report on power request prediction for electric vehicles Author: Camiel Beckers (TU/e) - February 2020 EVERLASTING - Grant Agreement 71377 (Call: H2020-GV8-2015) Electric Vehicle Enhanced Range, Lifetime And Safety Through INGenious battery management 4 ON-BOARD PARAMETER ESTIMATION FOR IMPROVED ACCURACY This chapter provides a summary of the work performed in the MSc. thesis by K. Basu [7]. The work contains simulation results that indicate the advantage of using on-board data with respect to the accuracy of the power request prediction. While the results reported here are still preliminary, final implementation on the EVERLASTING electric city bus demonstrator will show the full potential of the developed methods. 4.1 INTRODUCTION A power request prediction can provide at first an offline estimate based on the route and weather conditions, as demonstrated in Section 2. However, the assumed environmental conditions can change before or during the trip. Also vehicle parameters can change over time and may vary for different vehicles. Therefore, it is beneficial to improve or update the offline prediction based on online estimation of certain vehicle parameters. Also, by supplying up-to-date information an on-board power request prediction can assist in the development of a more dynamic bus route and charging schedule. 4.2 ONBOARD POWER REQUEST PREDICTION To improve the accuracy of the energy consumption prediction, parameter estimation is performed on measured vehicle data. The choice is made to use the available vehicle data to recursively estimate the rolling resistance coefficient . Along the trip, the estimated value, ̂ , is continuously updated by minimizing the difference between the measured and predicted power request of the powertrain. By doing so, the estimated value ̂ also changes due to possible inaccuracies in other model parameters. For instance, it is found that ̂ is also influenced by differences between estimated slope and measured road slope. The described procedure is used to determine an estimated ̂ using recorded data up untill a certain point along the trip. This value ̂ is then used to provide a prediction for the remaining part of the trip, as if the algorithm were implemented on-board on a vehicle. This on-board energy consumption prediction algorithm shows an improvement over the offline energy consumption prediction and the error is typically smaller than 5%. The online prediction algorithm is shown to provide a much better energy consumption estimate than a conventional linear power request predictor, as show in Figure 9, except at the beginning of a trip. Figure 9: Comparison of estimated energy consumption between the online prediction algorithm and estimated energy consumption using a conventional range estimation algorithm evaluated at a horizontal distance of 16.01 km. Public 20 / 23
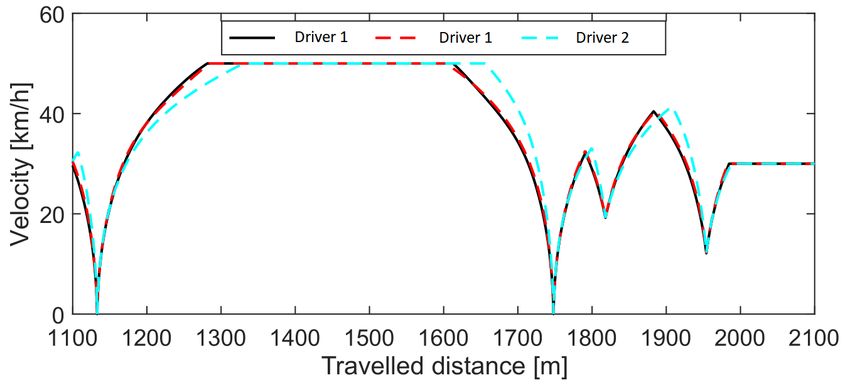
D3.3 – Report on power request prediction for electric vehicles Author: Camiel Beckers (TU/e) - February 2020 EVERLASTING - Grant Agreement 71377 (Call: H2020-GV8-2015) Electric Vehicle Enhanced Range, Lifetime And Safety Through INGenious battery management 5 DRIVER BEHAVIOR CHARACTERIZATION This chapter provides a summary of the work performed in the MSc. thesis by O. Hulsebos [8]. The work contains simulation results that indicate the potential advantage the usage of on-board data to characterize the driving behaviour of a city bus driver and subsequently incorporate this information in the power request and energy consumption prediction. While the results presented here are still preliminary, final implementation on the EVERLASTING electric city bus demonstrator will show the full potential of the developed methods. 5.1 INTRODUCTION This research focuses on estimating a driver specific velocity profile for the purpose of predicting the power request and energy consumption of an electric city bus. The focus of this research is on professional drivers, such as those operating public transport vehicles. Dedicated experiments are conducted over multiple days, where public transport drivers of electric city buses are observed during normal operation of the vehicles. During driving, the environment in front of the vehicle is caputured using video equipment, to record events that influence the drivers reaction. Furthermore, vehicle signals, such as vehicle velocity and energy consumption are recorded. 5.2 EXPERIMENT AND METHOD Initially, the results of the experiment are analysed by deviding the measured velocity profiles into sections of either acceleration, deceleration or cruising behaviour. A comparison of these sections shows that most energy is consumed during the acceleration and deceleration phases of driving. As a result, during development of the driver specific velocity profile, further emphasis is put on modeling the acceleration and deceleration of the vehicle. In order to better model the specific acceleration and deceleration behaviour of a particular driver, the measured accelerations of various drivers are compared. The acceleration as function of velocity showed homogeneity for a specific driver and heterogeneity amongst drivers, which supports the idea of a driver specific acceleration characterization. Based on the recorded data, acceleration- and deceleration profiles are determined for each of the observed drivers. This acceleration profile describes the most-likely acceleration or deceleration a driver will take, as function of vehicle velocity. This information is used in a velocity profile generation algorithm, resulting for example in Figure 10. Figure 10: Simulated velocity profile. Driver 1 was modeled two times, each from a different dataset. Public 21 / 23
D3.3 – Report on power request prediction for electric vehicles Author: Camiel Beckers (TU/e) - February 2020 EVERLASTING - Grant Agreement 71377 (Call: H2020-GV8-2015) Electric Vehicle Enhanced Range, Lifetime And Safety Through INGenious battery management The driver-specific velocity profiles, as shown for example in Figure 10, are used as input to an energy consumption prediction model, such as detailed in Section 2.1. The goal is to determine whether the modeled differences in the acceleration profiles influences the power request in a realistic manner. Simulations show that when different measurements from the same driver are used to calculate a driver-specific velocity profile, a difference of less than 1% is found in the predicted energy consumption. This indicates consistency when data from the same driver is used. Secondly, when two different drivers are characterized using the described method, the predicted energy consumption was found to differ by 17%. This is in accordance with the measured energy consumption of the two specific drivers, which differed by 14%. Therefore, the demonstrated method can largely explain and predict the observed energy consumption difference between drivers. Public 22 / 23
D3.3 – Report on power request prediction for electric vehicles Author: Camiel Beckers (TU/e) - February 2020 EVERLASTING - Grant Agreement 71377 (Call: H2020-GV8-2015) Electric Vehicle Enhanced Range, Lifetime And Safety Through INGenious battery management REFERENCES [1] C. J. J. Beckers, I. J. M. Besselink, J. J. M. Frints, and H. Nijmeijer, “Energy consumption prediction for electric city buses,” in 13th ITS European Congress, 2019. [2] J. J. M. Frints, “An improved road load model for the VDL Citea electric bus,” Eindhoven, The Netherlands, DC 2018.013, Jan. 2018. [3] C. J. J. Beckers, I. J. M. Besselink, and H. Nijmeijer, “Modeling of Energy Losses During Cornering for Electric City Buses,” in 2019 IEEE Intelligent Transportation Systems Conference (ITSC), 2019, pp. 4164–4169. [4] C. J. J. Beckers, I. J. M. Besselink, and H. Nijmeijer, “Assessing the impact of cornering losses on the energy consumption of electric city buses (submitted),” Transp. Res. Part D Transp. Environ., 2020. [5] G. P. Padilla, C. Pelosi, C. J. J. Beckers, and M. C. F. Donkers, “Eco-Driving for Energy Efficient Cornering of Electric Vehicles in Urban Scenarios (submitted),” in IFAC World Congress, 2020. [6] C. J. J. Beckers, M. Paroha, I. J. M. Besselink, and H. Nijmeijer, “A Microscopic Energy Consumption Prediction Tool for Fully Electric Delivery Vans (in press),” in EVS33 International Battery, Hybrid and Fuel Cell Electric Vehicle Symposium, 2020. [7] K. Basu, “An Online Powertrain Power Request Predictor for Electric City Buses,” Eindhoven, The Netherlands, DC 2019.103, Dec. 2019. [8] O. F. Hulsebos, “Driver Behaviour Analysis for Energy Consumption Prediction in Electric Buses,” Eindhoven, The Netherlands, DC 2020.008, Feb. 2020. [9] C. J. J. Beckers, “Dataset: A nonlinear steady-state cornering model for an electric city bus.” 4TU.Centre for Research Data, Eindhoven, 2020. https://doi.org/10.4121/uuid:e6560568- 4203-43c5-9fdb-a91bc5e2cee4 [10] C. J. J. Beckers, “Dataset: A Microscopic Energy Consumption Prediction Tool.” 4TU.Centre for Research Data, Eindhoven, 2020. https://doi.org/10.4121/uuid:721b2ea6-2634-4dd5-a0c8- 865a0aa41a99 [11] J. Flores-Paredes, “D3.4 Report on submodels and controllers of electric auxiliaries for integrated energy management,” Feb. 2020. [12] G. P. Padilla, “D3.5 Report on driving range prediction and extension algorithm,” Feb. 2020. [13] M. Ponchant, “D1.3 Report on virtual test benches (MiL, SiL, HiL),” Lyon, Aug. 2019. [14] T. G. Farr et al., “The Shuttle Radar Topography Mission,” Rev. Geophys., vol. 45, no. 2, p. RG2004, May 2007. [15] OpenWeather ®, “OpenWeatherMap.” [Online]. Available: https://openweathermap.org/current. [16] J. Wang, I. Besselink, and H. Nijmeijer, “Battery electric vehicle energy consumption prediction for a trip based on route information,” Proc. Inst. Mech. Eng. Part D J. Automob. Eng., vol. 232, no. 11, pp. 1528–1542, Sep. 2018. [17] © OpenStreetMap contributors, “OpenStreetMap.” [Online]. Available: https://www.openstreetmap.org/copyright. Public 23 / 23
You can also read