Post-COVID peak hour traffic demand management - can we do better? - IPWEAQ ...
←
→
Page content transcription
If your browser does not render page correctly, please read the page content below
Post-COVID peak hour traffic demand
management - can we do better?
Gleb Kolenbet
Moreton Bay Regional Council

Abstract:
       Commuting by car is more popular than public transport (PT) in South East Queensland (SEQ).
       Car commuting is less efficient than PT: it significantly increases congestion during peak times
       and comes at a range of costs including economic, health, social and environmental. While
       the obvious answer to ‘fixing’ congestion is to upgrade road infrastructure, in fact, building
       more roads creates an ‘induced demand’ and promotes more congestion. Recent events
       associated with the COVID-19 pandemic management in SEQ saw unprecedented measures
       such as restrictions on people movement and complete lock downs. During the peak of
       restrictions in April 2020, peak hour congestion and patronage on PT dropped significantly,
       while participation in active travel (mainly cycling) increased. At around the same time, the
       Australian Government announced that the country entered a recession and began
       ‘prompting’ the economy by introducing stimulus programs and fast-tracking infrastructure
       spending. A record $110 billion land transport infrastructure program was announced,
       spanning over the next 10 years. Local Roads and Community Infrastructure programs had a
       200% ($1 billion) fund injection, totalling a $1.5 billion commitment year on year. By August
       2020, many restrictions were lifted as SEQ entered a recovery mode. Most of the workforce
       that worked from home during the height of the pandemic began returning to workplaces and
       the traffic congestion worsened. February 2021 recorded higher congestion levels compared
       with the same period of 2020 and 2019. The recent traffic congestion data is concerning as it
       draws commuters to driving instead of using PT. ‘Fixing’ congestion isn’t simple, it requires a
       holistic approach towards improved commuter demand management in the future. Transport
       planning professionals and policy makers should explore initiatives including working from
       home (WFH), flexible start times and double shifts for schools, together with increasing
       investment into PT and active travel networks in order to better manage travel demand and
       encourage modal shift away from private vehicle.

Keywords: traffic congestion, infrastructure investment, induced demand, the rebound effect,
working from home, flexible starts, public transport, transport planning, demand management.

                                                                                                     1
Despite the transport infrastructure investment efforts by all levels of government, private vehicle
remains by far the most popular mode of commuting to work in greater Brisbane and SEQ (Figure 1)
(.idcommunity, 2020). According to transport planners, private vehicle is the least favourable option
because every private car occupant produces on average 11 times the congestion in comparison
with a bus passenger (Thomson and Bull, 2006).

Figure 1. Method of travel to work greater Brisbane and SEQ derived from ABS Census (.idcommunity, 2020).

The reliance on cars over public transport (PT) for daily commuting stems from ‘post-war planning’
which re-directed the future shape of many cities by favouring cars (Woodcock, 2019). The
population of SEQ has grown increasingly and many suburban growth corridors are spread across
vast areas, making the daily commute longer, especially during am and pm peaks. PT remains a less
popular choice because private vehicles are affordable and still offer a fast and efficient way to
travel. Between 2009-2018 the per capita PT patronage on bus and heavy rail in SEQ had decreased
(Figure 2) (Moore, 2019). This is supported by Census statistics, which shows that between 2011-
2016 the number of commuters using PT had reduced while commuting by car as driver became
more popular (Figure 3).

                                                                                                            2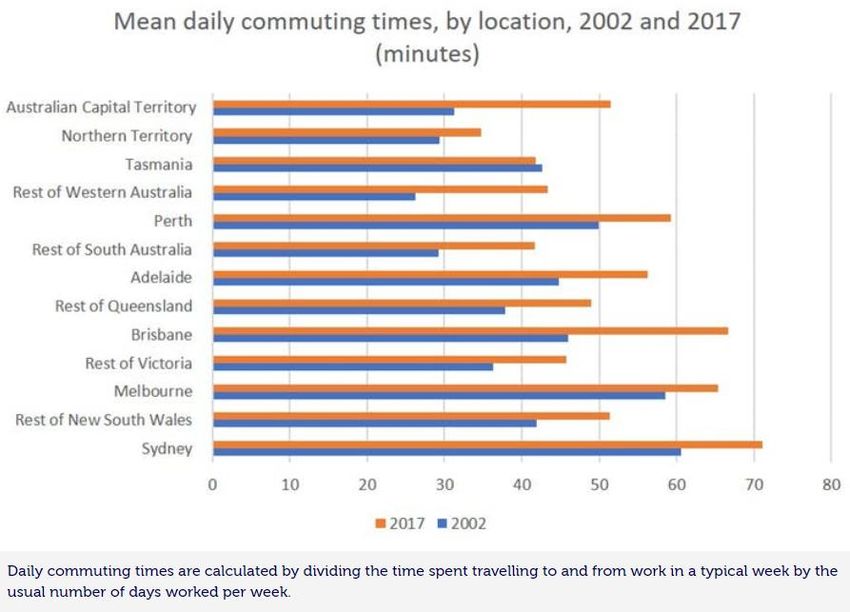
Figure 2. Bus and heavy rail patronage in SEQ for the period 2009-2018, linear statistics indicate a decline in
passenger numbers, (Moore, 2019).

Figure 3. Change in method of travel to work between Census 2011 and 2016, relative to % of employed
people. ‘Car as Driver’ commute had the biggest growth while travel by train and bus decreased,
(.idcommunity, 2020).

As a result of favoured private car commuting, Brisbane was ranked the second city in Australia after
Sydney for the longest mean daily commute (Figure 4), (Ye and Ma, 2019).

                                                                                                                  3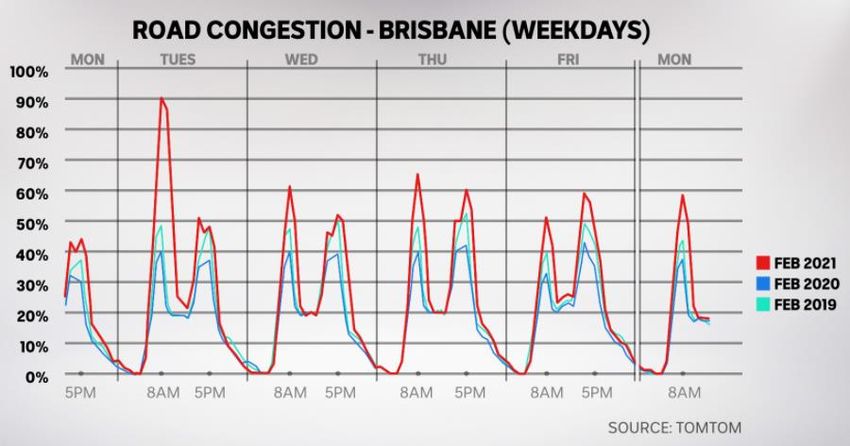
Figure 4. Mean daily commute time for major cities in Australia, Brisbane commute in 2017 is the longest in
the country after Sydney, (Ye and Ma, 2019).

Further examination of peak hour commute patterns shows that the roads become over-utilised
during congested peak periods and are otherwise under-utilised (Figure 5), (Hubbard, 2009). While
the peaks only last a few hours, peak hour design is the common criteria for infrastructure planning
and design. Subsequently, infrastructure investment decisions are made based on the worst-case
scenario and may lead to under-utilisation of the network outside of peak hours.

Figure 5. Peak-period congestion showing road underutilisation outside peak periods, (Hubbard, 2009).

                                                                                                              4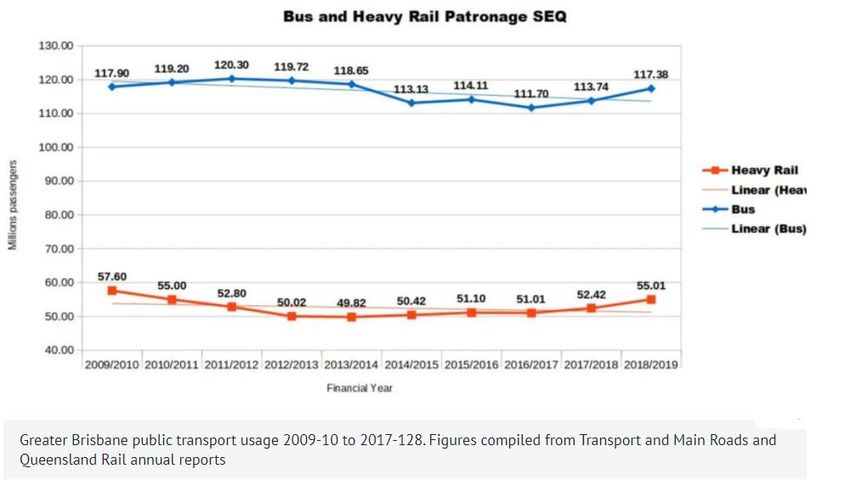
To better understand the reasons behind the above statistics, several factors are examined. One of
the main aspects influencing the commuter behaviour is the infrastructure upgrades (assumed as
road, PT and active travel infrastructure). The researched statistics for road and transport
infrastructure investment vary. According to the Australian Government (2010), several levels of
governments invested heavily into multiple ‘congestion busting’ and ‘capacity upgrade’ projects in
SEQ. Brisbane and its outer metropolitan areas received new busways, rail links, arterial roads and
motorway extensions and upgrades. In 2018, the State Government announced a record investment
in road and transport infrastructure for 2018-2022, exceeding previous years’ commitments.
Contrary to that, another report in 2020 suggested that the net per capita expenditure on
infrastructure in QLD and SEQ over the past few years was lower compared with New South Wales
and Victoria (Wardill, 2020). Overall, a significant part of governments’ expenditure is on transport
infrastructure. This is echoed by Australian Government announcement in April 2020 warning about
the proceeding recession but also ‘prompting’ the economy by introducing stimulus programs and
fast-tracking infrastructure spending. A record $110 billion land transport infrastructure program
was announced, spanning over the next 10 years. Local Roads and Community Infrastructure
programs had an unprecedented 200% ($1 billion) increase, totalling a $1.5 billion commitment year
on year (Australian Government, 2020). Additional data indicates that more than 77% of net debt
will be accumulated by Queensland, New South Wales and Victorian state governments by 2023-24
(Hutchens, 2020). This is an alarming number as the increasing net debt could reduce the states’
ability to continue funding and expanding transport infrastructure programs.

Apart from the infrastructure investment factor affecting commuter mode choice, other reasons are
investigated to explain why the commuters choose to drive a car to work over taking PT and why the
roads become congested despite major upgrades and new road links been constructed. A further
analysis applying economics paradoxes theories is explored.

The ‘Rebound Effect’ and ‘Induced Demand’
In the 19th century, the economist William Stanley Jevons observed that as coal became cheaper,
consumers used more coal. The ‘Jevons Paradox’ was observed in other areas, including traffic
congestion, also known as the ‘rebound effect’ (Leunig, 2010). Like the resource consumers’
behaviour, drivers will fill up the road infrastructure capacity over time, causing it to reach peak
capacity and create traffic congestion. Later research by engineers and scientists lead to a more
targeted and traffic-specific explanation of Jevons Paradox. The ‘Downs-Thompson Paradox’ further
confirmed that the expansion of major highway and arterial type roads leads to increased
congestion by creating an ‘induced demand’, and in some cases undermines scale economies of a
competing transit service (e.g. PT), leaving users of both modes worse off (Zhang et. al, 2016).
Further studies by the German mathematician Dietrich Braess revealed that adding a road to an
already congested traffic network increases overall journey time, which is now called ‘Braess’s
Paradox’ (Chen, 2016).

Can we just put up with traffic congestion?
It is evident that the congestion is a recurring event despite infrastructure investment, so how can
we overcome it? Can the society just put up with it? Even though some congestion is sometimes

                                                                                                       5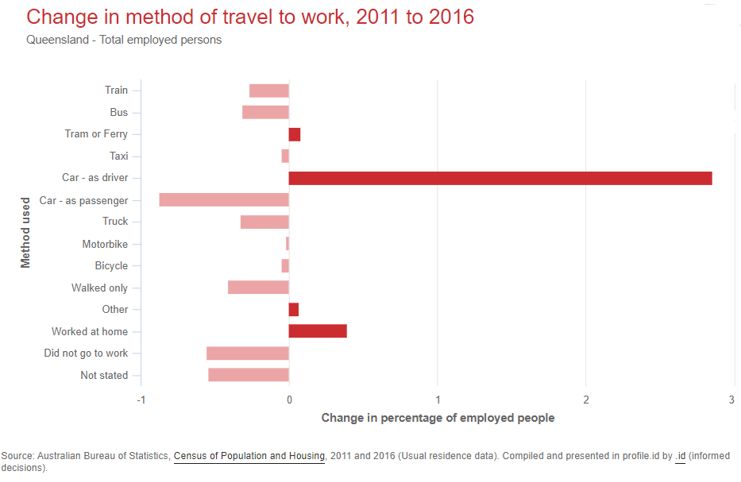
necessary and can’t be avoided, heavily congested networks come at a significant price to the
society, because of the follow-on effects. For example, the congestion on major SEQ roads alone
costs the economy nearly $160 million annually (RACQ, 2020). Also, according to Zhang and
Batterman (2013), in many cases vehicles emissions have become the dominant source of air
pollutants and the increasing severity and duration of traffic congestion have the potential to
degrade air quality, particularly near main roadways and cause negative health effects. Another
significant consequence of congestion is the infrastructure overdesign and excessive expenditure on
roads and freeways. Overdesign stems from the authorities’ approach to infrastructure planning and
design using the worst case (peak hour) scenario as a design service standard. The social cost of
increased congestion also can’t be disregarded. The excessive time spent sitting in traffic impacts
people’s personal lives (i.e. less time spend with family and friends, less exercising, less time to
socialise). Traffic congestion also impacts people’s happiness, where they choose to live and how
productive they are at work (McCosker, 2018).

It is evident that traffic congestion can negatively impact our society on many accounts, so the
engineers and planners should find a way to manage it. But how can we ‘fix’ its persistent
occurrence aside from the conventional investment into ‘congestion busting’ infrastructure
upgrades?

In drawing parallels with several paradox theories, it can be concluded that the traffic peak hour
congestion in SEQ is caused by the rebound effect and the traffic demand is induced by the available
(new and upgraded) road infrastructure. As the road infrastructure reaches capacity and the
subsequent new upgrades are completed - more consumption (induced demand) occurs, causing
traffic congestion and undermining the alternative PT modes such as buses and trains. Similarly,
infrastructure upgrades in a form of alternative routes create temporary relief but ultimately
increase overall commute time (Zhang et al, 2016). Perhaps it is time for traffic engineers and
transport planners to take a holistic approach to traffic demand management and consider other
solutions beyond the costly ‘congestion busing’ road infrastructure upgrades.

COVID-19 - effects on commute
In early 2020, the world began experiencing the effects of COVID-19. Tragically, many lives were lost,
and the effects are continuing today. Aside from the health and economic impacts, there were also
substantial changes to the way we commute. In SEQ, the changes in everyday commuting were as a
result of lockdowns, social distancing and movement restrictions, introduction of flexible working
hours, ‘work from home’ (WFH) options and school closures. The speed with which COVID-19
impacts were felt by the transport sector was significant, with road, rail and bus systems
experiencing free-falling declines in customer numbers almost overnight (Johnstone et.al, 2020). A
dramatic reduction in traffic demand resulted in noticeable declines in traffic delays. A reduction in
traffic demand resulted in reduced congestion, especially on networks with fewer routing
alternatives (Du et. al, 2020). This discovery echoes the paradox theories discussed earlier, only in
reverse - less demand equals less delay, especially for the less complex networks. So, what can we
learn from the COVID-19 effects on traffic congestion for future planning?

                                                                                                    6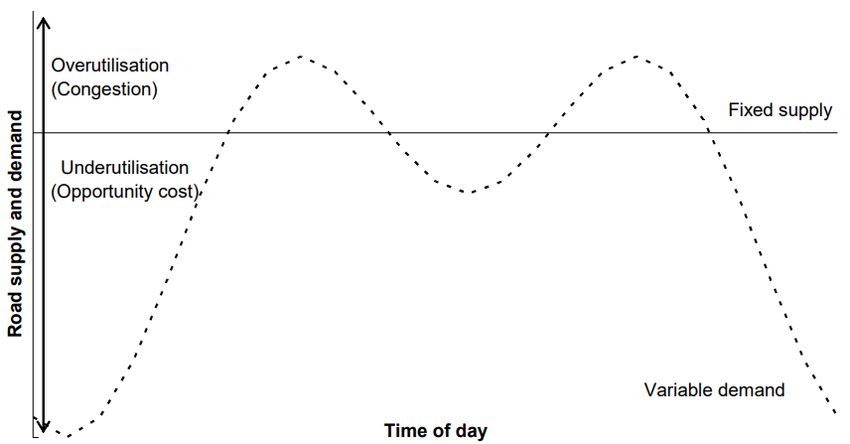
Working from home (WFH)
The effects of work-related commute on the am and pm peaks are significant as most commuters
drive to work. Subsequently, when WFH, work-related trips can be removed from networks partly or
entirely, depending on workplace arrangement (i.e. WFH on selected days or for the whole week).
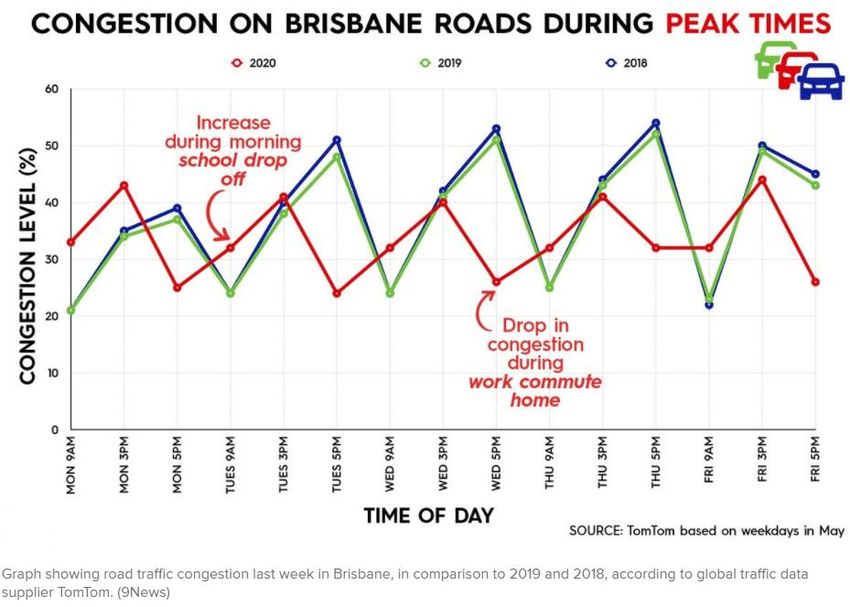
During the height of the restrictions in April and May 2020, Brisbane’s peak hour congestion levels
reduced by about 50% resulting in welcomed relief from the usual peak hour roads over-utilisation
(Figure 5). Congestion simply did not occur often during this time.
Figure 5. Observed congestion profile for Brisbane in May 2020, compared with 2019 and 2018. There is a
noticeable reduction in peak profile (extended peak) and a change in peak time - peak extension around school
travel time is explained by increased car travel to schools instead of PT (Saunokonoko, 2020).
School trips
According to PTC (2015), school trips contribute to 5-10% of peak hour traffic. Research suggests
that over 60% of children get to school in a car either as a passenger or a driver, while only a quarter
regularly walk or ride (ACT Council of P&C Associations, 2013). Even lesser number of students take
PT.
In the height of the COVID-19 restrictions, most schools switched to on-line learning. Students didn’t
travel to school, which in turn reduced the number of cars on the road in peak hour. This also
reduced peak hour congestion.
Public transport (PT)
PT patronage plummeted during the peak of pandemic restrictions. The main reasons were: (a)
capacity - PT network becomes inefficient if the passenger capacity is reduced due to strict social
distancing requirements, and (b) commuter’s perception that PT is unsafe because of higher chance
of infection transmittal (which is not completely unfounded). In addition, Brisbane had switched off
7almost 1000 parking meters in the city areas (Daoud, 2020), while most private carparking facilities
also reduced their parking fees. As a result, many ex-PT commuters turned to driving a car.
Post-COVID-19 congestion - the new normal?
As the restrictions eased in SEQ in the second half of 2020, many commuters that were working
from home began returning to work, schools have recommenced in person attendance and the
traffic numbers have climbed up. As a result of perceived risk of potential community transmission,
commuter confidence in using PT remained low. Many parents turned to car travel for school trips,
resulting in an adjustment of peak hour period and adding extra car trips onto the network. School-
related peak periods were extended and lasted longer (Figure 5).
By February 2021, private car trips have soared to new record high levels. Peak hour road congestion
was worse than in 2020 and 2019 (Figure 6), (Hosier, 2021). The only positive sign of post-COVID
traffic environment was a sharp uptake in active travel including bicycles and e-scooters.
Figure 6. Observed levels of road congestion in Brisbane for the first week of February 2021, showing a sharp
increase in congestion post-COVID compared with 2020 and 2019 records (Hosier, 2021).
Although there is hope that the COVID vaccine will restore commuter confidence in PT, experts
predict that PT network won’t ‘bounce back’ to pre-COVID numbers for some years. This could pose
a significant problem for PT authorities as the commuters form new habits of driving instead of
taking PT, a habit which will be difficult to change in the future.
Despite worldwide devastation, COVID-19 restrictions allowed for an alternative way to managing
traffic congestion - many commuters worked from home and there were significant changes to
school traffic. While these measures are unlikely to continue long term, there are lessons that can be
learned from this experience. The following part of the paper looks at the demand management
tools, which if implemented can improve congestion and encourage modal change. Each item is
given a hypothetical weighing in % of contribution to congestion reduction:
8WFH or working remotely
- During the height of restrictions Queenslanders worked from home 58% of the time.
According to Global Workplace Analytics (2020) around 60% of employees have a job where
at least some of their task can be done remotely and that the most suitable occupations for
WFH are: managers, professionals, clerical and admin and sales (Hensher and Beck, 2020).
Further studies show that ‘desks are vacant 50-60% of the time’. WFH can make a significant
difference in reducing the number of commuters and relieving peak hour traffic congestion.
According to Morse (2019), employees who can work remotely are happier, are prepared to
work longer hours, more productive and have a better work-life balance. After all, the sky
did not cave in when people were working from home during COVID restrictions.
Score: 10-15% reduction in congestion based on the reported effect of WFH during March-September
2020 (Hensher and Beck, 2020).
Improved PT network coverage, service frequency and commuter safety
- Authorities must make PT more attractive to commuters. This includes better price point,
improved network coverage and connectivity, better frequency and safety (including
hygiene in line with pandemic management plans). It is estimated that 21% of car trips can
be removed from networks by PT, which is a significant number of trips enough to make a
substantial difference to peak hour congestion.
Score: 10-15% (conservative estimate)
Flexible start and finish times and compressed working weeks at workplaces
- This is different to WFH and assumes that some employees would still travel to work but just
outside the peak commute times. This can be achieved either by early/late start and
early/late finish, by compressing a 5-day week into 4 or 3.5 days or a combination of both.
For example, an employee could start/finish their working day at home to avoid peak
commute and would commute to/from the office outside the peak hours. It doesn’t remove
trips from the road entirely, instead it flattens the peak.
Score: 2-5% (estimated)
Flexible start and finish times - schools
- By selectively changing schools start and finish time, the timing of school travel (either by PT
or by car) will shift outside of usual peak hour. This measure will be dependent on workplace
flexibility for parents (employees) to start work later in the morning. It is noted that some
Brisbane schools including Fortitude Valley State Secondary College have already adjusted
start times for school after considering the amount of road traffic as well as congestion on
PT during peak hour.
Score: 1-3% (estimated), akin to flexible workplace start score
Double-shift schooling
- Double shifts (am and pm) are introduced at selected schools. The impact on traffic
congestion may be two-fold: reduced peak and additional traffic at off peak due to a
different travel pattern to suit the double-shift study commute. This measure may be
extreme, but it has a significant additional benefit - cost-efficiency by utilising the existing
9infrastructure. Evidence-based research suggest that there may be a slight impact on
student performance at afternoon shift (Lusher and Yasenov, 2016), but overall benefits are
far greater.
Score: 1-2% (estimated), although the effects of extended peak need to be examined carefully
Improved active travel network and end of trip facilities
- This is another measure which has additional benefits - a more active, healthier community.
Score: up to 1% (estimated)
Other key tools such as road pricing (congestion tax, distance or time-based fees, tolls etc.) and land
use planning initiatives (increased density near PT nodes etc.) were not reviewed as part of this
paper, however they should also be examined as part of additional studies.
A 25%-46% congestion reduction is derived by adding all the scores. The lower (25%) score
represents a conservative estimate, however it can provide a significant reduction in peak traffic,
enough to considerably improve congestion. The subsequent effect of congestion improvement
using demand management is a delay or even a complete reduction in road infrastructure
expenditure and re-diversion of funding onto improving PT and active travel networks.
Summary
Private car commuting remains a popular choice in SEQ and casues peak hour congestion, resulting
in productivity loses, increased pollution, and negative health and social impacts. There is a high cost
to the economy. Several theories inlcuding Jevons, Downs-Thompson and Braess’s Paradoxes explain
that investing into road infrastracture alone can not provide long-term relief from congestion.
Congestion rates plammeted during COVID-19 due to restrictions and changes in commuter behavior
including less trips because of WFH and distance education. However, by February 2021 congestinon
rates have soared, surpassing previous years levels. A holistic approach to congestion management
identifies a number of initiatives that can make a significant difference in reducing congestion and
possibly redirecting some of the road infastructure funding to PT and active travel networks in order
to promote and support a modal shift away from private car commute.
References
ACT Council of Parents & Citizens Associations (2015). School traffic in the spotlight. [online] ACT Council of
Parents & Citizens Associations. Available at: https://www.actparents.org.au/index.php/news1/item/213-
school-traffic-in-the-spotlight [Accessed 3 January 2021].
Affabuzaman, Md., Currie, G., and Sarvi, M. (2010). Evaluating the Congestion Relief Impacts of Public
Transport in Monetary Terms. Journal of Public transportation, [online] 13(1), pp. 1-24. Available at:
https://scholarcommons.usf.edu/jpt/vol13/iss1/1/ [Accessed 25 Nov 2020].
Australian Government, (2010). An overview of transport investment and government policy. [online]
Available at: https://treasury.gov.au/speech/an-overvieiw-of-transprot-investement-and-government-policy
[Accessed 20 Dec 2020].
Australian Government, (2020). 2020-21 Budget. [online] Available at:
https://investment.infrastrcuture.gov.au/about/budget.aspx [Accessed 20 Dec 2020].
10Chen, W. (2016). Bad Traffic? Blame Braess' Paradox. Forbes Quora Consumer Tech, [online]. Available at:
https://www.forbes.com/sites/quora/2016/10/20/bad-traffic-blame-braess-paradox/?sh=25620bfe14b5
[Accessed 28 Dec 2020].
Daoud, E. (2020). Brisbane to turn off all parking meters amid coronavirus pandemic. 7News, [online] Available
at https://7news.com.au/travel/coronavirus/brisbane-to-turn-off-all-parking-meters-amid-coronavirus-
pandemic-c-764791 [Accessed 28 Dec 2020].
Du, J., Rakha, H.A., Filali, F. and Eldardily, H. (2020). COVID-19 pandemic impacts on traffic system delay, fuel
consumption and emissions. International Journal of Transportation Science and Technology [online]. Available
at: https://doi.org/10.1016/j.ijtst.2020.11.003 [Accessed 2 Jan. 2021].
Hensher, D and Beck, M (2020). The work-from-home revolution has seen peak-period congestion drop by 10-
15%: How do we maintain this shift post-COVID-19? [online] Smart Company. Available at:
https://www.smartcompany.com.au/industries/transprot-logistics [Accessed 3 Jan. 2021].
Hubbard, P. (2009) Urban Congestion - why ‘free’ roads are costly. Economic Roundup, [online] (2). Available
at: https://cdn.treasury.gov.au/uploads/sites/1/2017/06/01_Urban_congestion.pdf [Accessed 10 Dec. 2020].
Hutchens, G. (2020). Federal, state and territory government net debt to hit $1.4 trillion in four years. ABC
News, [online]. Available at https://abc.net.au/news/2020-12-03/states-and-territories-budgets-net-
debt/12941168 [Accessed 28 Dec. 2020].
.idcommunity. Demographic resources, community profile, Queensland, Method of Travel to work, [online].
Available at: https://profile.id.com.au/australia/travel-to-work?BMID=42&WebID=120 [Accessed 10 December
2020].
Johnstone, A., Colussi, L., Monk, B., Kendall, A., Bennett, M. and Diep, K. (2020) Why should travel demand
management be considered for cities and regions in a post-COVID world? [online]. Available at:
https://www.aurecongroup.com/markets/transport/future-of-transport/transport-demand-post-covid19
[Accessed 10 Feb, 2021].
Leunig, M. (2010). The opposite is true. The Sydney Morning Herald, [online]. Available at:
https://www.smh.com.au/politics/federal/the-opposite-is-true-20101112-17qd2.html [Accessed 28 Dec 2020].
Lusher, L. and Yasenov, V. (2016). Double-shift schooling and student success: Quasi-experimental evidence
from Europe. Economics Letters [online] 139, pp.36-39. Available at:
https://www.sciencedirect.com/science/article/abs/pii/S0165176515005182 [Accessed 2 Jan. 2021].
Hosier, P. (2021). Brisbane roads choked with 'alarming' congestion worse than pre-COVID as commuters
reluctant to return to public transport. ABC News, [online]. Available at: https://www.abc.net.au/news/2021-
02-09/coronavirus-queensland-brisbane-traffic-congestion-
transport/13121108?utm_source=abc_news_web&utm_medium=content_shared&utm_content=link&utm_c
ampaign=abc_news_web [Accessed 8 Feb 2021].
McCosker, R. (2018). Brisbane peak hour: When the gridlock starts and ends. Brisbane Times [online]. Available
at: https://www.theage.com.au/interactive/2018/peak-hour-project/bespoke-features/brisbane-
1.html?resizable=true&v=6 [Accessed 3 Jan. 2021]
11Moore, I. (2019). As SEQ's population grows, per capita public transport usage falls. Brisbane Times, [online].
Available at: http://brisbanetimes.com.au [Accessed 2 Jan. 2021].
Morse, B. (2019). Study says that remote workers are happier and stay in jobs longer. Businessinsider, [online].
Available at: https://www.businessinsider.com/study-says-remote-workers-are-happier-stay-in-jobs-longer-
2019-9 [Accessed 2 Jan 2021].
PTC. (2015). School Traffic: How much can Sydney take? PTC. Parking [online]. Available at:
https://www.ptcconsultants.co/school-traffic-much-can-sydney-take/ [Accessed 3 Jan. 2021].
Queensland Government, (2018). Palaszczuk Government delivers third year of record road and transport
infrastructure investment. [online] Available at: https://statements.qld.gov.au/statements/84714 [Accessed 3
Jan. 2021].
RACQ (2020). The $156 million traffic burden Queensland can’t afford. RACQ Media, [online]. Available at:
https://www.racq.com.au/Live/Articles/MR-250720-The-156-million-traffic-burden-Queensalnd-cant-afford
[Accessed 3 Jan. 2021].
RACQ (2021). Staggered school start times worth investigating: RACQ. RACQ Media, [online]. Available at:
https://www.racq.com.au/Live/Articles/NS-110221-Staggered-schol-start-times-worth-investigating-RACQ
[Accessed 11 Feb. 2021].
Saunokonoko, M. (2020). Coronavirus worsening school run traffic in Sydney and Brisbane. 9News, [online]
Available at: https://www.9news.com.au/national/coronavirus-school-run-traffic-in-sydney-and-brisbane-
worse-than-usual/d04bdf03-5050-4bbb-af21-6602ec9f2ed6 [Accessed 28 Dec. 2020].
Thomson, I. and Bull, I. (2006). Urban traffic congestion: Its economic and social causes and consequences.
CEPAL Review, [online] 2002(76) pp. 105-116. Available at: https://doi.org/10.18356/f43aec5d-en [Accessed 2
Dec. 2020].
Wardill, S. (2020). State’s $12B Black Hole. The Courier Mail, p.4-5.
Woodcock, I. (2019). It’s time to move beyond the false binary of roads vs public transport. Foreground,
[online], Available at: https://www.foreground.com.au/transport/its-time-to-move-beyond-the-false-binary-
of-roads-vs-public-transport/ [Accessed 2 Jan. 2021].
Ye, R., and Ma, L. (2019). Australian city workers’ average commute has blown out to 66 minutes a day. How
does yours compare? The Conversation, [online] Cities. Available at: https://theconversation.com/australian-
city-workers-average-commute-has-blown-out-to-66-minutes-a-day-how-does-yours-compare-120598
[Accessed 28 Dec. 2020].
Zhang, F., Lindsey, R., and Yang, H. (2016). The Downs–Thomson paradox with imperfect mode substitutes and
alternative transit administration regimes. Transportation Research Part B: Methodological, [online] 86,
pp.104-127. Available at: https://www.sciencedirect.com/science/article/pii/S0191261515300175 [Accessed
28 December 2020].
12You can also read