A first step towards understanding popularity in YouTube
←
→
Page content transcription
If your browser does not render page correctly, please read the page content below
A first step towards understanding popularity in
                         YouTube
                                  Gloria Chatzopoulou, Cheng Sheng, Michalis Faloutsos
                                        Department of Computer Science & Engineering
                                              University of California, Riverside
                                                  Riverside, California 92521
                                         Email: {chatzopd,shengc,michalis}@cs.ucr.edu

   Abstract—Being popular in YouTube is becoming a fundamen-        representing an action the user takes in response to liking or
tal way of promoting one’s self, services or products. In this      disliking the video or feeling a need to comment and judge.
paper, we conduct an in depth study of fundamental properties       In the rest of this paper, we will use # to denote “number of”,
of video popularity in YouTube. We collect and study arguably the
largest dataset of YouTube videos, roughly 37 million, accounting   as in #comments. We use the term categories as defined by
for 25% of all YouTube videos. We analyze popularity in a           YouTube, that is, each video is assigned to one such category
comprehensive fashion by looking at properties and patterns         by the author. Besides, YouTube provides standard feeds,
in time and considering various popularity metrics. We further      which are lists of top videos along two dimensions: (a) metric
study the relationship of the popularity metrics and we find        of interest, and (b) interval of interest (today, week, month, all
that four of them are highly correlated (viewcount, #comments,
#ratings, #favorites) while the fifth one, the average rating,      time). For example, there is a feed for “Most viewed” videos of
exhibits very little correlation with the other metrics. We also    “Today”, and a feed for “Most Discussed” of “Today” meaning
find a “magic number” in the average behavior of videos: for        the videos with highest #comments for that day. The last
every 400 times a video is viewed, we have one of each of the       feature that we explore is the related videos. YouTube using
following user actions: leaving a comment, rating the video and     proprietary algorithms provides a list of “related videos” for
adding to one’s favorite set.
                                                                    every video a user watches. We create the related video graph
                      I. I NTRODUCTION                              (RVG) which is a directed graph where nodes are videos and
                                                                    an edge e(u,v) represents that video v appears in the related
   Becoming popular in YouTube is essential for marketing           video list of video u. Given this graph we analyze relationships
services and products. For example, there are cases of artists      between videos.
who became “Internet phenomena” via YouTube, thus jump-                Several measurements studies of YouTube have analyzed
starting in their careers. Naturally, people have developed         different statistical and behavioral properties, but none have
ways to boost their visibility in YouTube by increasing the         studied popularity as exhaustively as we do here. Recent
popularity of their videos. Taking this one step further, there     works, [1]–[8] study distribution and temporal patterns of
are software and services that promise to boost one’s video         viewcount. To the best of our knowledge, our work is the
popularity for a fee. At the same time, YouTube is making           first to study other popularity metrics together with viewcount.
efforts to address these artificial means of gaming the system.     [1], [7], [8] propose several solutions to the problem of video
The above prompted us to study the popularity of videos at          spam, while [2], [6], [9], [10] analyze several social networks
YouTube.                                                            within YouTube.
   The overarching goal of our work is to understand fun-              In this paper, we conduct an in depth study of the funda-
damental properties of video popularity in YouTube. In fact,        mental properties of video popularity in YouTube. We collect
defining popularity itself is not as straightforward as one may     arguably the largest dataset of YouTube videos, containing
think. Different aspects of popularity are captured by various      more than 37 millions of video metadata. Our data accounts for
“popularity metrics”, which we will introduce shortly. We           roughly 25% of all YouTube videos. We study video popularity
believe that an in depth study of popularity is necessary to        in three different aspects: (a) in time, (b) by using multiple
understand the relationship and temporal patterns of all these      popularity metrics, and (c) across different categories of videos
metrics.                                                            as provided and labeled by YouTube.
   We provide a quick overview of the terminology we use in            Our contributions can be summarized in the following key
this paper. We use viewcount (the number of times a video is        points:
watched) as the fundamental parameter of popularity and study          • Four of the popularity metrics (viewcounts, #comments,
the its relationships with other popularity metrics: number                #ratings, #favorites) are highly correlated. By contrast,
of comments, number of favorites, number of ratings, and                   the average rating exhibits very little correlation with
average rating                                                             the other metrics. We develop a simple linear regression
   In fact, these metrics capture the reaction of users to a               model to estimate viewcounts as a function of the other
video, since they go beyond simply watching a video, by                    metrics which captures 76.8% of the variability of view-
TABLE I
count, as we discuss later. A potential use of such a model P OPULARITY M ETRICS : BASIC S TATISTICS OF OUR C RAWLED DATASET
could be to identify candidate videos of abnormal activity
(artificial boosting of a video’s metrics). Metric Min Max Avg Description
viewcounts 0 114m 11k Number of views
• A user actively “reacts” to a video 1 in every 400 times
#comments 0 598k 18.98 Number of comments received
on average: a video receives a comment, a rating, and is Number of times added to other
#favorites 0 669k 30.31
added to someone’s favorite list once for every 400 times users’ favorite lists
#ratings 0 488k 21.95 Number of ratings received
it is viewed. In a counter-intuitive way, the user response
avg rating 0 5 3.51 Average rating, range from 1 to 5
ratio (i.e. number of comments per thousand views)
decreases as a function of the number of viewcounts. In
other words, as a video is seen by an increasing number owners which impose these restrictions is very small. While
of people, it elicits less acute reaction. regular users can view these metrics from the video web page,
• A video does not stay for more than two days in the top
the YouTube API [11] provides researchers efficient access
100 of the “Today” standard feeds for all the feeds that we through a programming interface.
examined (most viewed, most popular, most responded,
top rated, most discussed, and top favorites). This indi- B. Data Collection
cates that standard feeds are very competitive, and that To collect data, we refrained from directly crawling the
a video has a small window of opportunity to climb to YouTube site and we used instead the YouTube Data APIs.
prominence through those feeds, which is reportedly a We populate a local database with their meta-data information
common practice. Users exhibit similar daily patterns of collected using the APIs. Similarly, we query the meta-data
accessing videos but potentially different weekly patterns. of users, comments, related videos, subscriptions and many
The daily periodicity of the user behavior (video upload other perspectives using APIs and populate separate tables.
and comment posting) is the same for all types of videos, The YouTube API limits the related video list to 100 for
and the peak time is 1 PM Pacific Time. every video. Once we collect the video information from the
• The related video graph exhibits that the related video
standard feeds, we query the related videos of each video
relationship is reciprocal for 36% of the video pairs. The in the standard feeds. We recursively go and populate our
top-5 videos with highest viewcount are highly connected database with the information of videos in the related list.
in the related video graph in other words one video We also populate metadata for comments, authors and other
appears in the related video list of the others. perspectives from videos information.
The remainder of the paper is organized as follows. In Sec- Our crawling system contains a data server and several
tion II, we present background information and our crawling crawlers. Crawlers communicate with YouTube, and send the
method as well as the collected results. Section III discusses collected data back to data server. Several crawlers can work
the correlations among the metrics of popularity. In Section IV, in parallel to achieve better scalability and reliability.
we report some temporal properties of the popularity metrics By running the crawling system between February to June
and study the standard feeds and their effects in videos’ 2009, we have collected the most exhaustive dataset (as far as
popularity metrics. We construct and analyze the related video we know) about the YouTube site, which contains 20 tables
graph in Section V. In Section VI we briefly discuss related regarding information about various perspectives. The number
work and finally, Section VII concludes our work. of records for metadata of videos, users and comments are
II. BACKGROUND AND DATA C OLLECTION 37.9 million, 1.4 million and 41.1 million respectively.
A. Background C. Metrics
We give a brief introduction of YouTube and review several In this study, we focus on five metrics provided by YouTube,
important features on it. After watching a video, users can viewcount, number of comments, number of favorites, number
give feedback in several ways. They can post one or more text of ratings and average rating. Although all these metrics reflect
comments to a video, rate the video on a five star scale, or the degree of popularity for each video, viewcount is widely
add it to their set of favorite videos. A user is allowed at most regarded as the basic video popularity metric. Table I shows
once to rate a video and to add a video to his/her favorite set. the minimum, maximum and average value of these metrics.
These feedbacks are measured by several popularity metrics in For each video, we also record its category. At the time of
YouTube, such as viewcount, #comments, #favorites, #rating crawling, YouTube had 29 categories, a combination of 15
and avg rating. YouTube considers viewcount as the funda- regular categories and 14 HD video categories. Music and
mental parameter of popularity, and is very careful to not count Entertainment are the largest two categories, accounting for
viewcount multiple times for the same IP in a short period. 45% of videos in our dataset.
Users’ personal preference are denoted by #favorites, showing
whether a video is preferred and will be watched again. A III. R ELATIONSHIPS AND C ORRELATIONS OF M ETRICS
video owner has the freedom to block comments and/or ratings Using our dataset, we explore the correlations between
at will. We acknowledge that this capability might distort different popularity metrics. In this section, we first analyze the
slightly our results but we believe that the percentage of video pairwise correlations among the five popularity metrics. Then,TABLE II TABLE III
C ORRELATIONS - V IEWCOUNT AND EVERY OTHER POPULARITY METRIC C ORRELATION STRENGTH OF VIDEOS GROUPED BY VIEWCOUNT
Pearson Correlation Coefficient Viewcount Ranges
Variable
with Viewcount Popularity metrics ≤ 1K 1K − 10K 10K − 100K ≥ 100K
#comments 0.609 #comments 0.234 0.195 0.236 0.560
#favorites 0.821 #favorites 0.327 0.377 0.452 0.771
#ratings 0.756 #ratings 0.265 0.239 0.324 0.779
#avg rating 0.045 avg rating 0.324 0.092 0.028 0.002
#comments vs viewcount #ratings vs viewcount group. As shown in Table III we calculate the PCC between
5
10 10
4
viewcount and the other four metrics for each group. We ob-
serve that pairwise correlations (except those with avg rating)
increase with video popularity. This result can be supported
#comments
#ratings
10
2 by empirically examining several popular videos. It is not
surprising to see a popular video with a large number of
comments, ratings and favorites at the same time. This is also
0 0 confirmed by our study on standard feeds, as we will show in
10 0 10 0
10 10
5
10
10
10 10
5
10
10
Section IV.
viewcount viewcount
5
#favorites vs viewcount average rating vs viewcount B. Estimation of Viewcount
10 5
A widely used statistical tool to model the functional
4 relationship between a dependent variable Y and a set of
average rating
#favorites
3 independent variables X is linear regression. We employ linear
2
regression to build an estimation model of viewcount given a
set of indicators, the other popularity metrics. We use R-square
1
[12] as a measure of our model’s performance1 . As a first step,
we apply the forward selection stepwise screening method
0
10 0 5 10
0 0 5 10
10 10 10 10 10 10
viewcount viewcount in order to identify the influential variables that should be
included in the final model. This method selected the following
Fig. 1. Visualization of Correlation of viewcount and the other popularity three variables: #favorites, #comments, #ratings.
metrics. All pairs exhibit strong correlation apart from viewcount vs average
rating. The Complete Model. Following the standard methodology,
we initially build the full second order model using these three
we present our linear regression model, which can potentially variables. The model contains 9 terms, the first order terms,
be used to detect video spams. Finally, we study ratios between the second order terms and their pairwise interactions (e.g.
viewcount and the rest of the metrics. the pairwise products). The R-square of the model is 0.7855
A. Pairwise Correlations which is high enough to trust our model.
The Simplified Model. Going one step further, we reduce
Strong correlations are observed among most metrics. the complete model to a simplified model that contains only
Viewcount is the index of popularity of a video. We calculate four terms. We tested and verified the hypothesis that the two
the Pearson Correlation Coefficient (PCC) between viewcount models are statistically equivalent. The mathematical equation
and each of the indicator variables. PCC is the most common of the simplified model is given by Equation 1.
metric to measure the dependence between two quantities. A
summary of the PCC metric is included in Table II. Viewcount
is highly correlated with #comments, #favorites and #ratings. �
viewcount = 3201.588F 2 − 0.014R2
The average rating is the only variable which spans between +14.059F + 391.011R + 5220.755 (1)
zero and five. We believe that this peculiarity might be a reason
for the low correlation with viewcount. To visualize these where F=#favorites and R=#ratings
correlations, we randomly select 10,000 videos, and plot the The simplified model has an R2 = 0.768 which is a small
values of the popularity metrics in pairs, as shown in Figure 1. change compared to the R2 of the complete model. All
We can observe obvious linear trend for correlations between predictors have a significant contribution to the model. We
viewcount, #comments, #favorites, and #ratings, while the used the F-test to compare the R-square values of the two
correlation between viewcount and avg rating is unclear. models. Using this test as hypothesized, the simplified model
Correlations increase with popularity. It is natural to ask performs as well as the the complete model.
whether the metrics of more popular videos become more As future work, we intend to use this model to identify large
correlated among each other. To address this question, we deviations of the viewcount of videos. These videos can be
group our videos into four popularity groups in terms of 1 R2 coefficient of determination is the proportion of variability in a dataset
viewcount, and randomly select 100,000 videos from each that is accounted for by a statistical model.
considered as candidates for further investigation to determine
if their popularity has been artificially boosted.
C. Analyzing the ratios between popularity metrics
In this section, we want to quantify the “active response” of
users to a video, as explained earlier. Specifically, we define
the following metrics:
a) comment ratio: defined as #comments/1K viewcounts. Fig. 2. Response strength (comment ratio) for videos in different viewcount
groups
It represents the desire of the users to respond to the
video by leaving a comment.
b) favorite ratio: defined as #favorites/1K viewcounts. It
captures the desire of the user to become a “fan” of the
video.
c) rating ratio: defined as #ratings/1K viewcounts. It rep-
resents the desire of the user to evaluate the video.
Since the value of viewcount is usually much larger than
other metrics, we count actions per thousand viewcounts.
Fig. 3. Hourly video upload rates in a week
A video receives one comment, one rating, and is added
to someone’s favorite list once for every 400 times it is A. Daily and Weekly Patterns
viewed. We first examine the average value of these three To study daily and weekly popularity patterns, we analyze
ratios. Surprisingly, they are all close to 2.5, which means the video upload rate and comment rate on each hour of the
that a video tends to receive all three user reactions/responses week. Due to space limitations, we only present video upload
(a comment, a rating and being added to a user’s favorite list) rate, since the comment rate has very similar behavior. We
each time it is viewed 400 times. This suggests two interesting start by grouping the videos into 24 x 7 bins according to
things. First, responding to a video is an indication of a strong the hour of week they were published. E.g. a video published
reaction: responding takes more effort than simply watching on 3 AM, Monday belongs to bin 3. Then, we normalize the
it. In addition, responding requires the user to login, while number of uploads in each hour by the maximum value across
watching a video does not require loging in. Second, the all the bins. Figure 4 shows the normalized hourly upload rate
probability of a user making a comment, giving a rating and with a solid line, revealing two patterns, daily and weekly.
adding a favorite item are equally likely. Note that we don’t
know if the three actions are taken by the same user, due to Daily peak occurs at 1 PM, and weekly peak is on
the way we collected the data, but it could be an interesting Sunday for most video categories. On each day, the upload
future direction. rate reaches the peak at 1 PM and the valley at midnight.
Moreover, Sunday is the most active day in a week, followed
The ratios decrease as a function of viewcount. We also by Monday. We also delve further into subsets of videos
study the correlation between the ratios and the absolute across different categories, and see that these two patterns
number of viewcounts. Intuitively, we tend to believe that also apply to many categories, such as Comedy, Film, and
more popular videos will be commented, rated, or added into Music. Note that most of these categories are entertainment
favorite lists more frequently. To verify this, we divide videos oriented, therefore people visit them more often during their
into four groups, according to their viewcount. We show the spare time. This is an explanation of the weekly peak on
comment ratio of each group in Figure 2. Surprisingly, we Sunday and daily peak during lunch break. However, several
discover that the reaction strength is stronger among less categories exhibit a slightly different weekly pattern, such
popular (in terms of viewcount) videos. This may suggest that as Education, Howto, News and Nonprofit. We represent the
the first viewers of a video are more likely to have active hourly upload rates for videos in News by the dashed line in
reactions to it. We only have a histogram for comment ratio the same figure. We observe a decrease on weekend activity
here, since the corresponding values for favorite ratio and compared to weekdays. We should note that the reported times
rating ratio are similar. are based on the Pacific Time Zone. Given that YouTube is
globally accessible it is hard to draw conclusions about time
IV. T EMPORAL PATTERNS
and users’ location.
In this section, we analyze temporal properties of video
popularity. We first analyze short term trends. Specifically, B. Long Term Trends
we show how popularity metrics evolve daily and weekly. We study the long term popularity trends by analyzing the
Then, we observe the long time trend to understand how relationship between video age and each of the popularity
popularity metrics increase or decrease over months or even metrics. We bin our videos by their age (in days), and then
years. Finally, we focus on very popular videos within a daily calculate the average value of each of the five metrics. The
timeframe. result is shown in Figure 4. Note that we exclude videos
Fig. 4. Popularity metrics vs video age
TABLE IV
T HE AVERAGE PERCENTAGE OF VIDEOS THAT APPEAR TWO CONSECUTIVE Fig. 5. The Related-Video Graph
DAYS IN A STANDARD FEED
TABLE V
Standard Feed Day by Day similarity R ELATED -V IDEO G RAPH STATISTICAL PROPERTIES
most viewed 17.2%
most popular 23.3% Vertex Count Edge Count max IN degree avg. IN degree
most responded 54.6% 6062 40255 142 6.64
top rated 33.1%
most discussed 30.6%
top favorites 28% attention from the users. The videos in the most popular and
most responded feeds deviate from the above behavior since
which are older than 1200 days, because during that early the ranking of these videos seems to drop by 2-4 positions
stage there were few videos uploaded per day and thus create between two consecutive days. The most responded standard
meaningless statistics. We observe that all metrics except feed is the most stable among the rest since more than 50%
avg rating increases with the age of the videos. Interestingly, of the videos remain a position in the feed within the 2 day
avg rating decreases with age, from 4.7 to 4.2, which requires timeframe and the rank of these videos just falls 4 slots behind.
further investigation to lead to an explanation. Our explanation for the above behavior is that one video can
only be a video response to at most one other video which
C. Standard feeds means that it needs more effort from the users in order for a
The standard feeds contain videos that have attracted users’ video to get a long list of video responses. The videos will
attention during a particular timeframe. Users react in the almost never appear in a standard feed for three consecutive
view of a video by commenting, responding, forwarding to days. The videos in the most responded standard feed with
their friends etc. YouTube logs multiple standard feeds that probability 33% appear in the feed for three consecutive days.
correspond to different reactions of the users. We examine the Given this finding, we conclude that the users who are aiming
“Today” (daily) standard feeds. More precisely these feeds to make their videos popular should focus on launching videos
are: most viewed, most popular, most responded, top rated, that can potentially receive a lot of video responses.
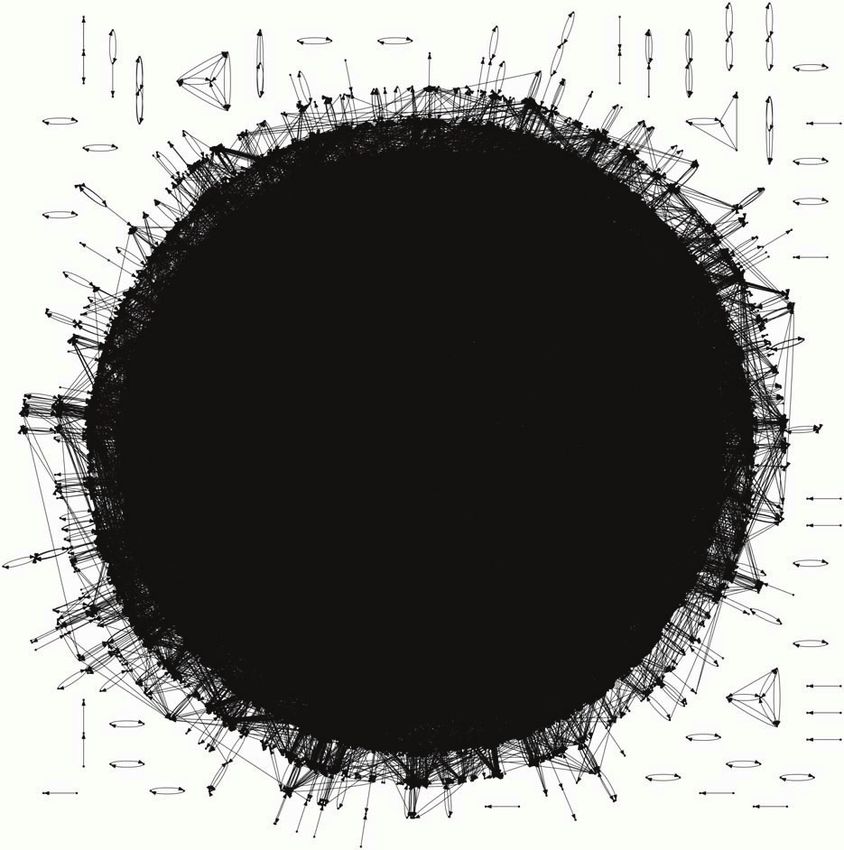
most discussed, top favorites. We examined the daily standard V. R ELATED V IDEOS N ETWORK
feeds of 12 consecutive days (10/20/2009-11/1/2009). Every
feed contains 100 videos. First, we compute the overlap of the In this section, we analyze the related video graph (RVG).
various feeds for every single day. A video that appears in the Our goal here is to visualize and model the “related videos”
top rated standard feed with probability 50% will appear in the relationship of the most popular videos. Clearly, videos that
top favorites standard feed and with probability 62.67% will appear as “related videos” to multiple other videos get an
appear in the most discussed standard feed. In other words, advantage of being viewed more.
half of the people that give full credit to the video will also RVG is a directed graph where nodes are videos and an edge
add it to their favorite set and post at least a comment about e(u,v) represents that video v appears in the related video list
it. of video u. Since we are interested in the most popular videos,
We also analyze how the standard feeds evolve day by day. we created the graph using videos with viewcount greater than
We define self similarity of one standard feed between two 1.5M. Figure V shows the visualization of the RVG. Table
days as the percentage of videos that appear in the feeds V shows some basic statistics of the graph. Interestingly, the
of both days. Table IV lists self similarity of standard feeds Giant Weakly Connected Component of the graph contains
between two consecutive days. The self similarity of standard 98.33% of the nodes.
feeds during two consecutive days are very consistent for The “related-video” relationship is reciprocal for 36% of
the twelve days that we monitored them. Every video in the video pairs. We check the hypothesis that the related video
standard feed has a rank, the position it appears in the standard relationship is reciprocal. We use the dyade method, which
feed. The videos that appear in the standard feed for two calculates the percentage of video pairs that have a reciprocal
consecutive days appear between 18 to 33 positions higher the relationship over the number of video pairs that are related
second day in other words these videos gradually attract more (with or without reciprocity).Are the highest-viewcount videos related? We conduct the and local clustering are identified. Our work differs itself
following measurements. We pick the top-N videos in terms of by focusing on a subgraph containing only popular nodes.
highest viewcount and checked their connectivity in our graph. We discover several properties that have never been reported
We compute the ratio of the existing edges among those videos before.
over the maximum possible number of edges N(N-1) (recall
VII. C ONCLUSION
that the edges are directed). The results for top-5, top-10 and
top-20 videos are 0.5, 0.36 and 0.195 respectively. For the This work is only the first step in understanding video
top-5, we find that 50% of these edges exist (10/20), which popularity in YouTube, which provides an initial foundation
we found to be surprisingly high. For top-10 and top-20, the for further exploring and understanding popularity. We study
percentage drops rapidly. fundamental properties of video popularity in YouTube using
roughly 37 million, accounting for 25% of all YouTube videos.
Viewcount and related-video in-degree are not strongly We analyze the relationships of key popularity metrics and we
correlated. One could expect that popular videos would ap- find that four of them are highly correlated (viewcount, #com-
pear in the related video list of more videos. Interestingly, there ments, #ratings, #favorites). We also find a “magic number”:
is only a moderate degree of correlation between viewcount for every 400 times a video is viewed, we have one of each:
and the in-degree of a video: the Pearson Correlation Coef- a comment, a rating of the video, and an addition to one’s
ficient of the two variables is 0.648. YouTube’s algorithm is favorite set.
known to take into consideration title, keyword and description Based on this work, we identify several directions to further
in order to identify related videos, and not just popularity examine: (a) the co-evolution of the popularity metrics in time,
metrics. meaning which metric increases first and which metrics follow,
The related-video graph exhibits Small World network (b) the behavior of users in terms of reacting to a video, e.g.
properties. As defined in the literature [13], a Small World whether it is the same user that leaves a comment and rates a
network is a graph with a large clustering coefficient and video, and (c) the effect of standard feeds on long term video
small characteristic path length. Our graph has 0.326 clustering popularity.
coefficient and 6.7 characteristic path length, which suggest
R EFERENCES
that the related video graph could be characterized as a Small
World network. [1] M. Cha et al., “I tube, you tube, everybody tubes: Analyzing the world’s
largest user generated content video system”, in IMC ’07: Proc. of the
7th ACM SIGCOMM conference on Internet measurement, 2007.
VI. R ELATED W ORK [2] X. Cheng, C. Dale, and J. Liu, “Statistics and social network of youtube
videos”, IWQoS ’08: Proc. of the 16th International Workshop on
Recent studies have been focused on understanding Quality of Service, June 2008.
YouTube video popularity from different angles. Cha et al. find [3] P. Gill et al., “Characterizing user sessions on YouTube”, MMCN 2008:
Proc. of the 15th SPIE/ACM Multimedia Computing and Networking,
that video popularity distribution exhibits a power-law pattern 2008.
with truncated tails, which fits a “fetch-at-most-once” model [4] M. Zink et al., “Watch global, cache local: YouTube network traffic at a
[1]. Cheng et al. present an “active life span” model to study campus network-measurements and implications”, MMCN 2008: Proc.
of the 15th SPIE/ACM Multimedia Computing and Networking, 2008.
popularity trends and predict its future growth [2]. [3], [4] [5] Phillipa Gill et al., “Youtube traffic characterization: a view from the
measure YouTube traffic from a campus network, and study edge”, in IMC ’07: Proc. of the 7th ACM SIGCOMM conference on
popularity from a local perspective. Gill et al. [5] identifie Internet measurement, 2007.
[6] F. Benevenuto et al., “Video interactions in online video social
and characterize user sessions on YouTube. Benevenuto et networks”, ACM Trans. Multimedia Comput. Commun. Appl., vol. 5,
al. study video popularity by characterizing video responses no. 4, 2009.
[6]–[8]. Most of the above studies consider viewcount as the [7] F. Benevenuto et al., “Identifying video spammers in online social
networks”, in AIRWeb ’08: Proc. of the 4th international workshop
only popularity metric. Our work, as a important complement, on Adversarial information retrieval on the web, 2008.
broadens the research scope by studying several other popu- [8] F. Benevenuto et al., “Detecting spammers and content promoters
larity metrics together with viewcount. in online video social networks”, in SIGIR ’09: Proc. of the 32nd
international conference on Research and development in information
The problem of spam detection and prevention has attracted retrieval, 2009.
research attention as well. Meeyoung Cha et al. [1] identify the [9] J. C. Paolillo, “Structure and network in the youtube core”, in HICSS
phenomenon of content alias, where multiple identical or very ’08: Proc. of the 41st Annual Hawaii International Conference on
System Sciences, 2008.
similar copies for a single popular event exist in the system. [10] A. Mislove et al., “Measurement and analysis of online social networks”,
Benevenuto et al. [7], [8] in particular deal with spams caused in IMC ’07: Proc. of the 7th ACM SIGCOMM conference on Internet
by video responses, and various approaches are provided to measurement, 2007.
[11] “YouTube API”, ”http://code.google.com/apis/youtube/developers
detect such spams. To extend these studies, we build a linear guide protocol.html”.
regression model that can potentially detect anomalies caused [12] Stanton Glantz and Bryan Slinker, Primer of Applied Regression &
by users who exploit the capabilities of the YouTube system. Analysis of Variance, McGraw-Hill Medical, 2 edition, Oct. 2000.
[13] D. J Watts and S. H Strogatz, “Collective dynamics of small-world
Researchers also study YouTube by modeling it as social networks”, Nature, vol. 393, no. 6684, June 1998.
network. [2], [6], [9], [10] study social networks representing
video responses, user friendships, related videos, etc. Interest-
ing observations such as small world, power-law distributionYou can also read