THE 2019 ELECTIONS: SOCIO-ECONOMIC PERFORMANCE AND VOTER PREFERENCES - RESEARCH BRIEF | 02 APRIL 2019
←
→
Page content transcription
If your browser does not render page correctly, please read the page content below
THE 2019 ELECTIONS:
SOCIO-ECONOMIC PERFORMANCE
   AND VOTER PREFERENCES

    Centre for Social Development in Africa
         University of Johannesburg
  Leila Patel, Yolanda Sadie and Megan Bryer

  RESEARCH BRIEF | 02 APRIL 2019
INTRODUCTION
The aim of the study is to monitor in what ways socio-economic rights are likely to shape voting behaviour in
a constitutional democracy and in an upper middle-income country that has a fairly well-developed welfare
system. We pose the following question: to what extent are government performance in the delivery of socio-
economic rights, perceptions of corruption and issues of governance likely to influence voter preferences in
the run-up to the 2019 national general elections? Although these determinants of voting behaviour have been
highlighted by scholars over the past decade, this has not been empirically tested in national surveys (Patel et
al. 2014; Sadie, Patel & Baldry 2016; Sadie, Graham & Patel 2016). Other factors that might be associated with
voter preferences, such as socio-demographic factors, party loyalty and land restitution, are also assessed.
Since significant leadership changes have occurred in the governing party and in the government since
our previous survey in 2017, we assess what the likely impact (if any) of trust in the presidency under Cyril
Ramaphosa might be on voter preferences in the 2019 elections.

This report presents the findings from the second wave of data collected on voter preferences at the end of
2018 in a cross-sectional, nationally representative study. This study is part of a three-year study to monitor
the influence of socio-economic rights implementation on voting behaviour. The results from the first two
waves are compared and are a good indication of influences of voter preferences prior to the 2019 national
general elections. The study is not an opinion poll, but rather attempts to understand why potential voters
would support their party of choice. The term ‘voters’ is used in the study to refer to 91% of the respondents
who answer the question: which party will you vote for in the next election? This should not be interpreted as a
prediction of whether they will in fact vote and how they will vote. The research could contribute to ongoing
dialogue and public engagement about the links between electoral politics, the achievement of socio-
economic rights and issues of governance.

RESEARCH PLANS 2017–2019
Three national cross-sectional surveys were planned for the period October 2017 to October 2019. The first
wave of data was collected in October 2017 (Wave 1). The second wave of data, discussed in this brief (referred
to as Wave 2) was collected between 25 October and 24 December 2018. The findings emerge from a random
and nationally representative sample of 3580 potential voters. Ipsos Public Affairs, a marketing research
company, collected the data on behalf of the CSDA. The sample consisted of metropolitan and rural areas
stratified in terms of age, gender and ethnicity. Five survey questions supplied by the CSDA were included
in Ipsos’s Khayabus survey, which is conducted between October and November each year. The data was
analysed by the research team, with statistical support provided by Jaclyn de Klerk from STATCON at the
University of the Johannesburg.

The third study will be conducted in October 2019 after the national general elections and should yield
valuable results on the trends and factors influencing voter choices over a three-year period.

Results: Wave 2, 2018
PROFILE OF PARTICIPANTS
Our sample included 3431 respondents. This sample is representative of 38 034822 potential voters. Of the
total, 70% reside in urban areas and 30% in rural areas. This corresponds with the national urban–rural split.1
Gender representation was split almost equally, with 52% female and 49% male. Most respondents were aged
between 18 and 34 years (49%), with 41% aged between 35 and 59 years, while 10% were older than 60 years.
Of the total, 77% of respondents were black, 10% coloured, 11% white and 3% Indian/Asian. Most respondents
were working (46%) as opposed to not working (22%) or unemployed2 (33%).

Respondents in the sample were largely poor and fell into the lower middle-income bands. Of all the
respondents, 58% earned less than R8 000 as their total monthly income.3 21% of the respondents refused to

1
 StatsSA, 2015. Findings of the Living Conditions Survey 2014/15. [Online] Available at http://www.statssa.gov.za/publications/Re-
port-03-10-02%20/Report-03-10-02%202015.pdf
2
    Includes unemployed looking for work and unemployed not looking for work.
3
    Total personal monthly income before tax and deductions, including salaries, pensions, income from investments, grants etc.

                                                                      2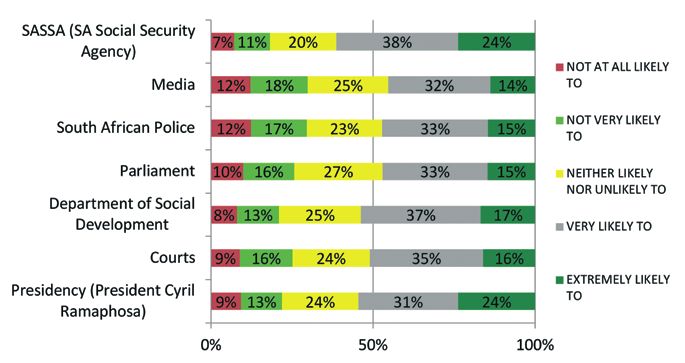
answer the question about their income, which is not unusual in household surveys as these are considered to
be sensitive questions. About 16% of respondents earned more than R10 000 per month.

Regarding education, 46% of respondents have Grade 12 as the highest level of education; 29% have
secondary school as the highest level; 4% have primary school. 5% of respondents have an artisan’s
certificate; 7% have a technikon diploma and only 5% have a university degree.
Table 1: Highest level of education received

                                                                                               Percent
1 - No schooling                                                                                    0,9
2 - Some primary school                                                                              2,8
3 - Primary school completed                                                                         3,7
4 - Some high school                                                                             29,0
5 - Matric / Grade 12                                                                            45,6
6 - Artisan’s certificate obtained                                                                  4,8
7 - Technikon diploma/degree completed                                                              6,6
8 - University degree completed                                                                     4,6
9 - Professional                                                                                    0,9
10 - Technical                                                                                      0,6
11 - Secretarial                                                                                    0,2
Total                                                                                               0,4

The profile of the respondents in Wave 2 was similar to Wave 1, although with slight decreases in the number
of people employed (3%) and a 10% increase in the proportion of people earning above R10 000 per month. A
small decrease in the urban-rural distribution of respondents was also observed.

REASONS FOR VOTER PREFERENCES
When asked which party they would vote for in the next election, most respondents said the African National
Congress (ANC) (56% up from 53% previously), followed by the Democratic Alliance (DA) (13% down from 22%
previously) and the Economic Freedom Fighters (EFF) (9% up from 6% previously). Only 4% of respondents said
that they would not vote (compared to 5% previously) and 5% refused to answer (down from 6% previously).

The table below shows the party choice of respondents disaggregated into provinces.

Table 2: Party choice per province (%)
                                                                    Free State

                                                                                 Kwa Zulu-
                                                       Northern

                                                                                                                                Limpopo
                                                                                                            Gauteng

                                                                                                                      Mpuma-
                                            East-ern
                                 Western

                                                                                             North

                                                                                                                       langa
                                                                                   Natal
                                  Cape

                                             Cape

                                                        Cape

                                                                                             West

African National Congress        31,64      52,13      65,92       75,34         51,92       65,17         58,06      64,28    68,53
Democratic Alliance              31,41      12,91      21,65       8,34           5,14       7,80          15,11      13,04    3,75
Economic Freedom Fighters            3,21   10,05      11,42       6,90           3,26       15,19         10,66      8,45     18,74
Will not vote                    4,80       4,99        0,51       3,78           5,41       7,21          5,88       7,35     2,66
Refuse to answer                 13,84       6,17                  1,63           11,11                    2,07       0,72     1,05
Do not know                          7,51    7,02                  0,61           7,11       0,53          3,30        1,31    2,22

Table 2 shows that a third of the respondents in the Western Cape expressed a preference for the ANC, while
support was strongest in the Free State (75%), followed by Limpopo (69%), and 65% in the North West and
the Northern Cape respectively. Two thirds of respondents in Mpumalanga selected the ANC as their preferred

                                                               3
political party. Thirty one percent also expressed a preference for the DA in the Western Cape, followed by
the Northern Cape (22%) and Gauteng (15%). The EFF had the strongest showing in Limpopo (19%), North
West (15%), and the Northern Cape (11%), and around 10% respectively in Gauteng and the Eastern Cape.
This study is not an opinion poll, since different estimations are used to determine opinion polls. Instead, it
attempts to understand why respondents selected a particular political party.

Respondents were asked the reason for their party choice, with the option to select up to five reasons. The
most common reason that respondents in the full sample gave for supporting a party was that they believed
the party would bring a better life (65%) (previously 32%), followed by the party brought freedom and democracy to
South Africa (62%) (previously 35%) and they trust the party (62%) (previously 37%).

Asked whether they receive any social grant from the government, 30% of respondents answered “Yes” (up
from 23,9% previously). Interestingly, 48% of all respondents said that one of the reasons they voted for a
particular party was “because it pays social grants and I am afraid that another party will stop social grants”.
This increased steeply from 14,6% previously. Of the respondents who receive a grant from government, 59,8%
gave this as their reason for their party choice (compared to 25%)4.

SOCIO-ECONOMIC WELL-BEING VERSUS DEMOCRACY AS A FACTOR DRIVING
VOTER PREFERENCES
When asked which they consider to be more important, democratic rights or socio-economic well-being,
58,5% said socio-economic well-being (up from 44,6% previously), while 26,7% considered democratic rights
to be more important (down from 42,9% previously). This suggests that future voters value socio-economic
well-being more than democratic rights.

            Figure 1: What is more important to you, democratic rights vs. socio-economic well-being?

DOES TRUST IN INSTITUTIONS INFLUENCE VOTER PREFERENCES?
Trust in all institutions is mostly favourable; we combine the two categories very likely or extremely likely.
Where previously, trust in the presidency under former president Jacob Zuma had been relatively low (56%
were not at all likely or not very likely to trust the former president), trust in the presidency has improved,
with 55% saying they trust the presidency under President Cyril Ramaphosa compared to 26% under former
president Zuma.

4
  Note that the format of this question changed as respondents were asked to provide their top 5 reasons for party choice in a multiple
select manner, whereas previously respondents were asked to simply provide their reasons for party choice, with interviewees coding
responses.

                                                                    4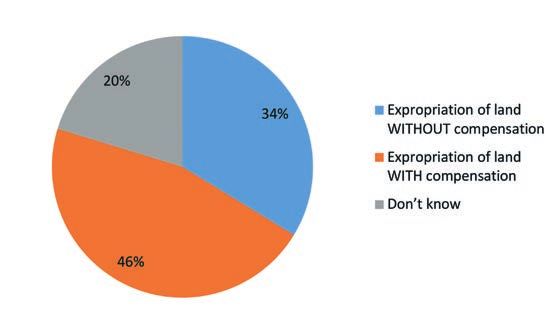
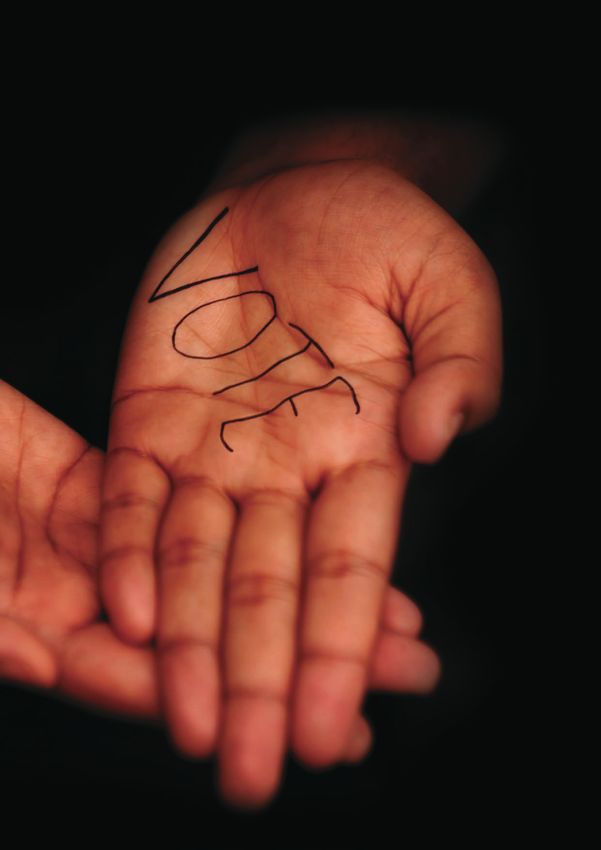
Figure 2: How likely are you to trust in the following institutions?

Comparing these findings to the previous report, trust in SASSA has increased, with 62% of respondents
(up from 52%) saying they are very likely or extremely likely to trust in the institution. Trust in the media has
declined from 53% to 46%, with respondents expressing lower levels of trust in the institution. Trust in the
South African Police service has increased from 45% to 48%, while trust in parliament has increased from
45% to 48%. Trust in the Department of Social Development increased from 52% to 54%, while trust in the
Courts has declined by 2% to 51%. The most significant change is in the trust in the presidency. Trust in
political institutions is important, as it is linked to perceptions of political performance and the delivery of
public services, which is referred to as governance in our analysis model below.

THE INFLUENCE OF PERCEPTION OF CORRUPTION ON VOTER PREFERENCES
The vast majority of respondents (72%) held the view that corruption had increased in the previous year,
though this was down from 76% in the previous report, where this percentage of respondents believed that
corruption had increased between 2014 and 2017.

             Figure 3: Do you think that corruption has increased in South Africa in the last year?

PERCEPTIONS TOWARDS LAND EXPROPRIATION
In Wave 2 an additional question was asked regarding land expropriation. In this regard, 34% of respondents
said they support land expropriation without compensation and 46% support land expropriation with
compensation, while 20% said they did not know.

                                                         5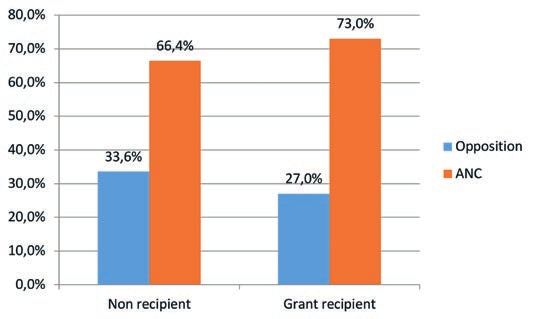
Figure 4: What is more important to you, expropriation of land WITHOUT compensation or
                                     expropriation of land WITH compensation?

1.1 WHICH FACTORS ARE LIKELY TO MATTER IN VOTER PREFERENCES?
Exploratory factor analysis is a statistical procedure used to determine which variables cohere into factors
that are likely to influence voter choices. The procedure followed is described briefly, and the results are then
presented.

Exploratory factor analysis procedure
To measure perception of governance (trust in institutions) among the respondents, we constructed an index
by calculating the average score across all seven questions that measure a respondent’s trust in institutions.
We conducted a factor analysis to test whether the set of questions about trust in institutions can be used to
provide a composite indication of trust levels.

The question asks respondents “… how much [do] you trust each institution, would you say that you are 1 – Not at all
likely to, 2 – Not very likely to, 3 – Neither likely nor unlikely to, 4 – Very likely to, or 5 – Extremely likely to …

•     Trust the Presidency (President Cyril Ramaphosa)
•     Trust the Courts
•     Trust the Department of Social Development
•     Trust Parliament
•     Trust the South African Police
•     Trust the Media
•     Trust SASSA (SA Social Security Agency)?”

No reverse scoring was necessary, since all questions measure trust on a spectrum from Not at All Likely to
trust in the institution through to Extremely Likely to trust in the institution.

We then used the Kaiser-Meyer-Olkin Measure of Sampling Adequacy to check whether the items were
suitable for factor analysis. The Kaiser-Meyer-Olkin value measured 0,9, exceeding the recommended
value of 0,6 (Kaiser 1974) and Bartlett’s Test of Sphericity (Bartlett 1954) reached statistical significance. The
result supported the factorability of the correlation matrix. Inspection of the correlation matrix revealed the
presence of coefficients of 0,3 and above.

We checked for weak items using the anti-image correlations. All items had MSA5 values above 0,6,
and therefore it was not necessary to remove any item from the factors constructed. We inspected the
communalities at extraction test. Low values (less than 0,3) could indicate that the item does not fit well with
the other items in its component. All values exceeded 0,3.

We found that of the total variance in the model, 53% is explained by the constructed factor for Governance.

We tested the reliability of the items in measuring trust in institutions using Cronbach’s Alpha, which measured
0,85. According to Pavot, Diener, Colvin & Sandvik (1991) there is good internal consistency when a Cronbach

5
    Measures of Sampling Adequacy.

                                                           6
alpha coefficient of at least 0,85 is reported. Values above 0.7 are considered to be acceptable. This factor is
therefore a reliable measure of trust in institutions (which we term “Governance” here).

When the Governance index is amended to exclude Trust in the Presidency under President Ramaphosa the
measure for Cronbach’s Alpha is 0,837. This suggests that there is still good internal consistency reliability for
the index.

1.2 DOES SOCIAL GRANT RECEIPT MATTER IN VOTER PREFERENCES?
We compared respondents who received a grant from the government to those who did not. We tested
whether the receipt of a grant impacted the respondents’ choice of party – voting for the ANC or an
opposition party. Of the respondents who received a grant from the government, 73% said that they would
vote ANC (same as previously), while 27% said that they would vote for an opposition party (same as before).
Of the respondents who did not receive any government grant, 66% said they would vote ANC (up from 61%),
while 34% said that they would vote for an opposition party (down from 39%).

                  Figure 5: Comparison of grant recipients vs. non-recipients in voting choice

Using Fisher’s Exact Test, we show that there is a statistically significant difference between grant recipients
and non-recipients in terms of voter choice. The Fisher’s Exact Test p-value is 0,001. Those who received a
grant were more likely to vote for the ANC than those who did not. The magnitude of the effect, however, is
small. The phi coefficient value is 0,064. This is considered small using Cohen’s (1988) criteria of 0,10 for small
effect; 0,30 for medium effect; and 0,50 for large effect. Both recipients and non-recipients were more likely to
prefer the ANC to an opposition party.

We did the same test to compare male and female respondents, disaggregated into grant recipients and non-
recipients, in terms of voter choice. In our sample 205 males receive a grant (compared to 1192 non-recipients)
and 592 females receive a grant (compared to 802 non-recipients). For males, 66% of non-recipients vote ANC
(up from 64%), whereas 71% of grant recipients vote ANC (down 1%). For females, 67% of non-recipients vote
ANC (up from 56%) compared to 74% of grant recipients (up 1%).

    Figure 6: Comparison of male vs. female grant recipients and non-recipients, in terms of voter choice

                                                         7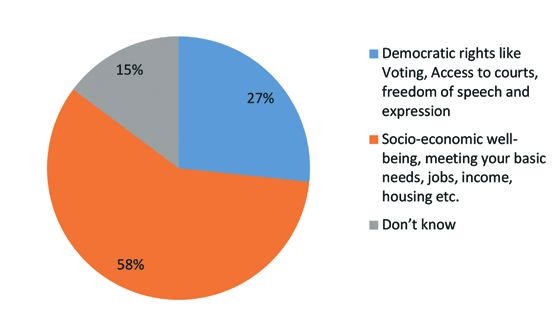
We found no statistically significant difference between male grant recipients and non-recipients in voter
choice: Fisher’s Exact Test p-value measured 0,198. But for females, there was a statistically significant
difference between grant recipients and non-recipients in terms of voter choice: Fisher’s Exact Test p-value
measured 0,004 for female recipients and non-recipients. Again, the magnitude of the effect is small, with the
phi coefficient value measuring 0,077.

Does age matter in voter preferences?
We then compared whether there was a statistically significant difference in how the respondents of different
age groups voted. We compared three age groups: 18-34 years, 35-60 years and older than 60 years. In the
youngest group, 67% vote ANC (up from 65%). In the middle-aged group, 70% vote ANC (up from 62%). In
the oldest group, 73% vote ANC (up from 64%). As previously seen within Wave 1, we found no statistically
significant difference in terms of voting choice of ANC or opposition party across the three age groups.

                Figure 7: Comparison of young, middle-aged and old respondents in voter choice

1.3 THE PREDICTIVE VALUE OF OUR MODEL
We used a logistic regression as a predictive analysis to test the impact of three constructed independent
variables – perception of the importance of socio-economic rights protection, perception of governance, and
perception of corruption – on the likelihood that a respondent would vote for the ANC or an opposition party.

We constructed the independent variables as follows:

Perception of governance: We assigned an average score to each respondent such that scores range from 1
to 5 (Not at all likely to Extremely likely to trust in institutions), for the question “… how much [do] you trust each
institution, would you say that you are 1 – Not at all likely to, 2 – Not very likely to, 3 – Neither likely nor unlikely to, 4 –
Very likely to, or 5 – Extremely likely to …

•    Trust the Presidency (President Cyril Ramaphosa)
•    Trust the Courts
•    Trust the Department of Social Development
•    Trust Parliament
•    Trust the South African Police
•    Trust the Media
•    Trust SASSA (SA Social Security Agency)?”

Perception of the importance of socio-economic rights protection: Using the question “Please let me know
which ONE is more important to you: (i) Democratic rights like voting, access to courts, freedom of speech and
expression or (ii) Socio-economic well-being, meeting your basic needs, jobs, income, housing etc.”, we assigned 1 if
socio-economic well-being (statement ii) was more important.

Perception of corruption: Using the question “There is a lot of talk about corruption in our country. Do you
think that corruption has increased in South Africa in the last year?” we assigned a value of 1 if the respondent
answered Yes, and 0 if the respondent answered No.

                                                                8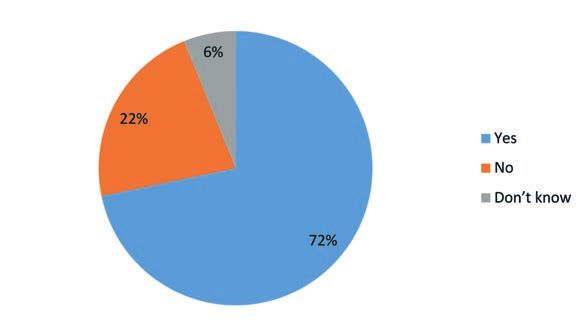
Our dependent variable we set as 1 if respondents said that they would vote for the ANC in the next election,
and 0 if they said that they would vote for an opposition party. We excluded those who refused to answer or
indicated that they would not vote.

We included variables to control for: age, race, income level, urban versus rural, gender, work status, education
level, grant recipient versus non-recipient and whether recipients agreed with the statement “I am afraid that if
another party comes to power social grants will stop”.

We tested for multicollinearity to confirm that the correlation between independent variables in the model
was not too high. We measured VIF (variance inflation factor) and tolerance. Tolerance measures how much
variability of the specified independent variable is not explained by the other independent variables in the
model. Tolerance is measured between 0 and 1, with values closer to 1 showing the absence of collinearity
concerns. VIF is the inverse of the tolerance value. The VIF values examined were close to 1, which is
acceptable. We were satisfied that there were no concerns of collinearity in our model and that the regression
coefficients rendered below were indeed the factors that were the likely predictors of voter preferences.

Table 3: Coefficientsa

                                                    Coefficientsa
                                                                                Collinearity Statistics
    Model                                                                Tolerance                        VIF
    1       Governance                                                     0,975                        1,025
            SocEcRights                                                    0,976                        1,025
            Corruption                                                     0,981                        1,019
            Age                                                            0,850                        1,177
            White                                                          0,867                        1,153
            IndAsian                                                       0,967                        1,034
            Coloured                                                       0,953                        1,049
            Income                                                         0,605                        1,652
            Area                                                           0,922                        1,085
            NotWorking                                                     0,764                        1,308
            Unemployed                                                     0,596                        1,678
            Education                                                      0,754                        1,326
            Gender                                                         0,910                        1,098
            Grant                                                           0,781                       1,280
            Fear of Loss of Grant                                          0,970                        1,031
a. Dependent Variable: Vote

Table 4: Model summary shows the results for the R-square test to test the usefulness of the model. We used
Cox & Snell R Square and Nagelkerke R Square values to assess the amount of variation in the dependent
variable that is explained by the model. The R-square value measured 0,229 using the Cox & Snell test and
0,324 using the Nagelkerke test.

Table 4: Model summary

Step                   -2 Log likelihood               Cox & Snell R Square               Nagelkerke R Square
1                         1771.188a                            0,229                               0,324
a. Estimation terminated at iteration number 5 because parameter estimates changed by less than .001.

The Hosmer and Lemeshow test is used to test the goodness of fit of the model, as the most reliable test
of model fit said to be available in SPSS, the software package used for analysis. Poor fit is indicated by a
significance value of less than 0,05. The significance value below measures 0,240. We are therefore satisfied
that the model is a good fit.

                                                           9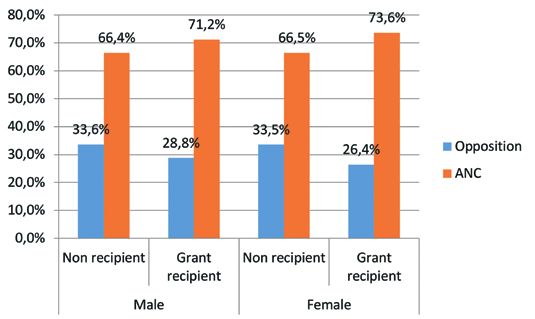
Table 5: Hosmer and Lemeshow Test

    Step                        Chi-square                                Df                                      Sig.
    1                             10,368                                   8                                     0,240

Findings of regression model
Table 6: Variables in the equation below show the results from the logistic regression, which tells us about
the contribution or importance of each of the predictor variables. 1610 cases were excluded from our
analysis due to missing data.6 The analysis was therefore conducted on 1821 cases. There were no significant
differences that would materially affect the results of the regression analysis between the sub-sample and
the excluded cases.

Perception of governance and perception of corruption are shown to be significant in determining whether
a respondent votes for the ANC or an opposition party, but perception of socio-economic rights delivery as
important is not significant. Age, race, income and whether respondents said they agreed that they are “afraid
that if another party comes to power social grants will stop” were all shown to be statistically significant. Grant
receipt is not significant.

Table 6: Variables in the equation

                                                                                                                95% C.I.for EXP(B)
                                      B           S.E.        Wald         df         Sig.         Exp(B)        Lower        Upper
    Step 1   a
                 Governance         0,610        0,072        71,518        1        0,000          1,840         1,597        2,119
                 SocEcRights        0,027        0,128        0,044         1        0,833          1,027        0,799         1,321
                 Corruption         -0,519       0,150        11,941        1        0,001          0,595        0,443        0,799
                 Age                0,019       0,005         13,770        1        0,000          1,019        1,009         1,029
                 White              -2,847       0,223       162,528        1        0,000          0,058        0,037        0,090
                 IndAsian           -1,785       0,431        17,191        1        0,000          0,168        0,072        0,390
                 Coloured           -2,023       0,191        111,721       1        0,000          0,132        0,091         0,192
                 Income            -0,020       0,008         6,640         1        0,010         0,980         0,965        0,995
                 Area               -0,081       0,144        0,318         1        0,573          0,922        0,695         1,223
                 NotWorking         0,022        0,178        0,015         1        0,902          1,022         0,722        1,448
                 Unemployed         -0,131       0,160        0,667         1        0,414          0,877         0,641        1,201
                 Education          0,073       0,055          1,761        1        0,185          1,075        0,966         1,197
                 Gender             0,150        0,124         1,457        1        0,227          1,162         0,911        1,483
                 Grant              -0,150       0,147        1,044         1        0,307          0,861        0,646         1,147
                 Fear of Loss
                                    0,750        0,123        37,520        1        0,000          2,118         1,666       2,693
                 of Grant
                 Constant           -1,418       0,542        6,845         1        0,009          0,242
a. Variable(s) entered on step 1: Governance, SocEcRights, Corruption, Age, White, IndAsian, Coloured, Income, Area,
NotWorking, Unemployed, Education, Gender, Grant, Fear of Loss of Grant.

In the previous wave, variables found to be significant were: Governance, SocEcRights, Corruption, Age, Race,
Education, Gender and Fear of Loss of Grant.

The higher the perception of governance (i.e. the higher the trust in institutions a respondent held) the more
likely the respondent would be to vote for the ANC. The odds of a respondent voting for the ANC increased
by a factor of 1,840 (or 84%) for each additional unit of trust in institutions the respondent held, all other
factors being equal. Previously, the odds of voting ANC increased by 1,398 (2%) for each additional unit of

6
 The analysis excludes respondents who refused to answer or said they did not know in response to any of the variables/questions includ-
ed in the model. For instance, we excluded all respondents who did not provide their income.

                                                                   10
Governance/Trust in institutions. The difference between Wave 1 and 2 is significant even allowing for sample
error. We take it up in Model 2 below, where we further unpack trust in institutions.
Previously we found that people prioritising democratic over socio-economic rights were 1,64 times or 64%
likelier to support the ANC than an opposition party.. Here we find that the perception of socio-economic
well-being as more important than democratic rights is not significant in determining voter party choice when
other variables were at play in the regression.
Respondents who believed that corruption had increased in the last year were less likely to vote for the
ANC than those who did not believe corruption had increased. If respondents believed that corruption had
increased in the last year, they are 0.595 or 40.5% less likely to vote ANC than those who did not believe
corruption had increased in the past year (all else being equal). Similarly, the previous report found those
who believed that corruption is a problem were approximately half as likely to vote ANC as those who didn’t,
ceteris paribus.
Older respondents are more likely to vote for the ANC than younger respondents. For each additional year
in age, the odds of a respondent voting for the ANC increased by a factor of 1,019, all other factors being
equal. In other words, over a ten-year difference in age, the likelihood of choosing the ANC increases by 20%.
Previously we found that a respondent was 1,015 times likelier to choose the ANC than someone who was a
year younger.
Compared to black respondents, the odds of a white respondent voting for the ANC decreased by a factor of
0,058. White respondents are roughly 94% less likely to vote ANC than black respondents. Compared to black
respondents, the odds of an Indian/Asian respondent voting for the ANC decreased by a factor of 0,168, and
the odds of a coloured respondent voting for the ANC decreased by a factor of 0,132, all other factors being
equal. This means that black respondents were almost 17 times likelier to support the ANC than whites; about
6 times likelier to support the ANC than Indians/Asian respondents; and almost 8 times likelier to support the
ANC than coloured respondents. Between Waves 1 and 2, the differences for whites and coloureds however fall
within sampling error, which means the significance of the changes from Wave 1 to Wave 2 is limited. But for
Indians, the change is significant. In the previous report, we found that black respondents were 16 times likelier
to support the ANC than Indians. We can say here too that Indians are now only 6 times more likely than
blacks to vote for an opposition party, where previously they were 16 times more likely to do so.
Richer respondents are less likely to vote for the ANC than poorer respondents. For each additional escalation
in income bracket, the odds of a respondent voting for the ANC decreased by a factor of 0,980, all other
factors being equal. This means that respondents in the lowest income band are almost twice as likely (1,95) to
choose the ANC over an opposition party than those in the highest income band in the sample. Income was
not significant in the previous report.
Previously we found that an additional level of education meant a respondent was less likely to vote for the
ANC by a factor of 0,832 compared to a respondent with one level less in education, all other factors being
equal. Education is not significant in this report.
Similarly, gender is not found to be significant in this wave, whereas in the previous wave we found that
women were 0.752 times as likely as men to prefer the ANC over opposition parties, which means that men
were 33% times likelier to vote for the ANC than women.
In both studies (Waves 1 and 2) whether respondents actually received a grant or not is not significant.
In contrast, the fear of losing grants matters in voter preferences. For respondents who agreed with the
statement they are “afraid that if another party comes to power social grants will stop”, the odds of voting for the
ANC increased by a factor of 2,118 (or 118%) compared to those who disagreed with this statement. This means
that respondents who agreed with this statement were more than twice as likely to be ANC supporters as
those who disagreed, with all other things being equal. This was found to be the case in the previous report
too, where the odds of voting for the ANC increased by a factor of 2,684 for respondents who agreed that they
are “afraid that if another party comes to power social grants will stop”.
11ALTERNATIVE SCENARIO
In addition to the basic model reported on above, we ran a second model, which included additional
variables. Here we included an additional variable, where the respondent indicated that their reason for party
choice was that they believed the party “brought freedom and democracy” as well as another variable for
whether respondents supported land expropriation with or without compensation. Furthermore, trust in Cyril
Ramaphosa is added to the model as a separate variable and the governance index is amended to exclude
this variable.
As before, the two additional models were satisfactory for collinearity and good fit.
Table 7: Variables in the equation, Model 2 Trust in Ramaphosa as separate variable, party loyalty and
land reform
95% C.I.for EXP(B)
B S.E. Wald df Sig. Exp(B) Lower Upper
Step 1 a
Governance
(excl. Trust in 0,133 0,091 2,128 1 0,145 1,142 0,955 1,366
Presidency)
SocEcRights 0,015 0,138 0,011 1 0,916 1,015 0,775 1,329
Corruption -0,524 0,163 10,361 1 0,001 0,592 0,431 0,815
Age 0,019 0,006 11,483 1 0,001 1,019 1,008 1,030
White -2,830 0,238 141,622 1 0,000 0,059 0,037 0,094
IndAsian -1,686 0,459 13,484 1 0,000 0,185 0,075 0,456
Coloured -1,969 0,208 89,787 1 0,000 0,140 0,093 0,210
Income -0,026 0,008 9,552 1 0,002 0,974 0,959 0,991
Area -0,048 0,156 0,095 1 0,757 0,953 0,702 1,294
NotWorking -0,107 0,190 0,319 1 0,572 0,898 0,619 1,304
Unemployed -0,198 0,174 1,293 1 0,256 0,820 0,583 1,154
Education 0,061 0,059 1,058 1 0,304 1,063 0,946 1,193
Gender 0,111 0,135 0,681 1 0,409 1,118 0,858 1,456
Grant -0,147 0,160 0,837 1 0,360 0,863 0,631 1,182
Fear of Loss of
0,792 0,132 35,805 1 0,000 2,208 1,703 2,862
Grant
QUJ102
(Because this
party brought
0,598 0,137 19,212 1 0,000 1,819 1,392 2,377
freedom and
democracy to
South Africa)
rQUJ2_4
(Expropriation -0,144 0,129 1,248 1 0,264 0,865 0,672 1,115
of land)
QUJ3_r1_answ
(Trust in 0,463 0,064 52,800 1 0,000 1,589 1,402 1,800
Presidency)
Constant -1,564 0,594 6,946 1 0,008 0,209
a. Variable(s) entered on step 1: Governance excl. Trust in Presidency, SocEcRights, Corruption, Age, White, IndAsian,
Coloured, Income, Area, NotWorking, Unemployed, Education, Gender, Grant, Fear of Loss of Grant, QUJ102, rQUJ2_4,
QUJ3_r1_answ.
12In this model, governance, amended to exclude trust in the presidency, is not significant; nor is the relative
perception of socio-economic rights delivery considered as important. Respondents’ perceptions as to whether
they thought that corruption had increased or decreased over the past year were found to be significant in
voter preference However, trust in the presidency specifically increased. For each unit of trust in the presidency
(on a five-point scale), the chances of preferring the ANC over an opposition party increased by 58.9%.
This means that between those who strongly distrust in the presidency and those who strongly trust in the
presidency under Cyril Ramaphosa, there is a tenfold increase in the likelihood of choosing the ANC in the
2019 national election. Note that 9% of respondents said they are extremely distrustful of the presidency
under Ramaphosa and 24% are extremely trustful. In comparison, 39% were extremely distrustful and 9%
extremely trustful of the Zuma presidency.
The magnitudes of effect of perception of corruption, age, race, income and fear of loss of grant are all
significant in determining the likelihood of choosing the ANC or an opposition party. The results for Model 2
are similar to the results in Model 1, where Cyril Ramaphosa is subsumed in the governance index, as explained
above.
Other significant variables include age, race, income, fear of loss of grant, and whether a respondent answered
that their reason for party choice was that they believed the party “brought freedom and democracy”.
We look now at the additional variables included in Model 2. In the previous report, we found that whether
respondents answered that their reason for party choice was that they believed the party “brought freedom
and democracy” was not significant in the logistic regression. In this study, the variable is found to be
significant, with those providing this reason for their choice of political party to be 81,0% likelier to choose the
ANC over an opposition party, compared to those who do not offer this as a reason for party choice, all other
factors being equal. In contrast, where the importance of socio-economic well-being over democratic rights
was previously found to be significant, it is not significant in Wave 2.
Whether respondents agreed that they support land expropriation with or without compensation was not
found to be significant in voter preferences in the forthcoming elections.
CONCLUSIONS
From our comparative analysis of the 2017 and 2018 surveys we draw the following inferences. Firstly, the
political changes that have occurred since 2017 are likely to influence voter preferences in the run-up to the
2019 national general elections. The leadership changes in the governing party and in the government appear
to have bolstered trust in the president and are a significant predictor of voting behaviour. For each unit of
trust in the presidency (on a five-point scale), the chances of preferring the ANC over an opposition party
increased by 58.9%. When Cyril Ramaphosa is removed from the comparison in Model 1, governance is no
longer a predictor of voter preference. However, when inserted as a factor on its own and independent of trust
in institutions, trust in the presidency emerges as the single most important predictor of voter preference for
the governing party.
Secondly, unlike the previous study, where party loyalty was not a predictor of voting behaviour, a significant
shift has occurred since then. In 2018, party loyalty emerged as a predictor of voter choice. It appears that
trust in President Ramaphosa may have rekindled loyalty to the party that brought freedom and democracy
to South Africa.
Thirdly, concerns about corruption remain uppermost in the minds of voters. Seven out of ten potential voters
believe that corruption increased in the past year and this remains a significant predictor of voter preference,
as was the case previously. Those who believe that corruption increased over the past year are more likely to
vote for the opposition. The odds of a person not voting for the ANC if they believed that corruption increased
was 59.5%.
Fourthly, voter preferences are also influenced by the desire for socio-economic well-being and the hope of
a better life. Socio-economic well-being was selected by 65% of respondents as one of the main reasons
for their party choice, and this doubled between Waves 1 and 2. Furthermore, socio-economic well-being is
highly valued as a reason for selecting a political party. However, unlike in 2017, when socio-economic rights
implementation was a significant predictor of voter choice, this was no longer the case as the election draws
closer. Other factors associated with socio-economic well-being such as land reform are also not predictors
13of voting behaviour. This was also the case for social grant recipients. However, fear of loss of a social grant if
one votes for another party was a significant predictor of voter preference in both surveys in 2017 and 2018.
Fifthly, some socio-demographic factors emerged as predictors of voter choices. Older persons and those with
lower income are more likely to prefer the ANC than opposition parties. Conversely, richer respondents are
more likely to prefer the opposition. Race was a predictor in 2017 and continues to be the case in 2018, with
black African voters being more likely to select the ANC than an opposition party. Although some changes
were observed between the two waves between white and coloured persons who indicated supporting the
ANC, these were not statistically significant over the two waves. However, significant changes appear to have
occurred among Asian/Indian voters in that the latter are now six times likelier to prefer the ANC over an
opposition party. This is down from being 16 times likelier in 2017.
Predictors that were not significant in the 2018 survey were education and gender. This is an interesting shift
among women and persons with higher levels of education who were more likely to support an opposition
party in 2017. Also, whether a respondent lived in an urban or a rural area and was unemployed were not
predictors of voter choice in both waves.
We conclude that the predictors of voting behaviour in this election have changed rather significantly over
the past year. Trust in President Cyril Ramaphosa, coupled with a renewed support for the party of liberation,
appears to be a significant driver of voter choice for the ANC versus the opposition as the election draws
closer. Furthermore, those who believe that corruption has increased, those who are wealthier and those who
have higher levels of education are more likely to prefer an opposition party
SOURCES
Bartlett, M.S. (1954). A note on the multiplying factors for various chi-square approximations. Journal of the
Royal Statistical Society.16:296–298.
Cohen, J. 2nd ed. (1988). Statistical Power Analysis for the Behavioral Sciences, (Hillsdale NJ: L. Erlbaum
Associates.
Ismail, Z. & Ulriksen, M. (2017). Social Assistance and electoral choice: A citizen’s perspective In Patel, L. and
Ulriksen (Ed), (2017). Development, Social Policy and Community Action. Cape Town: HSRC Press
Kaiser, H. (1974) An index of factorial simplicity. Psychometrika. 39:31–36.
Pallant, J. F. (2007). SPSS survival manual: A step-by-step guide to data analysis with SPSS. New York, NY:
McGrath Hill.
Patel, L., Sadie, Y. Graham, V., Delany, A. & Baldry, K. (2014). Voting Behaviour and the Influence of Social
Protection. Johannesburg: CSDA, University of Johannesburg. www.uj.ac.za/csda
Pavot, W., Diener, E. D., Colvin, C. R., & Sandvik, E. (1991). Further validation of the Satisfaction with Life Scale:
Evidence for the cross-method convergence of well-being measures. Journal of personality assessment, 57(1), 149-
161.
Sadie, Y., Patel, L. & Baldry, K. (2016). ‘A Comparative Case Study of the Voting Behaviour of Poor People in
Three Selected South African Communities’. Journal of African Elections, 15(1): 113-138.
Sadie, Y., Graham, V. & Patel, L. (2016). ‘Social grants, food parcels and voting behaviour: a case study of three
South African communities’. Journal Transformation Critical Perspectives on Southern Africa, 91, 106-136.
1415
AUTHORS
Leila Patel: Professor and DST/NRF Research
Chair in Welfare and Social Development
Yolanda Sadie: Professor of Politics, University of
Johannesburg
Megan Bryer: Researcher, Centre for Social
Development in Africa, University of Johannesburg

ACKNOWLEDGEMENTS
Leila Patel received funding for the SA Research
Chair in Welfare and Social Development from the
Department of Science and Technology and the
National Research Foundation. Yolanda Sadie and
Leila Patel also received funding from the Faculty
of Humanities Research Committee (UJ) and the
University of Johannesburg’s Research Committee.
Opinions expressed and conclusions arrived at are
those of the authors and do not necessarily reflect
the views of the funders.

Copyright © 2019: The authors,
the Centre for Social Development in Africa,
University of Johannesburg.

Short extracts from this publication may be
produced unaltered without authorisation on
condition that the source is indicated. For rights
of reproduction or translation, application should
be made to the Centre for Social Development in
Africa, University of Johannesburg.

CONTACT DETAILS
Phone: +27 (0) 11 559 1904 | Fax: +27 (0) 11 559 1575
Email: csdainfo@uj.ac.za | Website: www.uj.ac.za/csda
You can also read