Bayesian Survival Analysis Model for Girth Weld Failure Prediction - MDPI
←
→
Page content transcription
If your browser does not render page correctly, please read the page content below
Article

Bayesian Survival Analysis Model for Girth Weld
Failure Prediction
Qingshan Feng 1,2,3, Shengyi Sha1,* and Lianshuang Dai 4
 1  Pipeline Integrity Management Center, PetroChina Pipeline Company, Beijing 065000, China;
    qsfeng@petrochina.com.cn
 2 College of Pipeline and Civil Engineering, China University of Petroleum, Beijing 266580, China

 3 The Erosion/Corrosion Research Center, The University of Tulsa, Tulsa, OK 74104, USA

 4 School of Materials Science and Engineering, Tianjin University, Tianjin 300072, China;

    lsdai@petrochina.com.cn
 * Correspondence: shashengyi@petrochina.com.cn; Tel./Fax: +86-316-2170873

 Received: 26 February 2019; Accepted: 10 March 2019; Published: 18 March 2019

 Abstract: The formation and development of a dataset for pipeline systems have affected the
 management and decision-making of pipeline operators. The dataset, combined with a proposed
 theoretical analysis method, can provide significant improvement for the safe and economic
 operation of pipelines. On the basis of the pipeline data and its essential impact on pipeline risk
 assessment, the authors propose for the first time the Staged Bayesian failure model for girth welds
 of a pipeline, using the “tree-type” accident theory and Bayesian survival analysis method. This
 model of girth welds is consistent with the distribution of Kaplan–Meier functions and can predict
 the influence of different factors on the survival probability of girth welds. These new research
 results can lay the technical foundation for the failure analysis of pipeline girth welds.

 Keywords: survival analysis, pipeline, girth weld, prediction

1. Introduction
     The rapid growth of population and economies requires increased oil and gas pipeline
infrastructure. There were 3500 oil and gas pipelines in service worldwide until 2015, with a total
length of 1.83 million kilometers [1]. Pipelines are one of the safest ways to transport oil and gas but
can cause horrific damage to buildings and injury or death to nearby residents once a rupture occurs
[2]. Most of the accidents have indicated that the pipeline is always at risk of different kinds of
fractures at fragile points that can be known or undetected [3]. Pipeline operators continuously seek
ways to operate under safe and economic conditions, and the findings from this work can aid in this
important objective.
     New natural gas pipelines with high-pressure, large-diameter pipes and high-grade steels have
become major trends in international construction [4,5]. However, in recent years, there have been a
number of ruptures and leakages of new pipeline girth welds, which have led to serious property
damage, environmental pollution, and even casualties [6,7]. The failure of pipe girth welds has
become a major issue that threatens the safe operation of pipelines. According to casual statistics,
there were about 64 cracks and leakages that caused accidents in onshore pipelines s from 2005 to
2015 in the United States and China [8]. Thus, the issue of to how to detect and evaluate more than
160 million girth welds on pipelines around the world and prevent the cracking of girth welds has
become a worldwide concern. Because of the special position of girth-weld defects, it is difficult to
identify and accurately quantify a defect size through in-line inspection. Especially for high-pressure
natural gas pipelines, there is no mature detection technology for girth-weld cracks. In terms of
existing trenchless technology, magnetic flux leakage (MFL) techniques are still considered to be the

Appl. Sci. 2019, 9, 1150; doi:10.3390/app9061150                                 www.mdpi.com/journal/applsci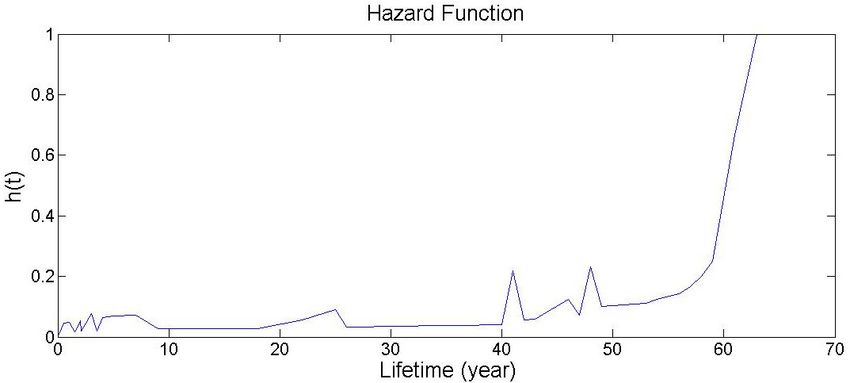
Appl. Sci. 2019, 9, 1150                                                                            2 of 11

most cost-effective and easy-to-implement techniques among girth-weld defect-detection methods
[9,10]. However, the irregular girth-weld morphology makes it difficult to accurately identify and
quantify the girth-weld defects in a short detection window. At present, there are no specific precision
requirements for MFL inspection for girth-weld defects. The decision for girth-weld repair plans in
accordance with the standards of the Fitness for Service (FFS) and Engineering Critical Assessment
(ECA)methods [11–13] based on MFL inspections alone may significantly increase the operating
costs, because of the possibility of large deviations in the data. Decisions based on this type of data
cannot completely eliminate the risk of girth-weld failure. Furthermore, the factors influencing the
failure of girth welds are relatively complex and still difficult to quantify and analyze and include
welding defects, weld geometry, and loading, which is also affected by complex external factors, such
as soil displacement, earthquakes, floods.
     Traditional managers are accustomed to using general knowledge, limited experience, and
limited data to determine the possible risk factors and locations of leaks in pipelines. However, the
limitation of this method has been to use the data collected from other pipelines to analyze the data
of a specific pipeline by analogy. Additionally, insufficient data regarding the pipe and the
surrounding environment lead to the incorrect evaluation of the results. After decades of
development, this model has improved and become a relatively more mature technology, with quite
remarkable effects [14,15]. Many experts continue to revise evaluation models and algorithms in this
area, so that the accuracy of risk prediction is continuously improved under limited cognitive
conditions [16,17]. However, recent pipeline accidents show that there is an urgent need for research
on how to use the information to identify and evaluate the failure of girth welds and on to how
convert the information into practical aspects of integrity management to improve the safety of
pipeline operation. Therefore, current research has tended to focus on new prediction methods in
substitution of the traditional risk-assessment model. Although the current information or data have
certain problems such as accuracy, they are enough to help to improve the evaluation of the safety
status of the pipeline.
     Previous research focused on discussing the knowledge of Pipeline Big Data (PBD) and what
will change in the risk model [18]. With the development of technology, part of the dataset of the
PetroChina pipe has become systematic and comprehensive, helping to almost fully understand the
risk factors of the pipeline. This has permitted to change from “black-box” identification and
evaluation of the risk factors to “white-box” identification and full control of the operators. This paper
is an attempt to set up a framework method of girth-weld prediction with the Bayesian survival-
analysis algorithm based on data t, “tree-type” accident-cause theory, and anti-fragile concept to
avoid the method of simple data analysis or the traditional risk analysis [19,20]. This framework is
aimed to improve the tools of girth-weld failure prediction to reduce accidents and prevent disasters
similar to the San Bruno pipeline rupture.

2. Survival Prediction Model

2.1. Girth-Weld Failure Causes
     Detailed information or dataset can identify more failure’s causes than traditional theory
analyses of accident’s causes. Initial work in this field focused primarily on the “tree-type” accident
analysis model to analyze accidents, and risk analysis should be based on internal data analysis [21].
Once the failure-factor data are provided, then a risk model is needed to determine the “occupation
rate” between the number of unknown failure factors and that of possible known failure factors. In
other words, in the whole life cycle of a pipeline, when the failure factors of an accident are already
known, the higher the ratio, the higher the probability of an accident.
     The difference from the traditional analysis method is that the new method can be used to
determine the probability of a leak by analyzing the possibility of leaks in specific segments of a pipe
or groups defects with the same features, while the traditional method evaluates the possibility of
certain types of accidents by analogy with other accidents. It is necessary to change the type of
Appl. Sci. 2019, 9, 1150 3 of 11
analysis of such accidents, find out the factors causing the accidents, and analyze the “occupation
rate” as a data-mining rule to identify and determine the pipeline status.
According to the “tree-type” pipeline accident-cause theory and girth-weld failure data, all the
elements that may lead to the failure of girth welds are set to the part of the tree as shown in Figure
1.
Plan &
Plan & Evaluation
Data Data
Repair
Evaluation ILI
Data Monitor Temperature Pressure & Construction
Dig
Drill
Inspection Operational control
Plan
Emergency management Daily management
Material
Process
Environment
Soil- Quality Process
displacement changes
Supervision
NDT
Pressure test
Regulation Standards Laws
Institutional Education Culture Cognition
Thought Technics Social
Figure 1. “Tree-type” accident-cause model for girth weld.
The root cause, direct cause, and indirect cause of pipeline girth-weld cracking or leakage can
be summarized and analyzed according to the “tree-type” accident-cause model. Then, on the basis
of the model, it has been found that the key factors leading to the failure of the pipe girth weld include
the following:
Case 1: Girth weld with defects, such as lack of fusion, crack, data from in-line inspection ( ILI
)or X-ray.
Case 2: Physical problem of girth weld, for example, the fracture toughness of the girth weld
does not meet the standard, according to data from lab or field test.
Case 3: Geometric problem of girth weld, for example, misaligned girth weld, wall-thickness
change, presence of a dent, etc., according to data from ILI, construction record, and nondestructive
testing (NDT).
Case 4: Girth weld with additional external loads, caused, for example, by lifting and ditching
during construction, presence of a weld within or near a pipe bend, ground displacement during
operation, accidental loads, caused, for example, by earthquakes and other environmental factors,
according to data from ILI, monitoring, etc.
Case 5: Special weld, such as tie-in weld, repaired weld, according to data from construction
record.
Case 6: Non-straight girth weld deviating by over 3 degrees, according to data from ILI, NDT,
etc.Appl. Sci. 2019, 9, 1150 4 of 11
Case 7: Imprecise management records, such as one 12 m pipe recorded as a combination of
three short segments, construction company management lever, construction culture or background,
imprecise information of welding quality or failure recorded by the welding team, and similar
parameters.
Case 7 as a cause of defect is represented at the root of the tree in the above figure; Cases 1- 3, 6,
causing defects during construction, are represented in the tree trunk; Case 5 is linked to Case 7, Case
4 depends on monitoring during operation management and corresponds to the leaves of the above
tree. The death of a tree or the breakage of a branch indicates failure.
These conclusions can provide guidance for identifying high-rupture-risk girth welds. However,
due to the limitations of existing defect detection techniques, many indicators are difficult to quantify
and cannot be considered in the risk assessment or evaluation of fitness. Therefore, using the theory
and quantitative model of describing the causes of a pipeline’s defects, combined with a survival
analysis and other prediction methods, the Bayesian survival-analysis model of girth weld can be
established and can be used to analyze the influence of different factors on the life of girth welds and
predict their mean survival.
2.2. Kaplan–Meier Survival Analysis Function
The survival analysis is based on data obtained from experiments or surveys and analyzes and
infer the survival time of materials and objects. This method has been used in medicine, biology,
economics, statistics, and other disciplines [22,23]. In this paper, we took a closer look at the patterns
of girth weld failure and leaks in 64 girth-welding accidents and created a Bayesian model that
predicts the probability of a girth weld maintaining its integrity in the future. The life of a girth weld
is the time from its construction to its failure, due for example to cracking; girth-weld failure
represents its “death”. After determining the life of a girth weld, a non-parametric Kaplan–Meier
survival-method [24] is used for analysis. The life of a girth welds is described using parameters: “d”
represents the number of “deaths” of the sample at a certain time “t”, and “n” represents the number
of “survivals” of the sample at a certain time. The survival function indicates the probability of
surviving the time “t”, as shown in Equation (1):
−
( )= (1)
Hazard function is another basic function in survival analysis that measures the probability of
a sample’s “death”. The hazard function ℎ( )is calculated as:
ℎ( ) = [− ( )] (2)
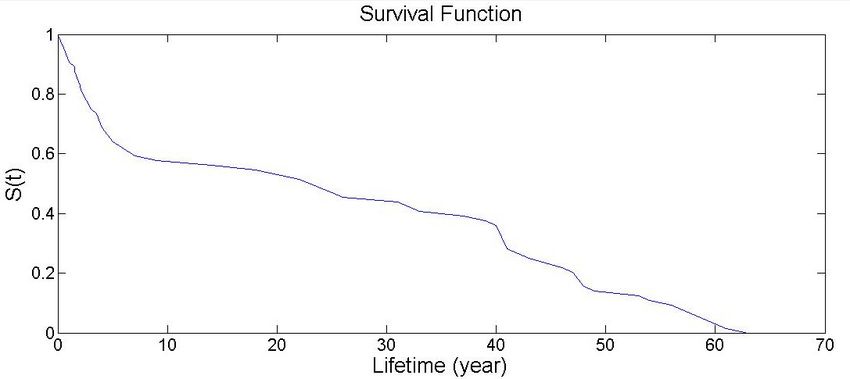
The survival curve example in Figure 2a shows that the probability of failure of girth welds
increases sharply in the first seven years and is relatively constant between 10 and 40 years; the failure
rate increases after about 40 years. This is consistent with the three stages of the Bathtub curve for
pipeline accidents, namely, the early “infant mortality” failure, the “constant” failure, and the “wear-
out” failure due to pipeline aging.Appl. Sci. 2019, 9, 1150 5 of 11
(a)
(b)
Figure 2. Survival (a) and Hazard (b) functions of girth-weld accident.
According to accident records, the girth-weld with the longest life failed in its 63rd year.
Therefore, this article can analyze only the 63rd year using the Kaplan–Meier method. There is only
one variable allowed in the Kaplan–Meier method, and it cannot predict the future development of
an event.
Also, since only the cracked, failed girth-weld samples are considered in the modeling analysis,
if data related to functional samples are combined with those of the failed girth weld, for example,
the planar defect found by in-line inspection is defined as failure, then the failure probability and
survival function of the failed girth weld will change.
2.3. Bayesian Survival Analysis Function
The Bayesian method [25] is used to obtain the distribution of parameters based on their prior
distribution and the likelihood function.
Since the 1970s, Berliner et al. [26,27] started using the Bayesian method for the analysis of
survival data. Later, different theoretical models were developed. The Bayesian survival analysis
method can make up for defects, such as small-sample and incomplete data, and achieve survival
analysis or failure prediction. The prior distribution of girth-weld failure can be described as in Figure
2a, monotonically increasing or decreasing, satisfying the characteristics of the Weibull distribution.
The probability density function of Weibull distribution is:Appl. Sci. 2019, 9, 1150 6 of 11
( | , )= exp(− ) (3)
where is the size parameter, and is the shape parameter.
The survival function represents the probability that the analysis target survives to time t,
expressed as Equation (4):
( | , )= ( > )=∫ ( | , ) = exp(− ) (4)
The sample data are related to the failure of girth welds. On the basis of the prior distribution
and sample data, the posterior distribution of parameters at each stage can be obtained by the
Bayesian method. However, we cannot determine the posterior distribution of parameters and
before the analysis. Therefore, the Markov Chain Monte Carle (MCMC) [28] is used to solve the
problem that the parameters of the posterior distribution are unknown, and the calculation process
is complex. The calculation of the posterior distribution of the two parameters is performed by the
WinBUGS [29]. Consider that the average value of the two parameters was 0.7298 and 0.1118. Because
the sample data were taken from the failure girth-weld data, in the 63rd year, all girth welds failed,
and the corresponding survival probability was 0. Take the lower-limit value and the upper-limit
value of the two parameters under the 90% confidence interval. The survival function is shown by
the dotted line in Figure 3.
If the survival function conforms to the Weibull distribution, [− ( | , )] is linearly
distributed to ( ) .
[− ( | , )] = ( ) + ( ) (5)
The Kaplan–Meier survival function in Figure 3 does not exactly fit the linear relationship.
Therefore, the data of girth-weld failed samples do not completely conform to the Weibull
distribution. In Figure 3, the data from 10 years are in good agreement with the Weibull distribution;
however, a wide range of confidence intervals and some of the data are outside the range after 10
years because of a limited sample number.
According to the distribution trend of the survival curve in Figure 2a, the posterior distribution
can be divided into three stages. Different stages use different functional forms, which can be called
Staged Bayesian. This model is a brand-new Bayesian form and is proposed in this paper for the first
time. The Weibull distribution was used in the early “infant mortality” failures stage, the uniform
distribution was used in the second stage, and the exponential distribution was used in the last one.
The cutoff years between stages are 10 and 40, which were selected according to historical statistics
and the turning point in the survival curve of girth welds. The Weibull distribution still uses the
parameter estimates of the survival function in Figure 2. The Table 1 shows the parameters and values
of Staged Bayesian. As shown in Figure 3, the Staged Bayesian distribution is consistent with the
Kaplan–Meier survival function, and the fitting results are matched.Appl. Sci. 2019, 9, 1150 7 of 11
1.2
Kaplan-Meier
1
Staged Bayesian
Bayesian curve
0.8
the upper limit
the lower limit
S(t) 0.6
0.4
0.2
0
0 20 40 60 80
Lifetime (year)
Figure 3. Survival function of girth-weld failure accident.
Table 1. Survival function parameter of different stages.
Lifetime (Year) 0–10 11–40 41–63
Weibull distribution Uniform distribution Exponential distribution
Type
exp(- t ) Kt C a exp( - t)
Parameter α λ K C a λ
Value 0.7298 0.1118 -0.005796 0.642026 13.08 0.09138
3. Survival Probability and Cases
Section 2 analyzes several key factors closely related to a girth-weld accident based on the “tree-
type” accident cause theory. The prediction method is discussed in Section 2.3. It is well accepted that
the rupture of a girth weld is often caused by multiple factors simultaneously. If each factor is
independent of time, it will occur only under random conditions or conditions that cause fragility. It
is assumed here that an undamaged pipe girth weld does not fail in service, and only a defective weld
can be predicted to fail, as a consequence of the 7 factors mentioned in Section 2.1. The influence of
different factors on the failure of a girth weld was analyzed by predicting the survival function
factors.
It is assumed that the largest number of factors causing a certain type of pipeline accident is m,
and the pipeline state is found to have k factors. According to the occupation rate, the probability of
occurrence of the accident is k/m. However, we should distinguish the extent to which each factor
affects the failure.
The survival function uses the staged Bayesian result in Figure 3. The 14 girth-weld failures with
detailed information were selected for setting up the survival probability modeling in the “infant
mortality” stage. These 14 failure cases, from a total of 64 failure cases, s occurred after less than 10
years of service . Table 2 shows the factors related to each case, with the top 7 factors as described in
Section 3; 1 means that the corresponding factor is satisfied, 0 means that it is not satisfied, and 2
means that two elements of the same factors are satisfied.
Table 2. Failure cases with failure factors.
Failure Casing Failure Lifetime Case 1 Case 2 Case 3 Case 4 Case 5 Case 6 Case 7Appl. Sci. 2019, 9, 1150 8 of 11
1 0.35 1 1 0 1 1 0 0
2 0.5 1 1 0 1 2 0 0
3 0.5 1 0 0 1 0 0 0
4 0.5 1 0 2 0 1 0 0
5 1 1 0 1 0 2 0 0
6 1 1 0 0 0 1 0 0
7 1 1 0 1 1 0 0 0
8 1.5 1 1 0 0 1 0 0
9 1.5 1 1 1 0 1 0 0
10 2.1 1 0 1 1 1 0 0
11 3 1 0 0 0 0 0 0
12 3.5 1 0 0 0 1 0 0
13 4 0 0 2 0 0 1 1
14 7 1 0 0 1 0 0 0
Firstly, according to the 14 accident samples, the life curve of every single factor leading to the
failure of the girth weld was calculated, and the influence of each factor on the failure probability of
the new pipe girth weld was determined. Then, the life curve of the girth failure was analyzed
considering all factors and comparing the effects on girth-weld failure of various combinations of
them, that is, the probability of “survival”.
According to these assumptions, to directly consider the influence of multiple factors on a girth-
weld function, let λ of staged Bayesian be:
= + + + + + + + (6)
where:
~ Indicates the influence factor of seven different cases on the failure of the girth weld,
is a correlation factor between different factors,
~ represents the values corresponding to seven different Cases (see Table 2).
The girth-weld survival function based on the failure case sample is determined by calculating
and ~ in Equation (6).
Figure 4 shows the survival function of the girth weld under the influence of a single factor. As
can be seen from Figure 4, the lowest probability of girth weld survival is when the physical
properties of the weld do not meet the specifications, which means that it is the most critical of the
seven factors; and the impact of Case1 is relatively small. Therefore, the mechanical properties of the
weld should be strictly controlled by monitoring weld defects.
1
0.9
0.8
0.7 Case1
0.6 Case2
Case3
S(t)0.5
0.4 Case4
Case5
0.3
Case6
0.2
Case7
0.1
0
0 2 4 6 8 10
Lifetime (year)
Figure 4. Survival function of the girth weld under the influence of a single factor.Appl. Sci. 2019, 9, 1150 9 of 11
Figure 5 shows the predicted survival function of the girth weld under the influence of several
different factors, where:
Num1 indicates that only the Case1 factor is operating,
Num2 indicates that the Case1 and Case4 factors are operating,
Num3 indicates that the Case3, Case4, and Case5 factors are operating,
Num4 indicates that the Case1, Case2, Case3, and Case4 factors are operating,
Num5 indicates that the Case1, Case2, Case3, Case4, and Case5 are operating,
Num6 indicates that other factors than Case6 are operating,
Num7 indicates that all factors are operating.
As the failure factor increases, the occupancy rate also increases, and the survival probability of
the girth weld is significantly reduced. So, the more the factors, the more fragile the girth weld.
1
0.9
0.8
Num1
0.7
0.6 Num2
S(t) 0.5 Num3
0.4 Num4
0.3 Num5
0.2
Num6
0.1
Num7
0
0 2 4 6 8 10
Lifetime (year)
Figure 5. Survival function of the girth weld under the influence of several different factors.
The algorithm was also used to verify the failure of a girth weld of a high-pressure, API X80 steel
natural-gas pipeline. The pipeline was commissioned in 2013, the first girth-weld cracking accident
occurred in 2017, and the second cracking accident in 2018. Failure analysis showed that the failure-
causing factors included external force caused by soil movement, changes in wall thickness, elbow
joint, and weld impact toughness. That means these failure factors are those of Cases 2, 4, and 5.
According to the survival function model described above, a weld with similar failure factors had a
survival probability of 0.120 in 2017 and of 0.109 in 2018. If the accident in 2017 is included to the
sample, and the impact factor of Equation 7 is recalculated, the survival probability of the girth weld
in 2018 changes to 0.104, which is not much different from the original calculation result. Therefore,
the number of samples is sufficient for effectively predicting the cracking of the girth weld.
This study also analyzed the other girth welds in this pipeline, and the statistical results showed
that only two weld failures corresponded Cases 2, 4, and 5 at the same time; also, Case 4, was not
represented by other weld failures. So, two girth-weld accidents occurred since the hydrotest. The
pipeline operating company should take measures to prevent additional external loads from pressing
on the pipe.
The failure factors of girth welds are relatively complex and difficult to quantify, and traditional
risk assessment determine the possible risk factors on the basis of general knowledge and limited
experience. This paper proposes a new model to improve the tools of girth-weld failure prediction.
With this model, it is easy to determine the failure trend in time and the most critical factors and
combination of factors for girth welds of a pipeline.
4. ConclusionsAppl. Sci. 2019, 9, 1150 10 of 11
This study first proposes the Staged Bayesian survival analysis model for girth-weld failure
prediction using the tree-type cause theory and survival analysis method. The results show that the
Staged Bayesian model is consistent with the Kaplan–Meier model. Meanwhile, the results of the
model fit the trend of the “Bathtub Curve” of a pipeline and the intrinsic characteristics of a girth
weld. Further analysis based on the survival model shows the tendency of the survival probability of
the girth weld under the influence of a single factor and of several combinations of different factors,
according to data of previous 14 accidents that happened within 10 years of pipe life after hydro-
pressure. The model and analysis method can also be used to improve the risk assessment and
provide guidance for risk-mitigation measures for the company operating a pipeline.
Author Contributions: Qingshan Feng and Lianshuang Dai conceived and performed the investigation, and
Shengyi Sha analyzed the data. Qingshan Feng and Shengyi Sha wrote the article.
Funding: This research was funded by the China National Key Research and Development Program of China
(No. 2016YFC0802100) grant number [No. 2016YFC0802100] and PetroChina Pipeline Company research
projects grant number [20140201].
Acknowledgments: We would like to thank Professor Siamack A. Shirazi, University of Tulsa, for his help in
research.
Conflicts of Interest: The authors declare there is no other conflicts of interest regarding the publication of this
paper.
References
1. Song, A.; Liang, G.; Wang, G. Status Quo and Development of Worldwide Oil and Gas Pipelines. Oil Gas
Storage Transp. 2005, 24, 1–6.
2. American Petroleum Institute. Association of Oil Pipelines; 2017 Performance Report; American Petroleum
Institute: Washington, DC, USA, 2018.
3. Feng, Q.; Dai, L. Revelation of Pipeline Accidents; China Building Materials Press: Beijing, China, 2016; pp. 5–
15.
4. Li, H. Some Hot Issues in the Research and Application of Natural Gas Transmission Steel Pipes. Welded
Pipe Tube 2000, 3, 43–46.
5. Li, H. Trends and Prospects of Development of Oil and Gas Pipelines. Welded Pipe Tube 2004, 6, 1–19.
6. Hu, M.; Liu, Y.; Zhu, L.; Qi, L.; Yang, F. Analysis of leakage failure of girth welded joints in natural gas
transmission pipelines. Welded Pipe Tube 2014, 2, 56–63.
7. Bruce, W.A.; Amend, W.E.; Wang, Y.; Zhou, H.M. Guidelines to Address Pipeline Construction Quality Issues;
Pipeline Research Council International; Chantilly, VA, USA, 2013.
8. PHMSA. Pipeline Safety-Flagged Incidents [EB/OL]. 14 December 2013. Available online: (accessed on 12
May 2015).http://primis.phmsa.dot.gov/comm/reports/safety/PSI.html 2013.
9. Feng, Q.; Li, R.; Nie, B.; Liu, S.; Zhao, L.; Zhang, H. Theory and Application of In-Line Inspection
Technologies for Oil and Gas Pipeline Girth Weld Defection. Sensors 2017, 17, 50.
10. Wang, T.; Yang, H.; Feng, Q.; Zhou, L.; Wang, F.; Xiang, X. Current status and the prospect of inline
inspection technologies for defects in girth weld of oil and gas pipeline. Oil Gas Storage Transp. 2007, 34,
694–697.
11. API 579-1/ASME FFS-1: Fitness-For-Service; American Petroleum Institute: Washington, DC, USA,2016.
12. British Standards Institution. BS 7910 Guide to Methods for Assessing the Acceptability of Flaws in Metallic
Structures; British Standards Institution: London, UK, 2013; pp. 25–59.
13. Amend Bill, P.E.; Columbus, D.N.V. Vintage Girth Weld Defect Assessment Comprehensive Study; Pipeline
Research Council International; Chantilly, VA, USA, 2010; pp. 33–37.
14. Peter, T.; Nader, Y.-G.; John, B. Benchmarking Pipeline Risk Assessment Processes. In Proceedings of the
9th International Pipeline Conference, IPC 2012-90045, Calgary, AB, Canada, 24–28 September 2012.
15. Zhang, H.; Cheng, W.; Zhou, L.; Feng, Q.; Zheng, H.; Dai, L.; Xiang, X.; Cao, T.; Liu, Y. Pipeline risk
assessment practice of PetroChina Pipeline Company. Oil Gas Storage Transp. 2012, 31, 96–98.
16. Dai, L.; Zhang, J.; Zhang, X.; Zhang, H.; Xiang, X.; Cao, T.; Feng, Q.; Zheng, H. Risk Score Pipeline Risk
Assessment and Its Application. Oil Gas Storage Transp. 2010, 29, 818–821.Appl. Sci. 2019, 9, 1150 11 of 11
17. Mojtaba, M.; Li, C.Q. Failure assessment and safe life prediction of corroded oil and gas pipelines. J. Pet.
Sci. Eng. 2017, 151, 434–438.
18. Feng, Q. A thought over the pipeline risk assessment methods based on Big Data. Oil Gas Storage Transp.
2014, 33, 457–461.
19. Feng, Q. Theoretical study on characteristics and quantification of oil and gas pipeline failure. Oil Gas
Storage Transp. 2017, 36, 369–374.
20. Feng, Q. “Tree-type” model of accident cause theory. Oil Gas Storage Transp. 2014, 33, 115–128.
21. Feng. Q. New Concept Based on Big Data to Pipeline Risk Management. Pipeline Gas J. 2015, 242, 65–67.
22. Li, R. Based on the Bayesian Survival Test Censored Regression Model and Its Application; Hunan University:
Changsha, China, 2006.
23. Philip, H. Analysis of Multivariate Survival Data; Springer: New York, NY, USA, 2001.
24. Kaplan, E.; Meier, P. Nonparametric estimation from incomplete observations. J. Am. Stat. Assoc. 1958, 53,
457–481.
25. S. James Press. Bayesian Statistics: Principles, Models, and Applications; Wiley: New York, NY, USA, 1992.
26. Chen, W.C.; Fayos, J.V.; Hill, B.M. Bayesian-analysis of survival curves for cancer-patients following
treatment. Biometrics 1978, 34, 531–541.
27. Omurlu, I.K.; Ture, M.; Ozdamar, K. Bayesian Analysis of Parametric Survival Models: A Computer
Simulation Study based Informative Priors. J. Stat. Manag. Syst. 2015, doi:10.1080/09720510.2014.961763.
28. Gilks, W.R.; Richardson, S. Markov Chain Monte Carlo in Practice; Chapman and Hall: New York, NY, USA,
1995.
29. Lunn, D.J.; Thomas, A.; Nicky, B.; David, S. WinBUGS-A Bayesian modeling framework, concepts,
structure and extensibility. Stat. Comput. 2000, 10, 325–337.
© 2019 by the authors. Licensee MDPI, Basel, Switzerland. This article is an open access
article distributed under the terms and conditions of the Creative Commons Attribution
(CC BY) license (http://creativecommons.org/licenses/by/4.0/).You can also read