What's New in Maptitude 2021 - Caliper Corporation
←
→
Page content transcription
If your browser does not render page correctly, please read the page content below
What’s New in Maptitude 2021

Maptitude 2021: New Features Overview
  Maptitude 2021 is a major release of Caliper Corporation’s popular Geographic Information
  System (GIS) and mapping software. The 2021 version provides the most up-to-date and accurate
  data available.

  Maptitude 2021 provides the business value you expect when investing in mapping software.
  Maptitude includes the latest streets, postal data, and demographics. Maptitude 2021 is the
  fastest and most intuitive professional mapping application, with significant enhancements to
  sharing, visualizations, and logistics/operations analytics.

  Key Features of Maptitude 2021
  1.  The most up-to-date geographic and demographic information available, including improved
      points-of-interest/landmarks, and new free USA data for building footprints and address points
      that are useful for site evaluation, direct mailing, and deliveries. Plus, a financial assets dataset
      that is essential for any organization that relies on wealth-related statistics.
  2. Uploading maps to Maptitude Online allows you to easily share your data privately with
      your team or publicly as a web app.
  3. Maptitude is faster with improvements to routing for multiple destination directions, quicker
      display of imagery and aerial layers, and more rapid opening and closing of maps.
  4. One of the best features of MapPoint was being able to use sliders to adjust driving speeds
      by road type to make travelling along them faster or slower. Maptitude has taken this a step
      further by allowing you to explicitly define speeds.
  5. The new Market Share (Huff Model) tool adds to our growing suite of logistics tools,
      estimating potential sales for your existing or proposed sites versus the competition, and
      showing you areas with high and low market share.
  6. A variety of new visualizations have been added including new chart types for box plots,
      histograms, full stack bar charts, and radar charts. There are also new theme add-ins that
      allow you to visualize multiple columns of data as 3D cylinders or heat maps.
  7. Differentiating points on a map is clearer when adding additional tables or spreadsheets,
      through the automatic use of different colored pushpins for each new map layer.
  8. A new Google Maps toolbar allows you to see your current map location in any of the
      different Google Maps views including Street View.
  9. Interoperability with external data has been expanded with support for multiple tracks in GPS
      data, support for DeLorme drawing files and Scalable Vector Graphics images, export to SQLite
      Tables, and support for projection files with either ESRI or OGC WKT definitions.
  10. Interoperability with Maptitude has been expanded with fast PostgreSQL asynchronous
      handling and selecting, quick conversion of tables to NumPy Panda DataFrames, the Python 3
      CaliperPy package, and the CaliperR R package.

                                                                                         www.caliper.com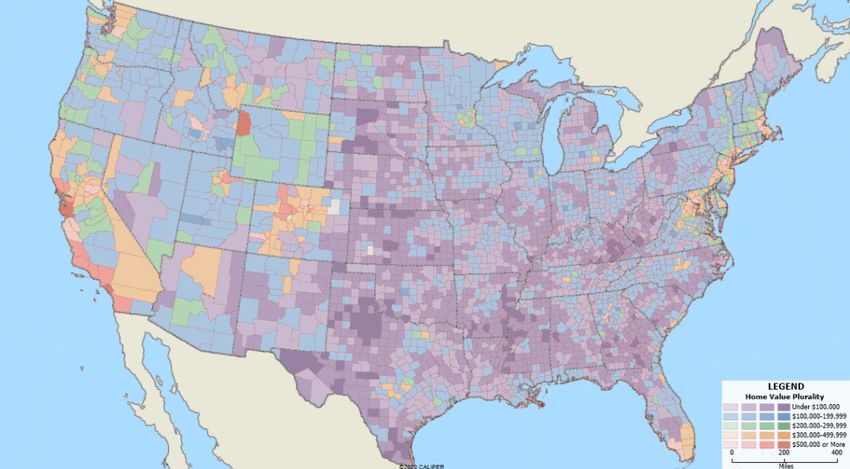
Maptitude can map your
              information whether you
              have data from Google
              Maps, from a Microsoft
              mapping product such as
              MapPoint, or from Microsoft
              Office. You can analyze your
              information using the
              intuitive Maptitude 2021
              mapping wizards and export your results as attractive, preformatted Excel or PDF reports, or
              upload them to Maptitude Online for public or private sharing.

              Maptitude delivers easy-to-use professional mapping tools and data at the unbeatable price of
              only US$695 (or US$395 for upgrades.) For pricing and ordering information, please visit the
              Mapping Software Store, e-mail Maptitude Sales, or call US sales at +1 617-527-4700.

           New Data
              Maptitude 2021 comes standard with one detailed Country Package of your choice, and
              additional Country Packages can be purchased separately. Each Country Package includes a
              wealth of data unavailable in any other product, such as an up-to-date street layer with addresses
              for pin-mapping (geocoding) and travel time information for computing routes and drive-time
              rings. Features such as building footprints for many urban locations, railways, and named
              landmarks are also built into the software. The comprehensive landmarks range from public
              facilities to commercial buildings including businesses, restaurants, and retail stores, and include
              addresses and phone numbers where available. Where available, postal data and detailed
              demographics are shipped with the product.

              As you switch between the countries you have purchased, Maptitude will seamlessly refresh the
              interface with country-specific tools such as Create-A-Map Wizard and tools for finding, pin-
              mapping, and routing. New Map Libraries allow you to easily create attractive geographic and
              demographic maps while locating unlimited numbers of addresses and territory-based records.

              The basic global map that is provided with every Maptitude license enables you to view your data
              for anywhere on Earth, and it allows you to map your locations by coordinate, manually, or by any
              populated place (village/town/city).

              United States
              New U.S. datasets provide access to the most up-to-date geographic information available.
              Maptitude 2021 comes with October 2020 HERE® Map Content, which allows for accurate address
              locating and street visualization, in addition to robust data that you can use to calculate
              directions, drive-time rings, and drive-time territories. Speeds based on HERE Traffic Patterns are
              included.

              Other 2020 U.S. map layers from HERE include those for buildings, highways, railroads, and
              landmarks. The Points of Interest layer contains over 2.9 million named public and business
              locations.

What’s New in Maptitude 2021                                2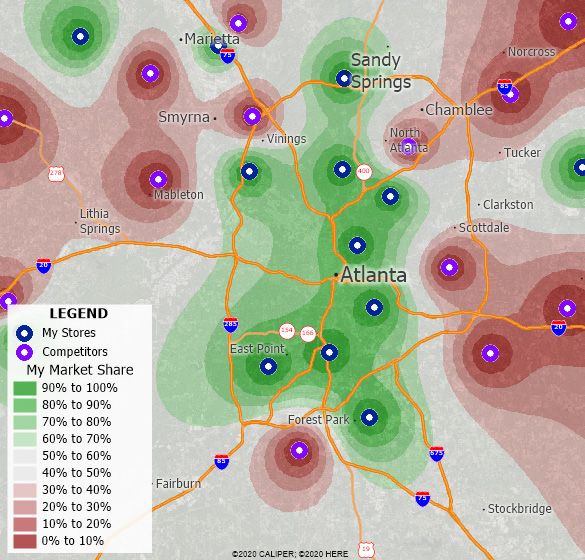
Maptitude 2021 ships with the January 2021 ZIP Code update to ensure that you are using the
latest data. The 5-digit ZIP Code boundaries are a nationwide area database with ZIP Codes for all
50 states, the District of Columbia, Puerto Rico, and the territories.
Other standard features of Maptitude 2021 are updated 3-digit ZIP Code areas and a point
database of ZIP Code points for the entire country. The ZIP Code area layers extend into non-
deliverable areas to provide complete coverage of the USA. The 3-digit and 5-digit ZIP Code
areas include updated counts of businesses by detailed industry type (retail, finance, etc.), along
with the number of employees working in each ZIP Code, and annual payroll figures. The ZIP
Codes are also classified by their updated rural-urban commuting characteristics and with the
numbers of hospitals, hospital beds, and healthcare providers.
The US Census boundaries (e.g., Tracts, Places, Counties, MCDs, MSAs, States) and the 3- and 5-
digit ZIP code areas that come with Maptitude contain some or all of several demographic
profiles from a variety of data providers. These sources include the 2010 Census and the 2019
American Community Survey (ACS) to name a few. This data is available for the USA, Puerto Rico,
and the Territories. These layers include daytime population, and percent change (2018 to 2019)
in population, median income, and mean income. The ZIP Code, Tract, County, and State layers
also include updated buying power (disposable income for 2018) figures. Tracts also list updated
banking compliance FFIEC data for 2020 and designated Qualified Opportunity Zones (QOZs).
Personal income and change in personal income BEA data for 2019 are included for States and
Counties, and 2019 GDP (by total, goods, services, government, and by 2-digit NAICS code) and
change in GDP BEA data for 2017 are included for Counties. 2025 population projections for
Counties, States, and Tracts are included by age, race, gender, and ethnicity, and for population
by 5-year increment for 2025-2060. The Demographic Map Librarian tool makes it easy to
access a series of pre-defined thematic and shaded maps of these updated data and has new
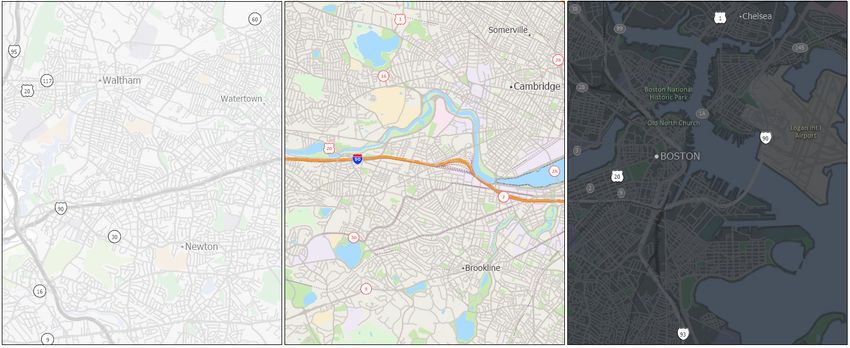
“Tribal Land,” “USA (Dark Theme),” and “USA (Light Theme)” options.
Light theme, standard, and dark theme background overview maps
3 www.caliper.com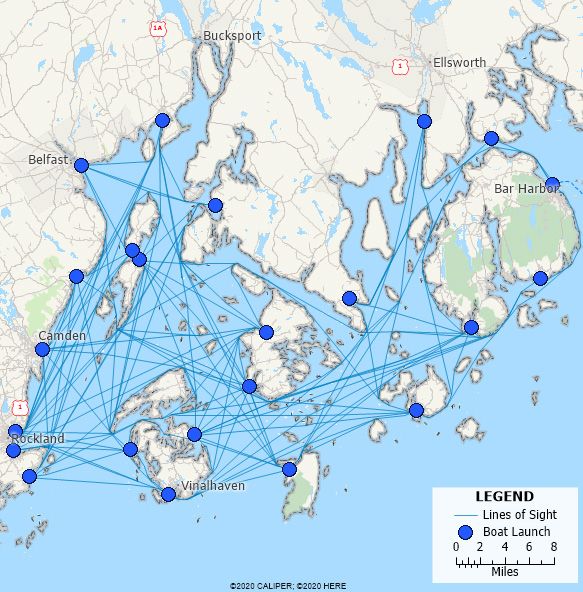
The Country Package updates under development are listed below:

              Australia
               • October 2020 HERE update with speeds based on noontime HERE Traffic Patterns
               • Updated HERE postal boundaries and centroids

              Brazil
               • October 2020 HERE update with speeds based on noontime HERE Traffic Patterns
               • Updated HERE postal boundaries and centroids

              Canada
               • October 2020 HERE update with speeds based on noontime HERE Traffic Patterns
               • Updated 3-character postal Forward Sortation Area (FSA) boundaries and centroids (HERE)
               • Updated 6-character postal point layer (HERE)
               • New 6-character postal area layer (Caliper Created/Derived from HERE)
               • 2020 Population estimates for Provinces

              United Kingdom
               • October 2020 HERE update with speeds based on noontime HERE Traffic Patterns
               • Updated postal boundaries for the UK (HERE)
               • Updated postal boundaries and postcode points for GB (Caliper)
               • 2019 Estimated population by age and gender, UK

              Mexico
              • October 2020 HERE update with speeds based on noontime HERE Traffic Patterns
              • Updated HERE postal boundaries and centroids

              New Zealand
               • October 2020 HERE update with speeds based on noontime HERE Traffic Patterns
               • Updated HERE postal boundaries and centroids

              Spain, Italy, France, United Arab Emirates (UAE), DACH (Austria, Germany, Switzerland,
              Liechtenstein)
               • October 2019 HERE update with speeds based on noontime HERE Traffic Patterns
               • Updated HERE postal boundaries and centroids (not available for UAE)

What’s New in Maptitude 2021                             4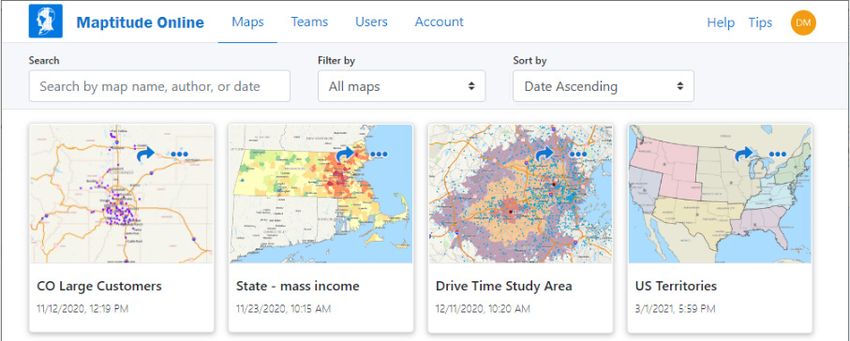
Network Analysis, Directions, and Routing
  Maptitude 2021 gives you powerful tools to model routes, to calculate the distances and travel
  times between locations, and to display and analyze service provision over the road network.

  Drive-Time Influence Areas Tool
  The Tools>Routing & Directions>Drive-Time Influence Areas tool now:

   • Works much more quickly and creates smoother boundaries.

  Routing & Directions Manager
  The Tools>Routing & Directions>Routing & Directions
  Manager now:

   • Allows you to explicitly specify road speeds by road type,
     by typing the desired speed, in addition to adjusting
     speeds using sliders to make the speeds faster or slower.
   • Supports faster routing for multiple destination directions.
   • Allows the choice of routing on the US Major Street or
     Highway/Freeway layers.

  Routing Deliveries and Pickups Add-In
  The Routing Deliveries and Pickups Add-In now:

   • Allows you to find vehicle routes and customers by name.

  Drive-Time Rings Toolbar
  The Drive Time Rings Toolbar creates the most accurate drive-distance travel analysis on the market.
  The Tools>Routing & Directions>Drive-Time Rings tool now:

   • Allows you to explicitly specify road speeds by road type,
     by typing the desired speed, in addition to adjusting
     speeds using sliders to make the speeds faster or slower.
   • Allows you to build the rings from the central origin points
     (outbound) or to the origins (inbound). This allows you to
     see the service areas for your locations based on how long
     it takes customers to get to a store, or how long it takes you
     to deliver to your customers from a central location.
   • Supports more accurate drive-time rings when rings are
     under one minute and in coastal areas.
   • Allows the choice of routing on the US Major Street or
     Highway/Freeway layers, for long haul drive-time rings.

                                                5                                   www.caliper.com
Distance and Travel-Time Tables Tool
Maptitude 2021 makes it easy to identify alternative service suppliers, backup field
representatives, and closest locations. The distance and drive-time tool creates an Excel table that
lists the costs of travel between any number of origins and destinations, allowing you to easily
sort the data to identify the closest locations.
The Tools>Routing & Directions>Distance and Travel Time Tables tool now:
• Allows you to explicitly specify road speeds by road type, by typing the desired speed, in
addition to adjusting speeds using sliders to make the speeds faster or slower.
• Allows Visible Features to be chosen for the origin set and destination set.
• Adds Traffic Model support when using the 3rd-party web service provider Google, via
Tools>Routing & Directions>Web Services>Distance and travel Time Tables. For example,
you can obtain a Google Maps API web service license and then choose in Maptitude:
o Best Guess, Pessimistic, or Optimistic that are used to obtain driving time estimates that
assume differences in congestion, respectively, for average, lighter than average, or
heavier than average traffic conditions, based on historical averages. This allows you to
explore different scenarios and to perform a sensitivity analysis.
New Map Styles
Maptitude 2021 gives you the greatest flexibility to date in setting the styles of map features,
themes, and selection sets.
Themes
• A free add-in “Color Theme (Multiple Fields)”
o Color themes with multiple fields are a new way to visualize and compare your data. The
theme allows you to map multiple patterns within a single map and help you see if
different columns of data are related. The color ramp for each data field is combined into
a grid-like legend.
• A free add-in “3D Theme (Cylinders)”
o 3D cylinder themes are a new way to visualize your data in 3D. For example, if you have
sales or volume data, you can present the information as tall cylinders with proportional
sizes and colors based on the number of columns of data you are comparing.
What’s New in Maptitude 2021 6New Database Functionality
Several new capabilities for geographic databases have been introduced.
• Enabled longer field names for several table types including Caliper Binary, ASCII, and CSV,
increasing the field width name limit from 41 to 241 characters, allowing more descriptive
column titles.
• Enabled export to Excel of empty/null values in numeric fields as numeric values.
• Enabled coded, numeric, fields in Dataview>Table>Modify>Attach Codes so that when a
code is numeric the lookup value can now be text or numeric. Using codes saves space
because long character strings are replaced with shorter codes.
• Added Tools>Editing>Conflate Line Segments that lets you interactively reshape line features
in a layer to match the more accurate shape of lines in a different layer. For example, to improve
the accuracy of a franchise boundary based on the geometry of roads or other features.
• Added a Dataview>Charts menu item in addition to the Charts button in the Standard toolbar.
Locating Data
The geocoding tools use the updated street and postal data, making location matching results
more accurate than in previous versions of Maptitude.
• Improved geocoding, finding, and Create-a-Map Wizard handling of cities/counties with saint
prefixes (e.g., “Ste. Genevieve County MO” or “St. Louis”)
• Improved world city/town geocoding by city, province, and state
• Improved Locate by Coordinate handling with X and Y (longitude and latitude) now
supporting text fields as well as numeric fields as input.
Improved Create-a-Map Wizard
Create-a-Map Wizard is now more robust and easier to use:
• The maps have been updated with the latest geography.
• The Linked Records feature now allows for linking to the County layer using separate County
and State fields.
• The Wizard graphics have been updated and standardized, allowing for a more seamless and
familiar experience as you work through the Wizard and when switching between Country
Packages.
• The Map>Add Table/Spreadsheet to a Map tool automatically uses a different default color
for each additional pushpin layer created, visually differentiating your data in the map.
Projections/Datums
Maptitude 2021 has expanded support for datums and projections with:
• Better support for (*.PRJ) files with either ESRI or OGC WKT definitions
• Support for DEMs in ESRI grid format with WKT (*.PRJ) files
7 www.caliper.comAnalysis Tools
Completely new and innovative analytics were added to Maptitude 2021:
• The new Tools>Analysis>Market Share (Huff Model) tool:
o Estimates potential sales for your existing
or proposed sites versus the competition,
based on the assumption that the further
a customer is from a location, the less
likely it is that they will visit that facility.
o Shows you the areas with high and low
market share based on factors such as
population within a radius of your
proposed locations calculated by either
straight line distance or by driving
distance/time. You can then explore the
demographics of those markets, such as
expenditure, assets, and disposable
income.
• The Tools>Analysis>Facility Location tool supports a mix of area and point layers for
clients and facilities, allowing, for example, your facilities to be a list of addresses and your
demand to be demographics from a postal or census layer.
• The Tools>Analysis>Facility Location tool allows facilities to have a weighting of zero,
allowing the analysis to run even if you have missing, unknown, or no values for a particular
location.
• The Tools>Analysis>Facility Location tool allows Visible Features to be chosen for the
client set, existing set, and candidate set.
• The Tools>Analysis>Weighted Center tool supports area layers in addition to point layers,
allowing you to determine a central location using demographics from a postal or census layer.
• The Clustering Add-In:
o Creates a cluster centroid for each cluster.
o Creates much more balanced clusters.
• The new Tools>Editing>Lines of Sight tool:
o Creates a line layer in which the lines
either avoid obstacles or are drawn only
within the area covered by obstacles. For
example, lines of sight between buoys
can be created to avoid land areas or by
staying within a water area layer,
connecting all the buoys, and avoiding
islands.
o Creates a lines of sight layer that can be
used with the Tools>Routing &
Directions>Routing & Directions
Manager to, for example, find the
shortest path to visit a series of buoys
that must be serviced.
What’s New in Maptitude 2021 8Output Improvements
In Maptitude 2021:
• Added map uploading to Maptitude Online
o The File>Share>Upload to Maptitude Online is a subscription-based tool that allows
you to easily share your maps privately with your team members or publicly as a web
application.
• Added Box Plot chart type
o The Dataview>Statistics>Box Plot… chart allows you to visualize how one field
changes over a series of data, giving a clear representation of the median value as well as
how spread out the values are.
• Added Histogram Plot chart type
o The Dataview>Statistics>Histogram Plot… chart allows you to group continuous data
into ranges or group data categorically.
• Added Full Stack bar chart types
o The Dataview>Charts Full Stacked bar chart types allow you to compare different
columns of data, where each bar represents 100%, and segments in the bar represent
different parts or categories making up the total.
• Added Radar chart types
o The Dataview>Charts Radar chart types allow you to compare different columns of data,
where each “star” represents a single data column. Typically, radar charts are created to
show many “stars” with each star representing one observation for each record, such as
different demographics for each state or sales territory.
• Added customizable format settings to Dataview>Charts for numeric chart data
Imagery Improvements
Accessing, creating, and visualizing image layers is a core feature of Maptitude:
• The Map>Imagery Web Map Layers consistently display faster and with appropriate
resolution.
• The new Tools>Raster>Google Maps Toolbar opens a browser with Google Maps zoomed
to your Maptitude map location, and displays either Google Streets, Google Terrain, Google
Satellite, or Google Street View.
9 www.caliper.comNew Documentation
Maptitude continues to provide numerous ways to get you started with the software. The online
Learning Portal has been updated, and new and revised tutorials are incorporated into the
Maptitude Help.
In addition, a variety of comprehensive learning materials (including videos and live or pre-
recorded training webinars) are available on the Caliper Corporation website. The training videos
run in all browsers, with playback settings, as Vimeo and YouTube videos.
The Maptitude Help (Help>Maptitude Help) can be viewed within a web browser and has a
modern browser-based interface.
Maptitude 2021 includes a Windows Microsoft Office style question mark icon on most windows.
Clicking this will take you to the relevant section of the Help. You can also hover over any menu
item and click F1 to access the updated Help. In addition, several message windows in Maptitude
link directly to the relevant Learning Portal article.
System and Interface
Maptitude 2021 supports the latest Windows operating systems, file types, and common design
elements.
• The software, installer, and download manager are less likely to be repeatedly flagged by
anti-virus applications.
• The interface default font is now Tahoma (non-bold), which is a modern more aesthetic font,
that better supports high resolution monitor screens.
• The measuring tools (Measure Distance, Measure Size, Measure Angle) in the Tools toolbar
are now combined into a multi-tool toolstrip that supports descriptive text for each button.
• The opening and closing of many maps within a single workspace session is now faster.
• The Selection>Selection Toolbar has three new cursor icons for the selection tool when
selecting by rectangle, circle, or shape.
• The redesigned Aggregation Method window now clearly distinguishes between the fields
being chosen and filtered.
New File Import Support
• GPS Data (*.GPX) multiple tracks
• DeLorme (Street Atlas/Topo USA) drawing file (*.AN1)
New File Export Support
• SQLite Table (*.DB)
New Native File Support
• Scalable Vector Graphics (*.SVG)
What’s New in Maptitude 2021 10Geographic Information System Developer’s Kit (GISDK)
APIs
The GISDK .NET APIs make it easy to add mapping functionality to any Windows desktop
application written in Python, C#, or any other .NET programming language.
Code examples and the user documentation for the Maptitude API have been updated for
Maptitude 2021 and are included under Help>GISDK Help.
The following functions have been added or modified:
• Charts.Histogram
• Routing.Router.Calculate option "Both": route starts at the first stop and ends at the last stop
• PostgreSQLConnect and PostgreSQLCommand Classes
Highlights of the API changes:
• CaliperPy Python Package
o Replaces the Python caliperpy2 and caliperpy3 modules
o Provides access to Maptitude and the .NET framework via any program written in Python
3.x
o Works well with scientific Python distributions such as Anaconda Python
o New Features
Improved support for Python 3 programming
Removed support for Python 2
Simplified RunMacro() calling arguments
Added new class “import caliperpy” for connecting to the GISDK across Python
functions
Added translations of GISDK binary tables to and from NumPy Panda DataFrames
that are extremely fast
Added date/time support
New example scripts for working with CaliperPy
• CaliperR R Package
o Allows you to leverage Maptitude within an R session
o Makes all GISDK macros and functions available, with results sent directly to your R
environment over COM (e.g., a dataview in Maptitude becomes a data.frame in R)
o Provides the R package via GitHub (https://github.com/Caliper-Corporation/caliperR) with
package vignettes
GISDK Functions
Please see the “Listing of GISDK Functions” topic in the Online Help to view a full list of GISDK
functions that were added, changed, or replaced in Maptitude 2021. Highlights of the GISDK
changes:
• Better support for (*.PRJ) files with either ESRI or OGC WKT definitions
o ConvertWKTtoProj()
o ConvertProjtoWKT()
11 www.caliper.comAbout Caliper
Caliper Corporation develops state-of-the-art Geographic Information System (GIS) software.
With a focus on usability, Maptitude is designed to be the most cost-effective
professional mapping software product on the market. Maptitude enables organizations to
leverage their location-based data to improve decision making and planning while minimizing
expenditure through competitively priced solutions.
Caliper is a privately held corporation and is a leading developer of mapping,
redistricting, transportation, and GIS software.
What’s New in Maptitude 2021 12You can also read