Project Deliverable - CHT2 Project
←
→
Page content transcription
If your browser does not render page correctly, please read the page content below
Project Deliverable
 Number        D4.1

               Report on state of the art of innovative interaction
 Title
               environments for 4D models

 Month         M27

 Language English

Revisions record
 Rev. N. Author                 Notes                   Date
 0       Gabriele Guidi         Document framework      November 1, 2017
 1       Beata Hejmanowska      Main Document           November 21, 2017
 2       Gabriele Guidi         Format rearrangements   May 1st, 2018
 3
 4

                                                                Page 0 of 12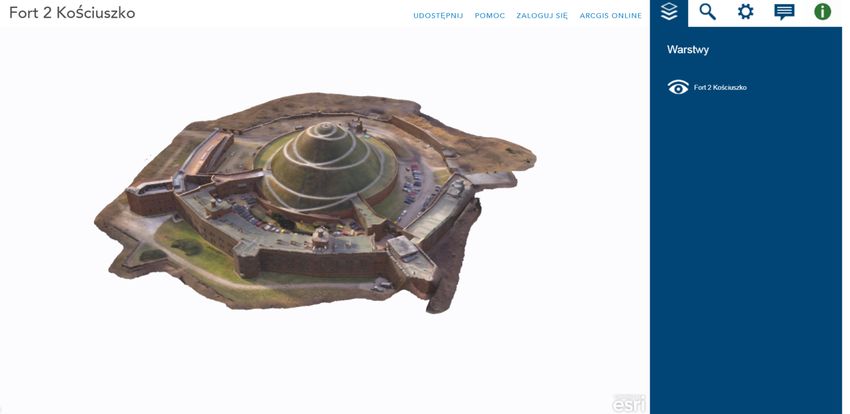
Table of Contents

Table of Contents ......................................................................................................................................... 1
1.        Introduction ......................................................................................................................................... 1
     1.1 WebGL................................................................................................................................................ 2
     1.2          Geoweb3D................................................................................................................................... 2
     1.3 Cesiumjs ............................................................................................................................................. 3
     1.4 Free GIS software ............................................................................................................................... 4
     1.5 GeoBrowser3D ................................................................................................................................... 4
     1.6 3D ArcGIS API for JavaScript ................................................................................................................ 5
2.        Tested approach .................................................................................................................................. 5
     2.1 ArcGIS................................................................................................................................................. 5
     2.2 Hexagon ............................................................................................................................................. 6
     2.3 Open Source ....................................................................................................................................... 8
     3.       Web sharing – Krakow fortress example .......................................................................................... 8
     4.       Conclusions.................................................................................................................................... 10
5.        Literature ........................................................................................................................................... 11

       1. Introduction
The article presented on the website (Geospatial World 2017) contains brief description of progress achieved
in Internet technology and 3D GIS development. Contemporary Web GIS applications are based on
client/server architecture. It means that the data are located on the server and also all the computations are
performed there. Client side constitutes user’s interface designed for controlling the processes and
visualizing the results. Such solution doesn’t require any software installed at client side. On the other hand,
it generates higher costs at server side and makes procedures longer.

Due to increasing usage of various devices, there is a need to build applications working well on PCs, laptops,
smartphones. HTML5/JavaScript are popular because they exist in every device and therefore can develop
applications which are device independent. JavaScript is a script language of World Wide Web so every device
containing a browser has a JavaScript interpreter. GIS community developed many frameworks of JavaScript,
for example OpenLayers which renders maps in browsers.

Framework is a ‘skeleton’ of application. It defines the structure of application and its principle of operation.
Framework provides a set of components and libraries for performing specific tasks (Software framework
2017).

                                                                                                                                                Page 0 of 12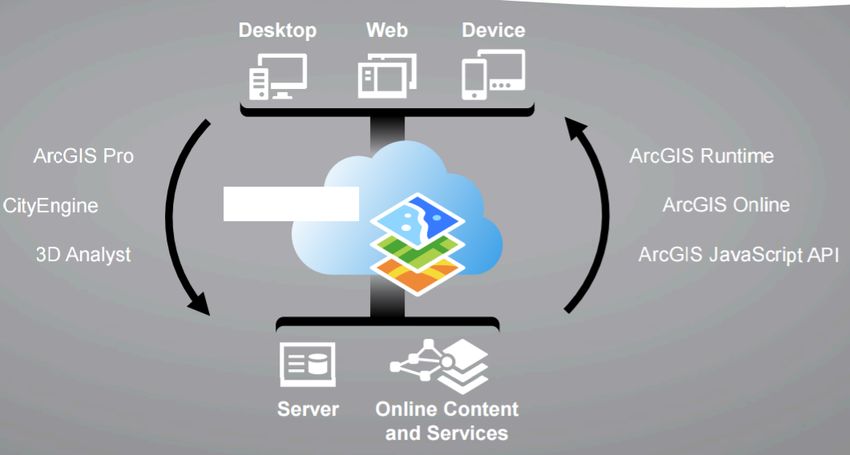
There are a few Web GIS client applications enabling parallel computations on client machine, based on
graphics card. Only some plug-in like Silverlight is needed. Development of Internet technology like HTML5
and WebGL constitutes great basis for building even better Web GIS applications.

1.1 WebGL
WebGL is multi-platform, free web standard enabling the access to 3D graphics interface and constitutes an
extension of JavaScript capabilities. It is based on OpenGL ES 2.0, a library dedicated to mobile devices (like
phones), so WebGL provides similar functionalities and performs well on modern graphics hardware. It is
designed and maintained by Khronos Group (non-profit).

Main producers of web browsers, like Apple (Safari) or Google (Chrome) are members of WebGL Working
Group (WebGL 2017). WebGL code uses Canvas element of HTML5. It gives web browsers the access to GPU
on computers where they are used. WebGL allows displaying 2D and 3D graphics without any plugins, directly
in browser. All modern devices and browsers support WebGL.

WebGL works thanks to parallel computing by modern graphics cards (GPU), using standard web browser
supporting WebGL. It makes displaying the results of GIS analysis much more faster and more efficient.
WebGL was used for example by ESRI in CityEngine Web Viewer to present 3D objects and by Google in their
new Google Maps.

There is for instance WebGL Earth – open-source JavaScript framework for creating 3D GIS applications. It is
virtual globe created thanks to HTML5 and Canvas WebGL technology. At the beginning of the script WebGL
Earth API should be loaded and then codes generating the scene (WebGLEarth 2017).

    1.2 Geoweb3D
Geoweb3D (Geoweb3d, 2017) is a stand-alone application designed by GeoWeb3D company (Binghamton
NY). The aim of the authors was to combine advanced GIS with web and to create a GIS - oriented product.
An user can integrate, analyze and visualize the data, what is not possible in other products on market.
Geoweb3D company offers also Geoweb3D SDK (Software Development Kit).

To use Geoweb3D one has to install the software on computer. It is possible to download trial version for 14
days. On the producer’s website there is no information about sharing 3D scenes in the Internet. In general,
the built-in browser allows the user to download data from the Internet and use it in Geoweb3D. On
producer’s website one can find brief tutorial of working in the software, but there is not any advice how to
load own models. Geoweb3D is intuitive and there is no need to have any experience with 3D modeling.
Below there are some advantages of software presented:
    • the interface is simple and contextual,
    • Geoweb3d has direct support for commonly used raster and vector GIS formats, there is no need for
        pre-processing,
    • built-in web browser allows interoperability with cloud and mapping applications ( Google Maps,
        Google Earth, ArcGIS online, etc.),
    • there is ArcGIS engine built-in (in case of valid ESRI license on the computer, there are some
        possibilities, for example loading, editing MXD files and loading vector data from geodatabase)
    • user can save and restore the project using a non-proprietary xml format (.g3proj),
    • loading raster data in many formats (JPEG, GeoTIFF, ArcInfo ASCII Grid, ArcInfo Binary Grid, Erdas
        Imagine, Idrisi Raster, SRTM HGT, PCI *.aux Labeled, Intergraph Raster, etc.),

                                                                                                   Page 2 of 12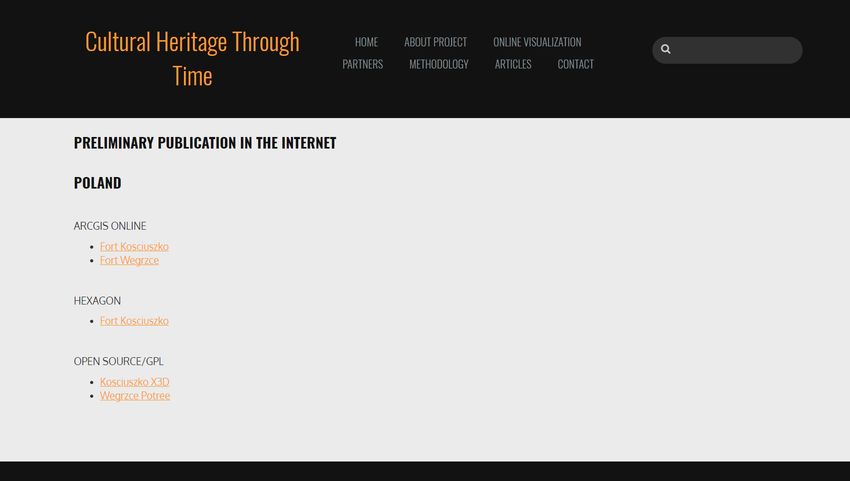
•   loading vector data in many formats (Shapefile, Personal Geodatabase, File Geodatabase, GeoJSON,
        GML, DGN, TopScene XMDL, etc.) and also creating vector data,
    •   loading and rendering huge amount of point cloud data and combining them with different GIS data
        (using the newest GPU technology),
    •   loading LIDAR data (ALS, TLS, Mobile) in *.las format without preprocessing, there are some tools
        allowing measurements and performing visibility analysis (also on LIDAR data),
    •   loading 3D models (OpenFlight *.flt, 3D Studio *.3ds, Collada *.dae, Direct-X *.x, Alias Wavefront
        *.obj, Lightwave *.lwo, AutoCAD DXF *.dxf, AutoDesk FBX *.fbx, OSG *.osg, *.ive),
    •   attractive (game quality) visualization; shading, clouds,
    •   date and time settings allow to get the Sun position and realistic lighting,
    •   creating alternative visualizations in the same location and changing views,
    •   icons and labels as an additional way of visualization; they can keep some attributes or html contents
        like websites etc.,
    •   adding *.kml files with cities markers,
    •   loading thematic maps from WMS (Web Map Service), TMS (Tile Map Service) and ArcGIS Server
        REST Service,
    •   user can add photos or videos in the scene
System requirements:
    • Microsoft Windows XP SP3 or newer
    •   Video Card Supporting OpenGL 3.3 – NVIDIA GeForce 8, 9, 100-600 series – Most NVIDIA Quadro
        cards – AMD Radeon HD series – AMD Firepro

    •   Up-to-date graphics drivers

    •   Recommended Hardware:
    •   GeForce 460+ or Quadro 4000+
    •   64-bit Windows XP, Vista, or 7

    •   3+ GB RAM
To provide the best possible visualization and analysis Geoweb3D use the newest graphics cards technology.

1.3 Cesiumjs
Cesiumjs (CESIUM 2017) is an open-source JavaScript library, on Apache 2.0 license, for 3D maps. One can
download the application, which starts with node.js support. On the platform there are many demo versions
which allow to analyze the data and tools. Both 3D models and maps can be visualized.
To carry out the implementation, in text editor an appropriate Java code should be placed. Next, created file
can be saved as *.html and run by web browser. Satellite maps used by Cesius come from Bing Maps service
and have good quality. On the library’s website there is full documentation, many tutorials (CESIUM Tutorials
2017) divided into categories. Some instruction films about working in this environment are available on
Youtube. There are also some examples of codes and scripts published, which should be used to visualize
specific situation. It is very convenient. Moreover, there is a forum where users can share their knowledge
and help each other.

To sum up, Cesium initially seems to be very functional but complicated. However, easy access to
documentation, video tutorials, courses and scripts is great facilitator for work in this tool.

                                                                                                  Page 3 of 12
1.4 Free GIS software
Website (GISGeography 2017) contains a list of 13 freeware GIS software:
• QGIS,
• gVSIG,
• Whitebox GAT,
• SAGA GIS,
• GRASS GIS,
• MapWindow,
• ILWIS,
• GeoDa,
• uDig,
• OpenJump,
• Diva GIS,
• FalconView,
• OrbisGIS.
Unfortunately, during analysis of the mentioned software packages, it turned out that work with them may
be hard or even impossible. There were two essential problems identified:
• some of the programs have too low functionality for our needs, which could not allow us to realize
our aim
• no tutorials were found to softwares which initially seems to be useful, furthermore, there are only
a few poor videos on Youtube describing their operation.
1.5 GeoBrowser3D
GeoBrowser3D is a platform allowing browsing, adding own maps, vector graphics, surface models and 3D
objects. It also allows to carry out analysis what supports decisions making (GeoBrowser 3D, 2017,
GeoBrowser 3D Overwiev, 2017, GeoBrowser 3D Development Libraries, 2017). For this purpose WebGL is
used, which aenables to effectively render selected basic maps or 3D surface objects on the globe, wthout
any quantity limitations. Moreover, GeoBrowser 3D offers compatible solutions with OGC standards (WMS,
WFS, WFS-T, OpenLS, SOS, CityGML) for 3D visualization.
The platform is available both for computers and mobile devices with iOS and Android systems. Producer
provides also an access to GeoBrowser3D server and therefore data can be sent to clients and other users
seamlessly. DSM and DTM data can be uploaded to the server in most common file formats: BIL, TMS and so
called Quantized Mesh. All geodata can be created and sent on-the-fly to save disk space. As the background
for 3D objects GIS data are used in GeoTIFF and ASCII Grid formats. The portal is very functional and easy to
use. There are simple tools available for 3D navigating, the portal content browsing and view modes
changing.
The authors of the portal provided a possibility to manage different types of data, both standard GIS materials
and big satellite datasets. It is possible to upload to the platform raster and vector (SHP, WFS, WFS-T) data,
and also KML/KMZ Google Earth datasets. What is important, there is a possibility to visualize 3D objects.
Even big urban areas can be uploaded to the platform GeoBrowser3D, they just have to be based on CityGML
(City Geography Markup Language). It seems unique to render and navigate through point clouds, even up
to 200 million of points in real time. Overview of the functionalities is included in series of videos
(GeoBrowser 3D youtube, 2017).
Page 4 of 12There are very attractive effects of visualization available. There is a possibility to set shadow depending on
Sun location at specific geography latitude, on specific day of the year. User can also apply clouds or even
storm over the scene. GeoBrowser3D offers uploading photos acquired from UAV with geolocation. Sharing
UAV flight records and route of the flight makes visualization more interesting. GeoBrowser3D provides 3D
geodata not only for GIS users but also for computer games creators (PNG and RAW files).
There were not found any tutorials describing conditions which have to be fulfilled to publish data on
GeoWeb3D platform.
1.6 3D ArcGIS API for JavaScript
Visualization of spatial data can be performed with or without coding. To prepare 2D/3D map and publish it
on the web one can use only ESRI platform (ArcGIS 2017). After creating an account on ESRI website, user
can create webmaps and generate a link which allows the others upload the scene and watch it. For greater
control over visualization there is a possibility to use ArcGIS API for JavaScript created by ESRI.
On the website (Udemy 2017) there is a course developed by Alfred Lam. The course contains only basics of
data visualization by means of JavaScript (tutorials are located on YouTube). The author provides files with
already written codes to scripts. Only a text editor and a browser are needed. The course shows that in text
editor should be included an appropriate Java code and the file should be saved as *.html. Then, the file is
supposed to be open in browser where scenes can be displayed.
Generally, displayed contents is based on ESRI resources (topographic maps, satellite maps, etc.). The codes
in scripts refer exactly to these data. Among provided codes there is a link for ArcGIS API uploading (beta
version) and there are modules and functions allowing to manipulate the view (adding buttons and their
styles, etc.). There are many functionalities, for example, after adding to the script the code with geolocation
mark, the user can at once watch the map in appropriate place. The author of the course recommends 3D
AcrGIS API for JavaScript because he found it as versatile solution, allowing for instance “story telling” or
adding own maps.
2. Tested approach
2.1 ArcGIS
Workflow for 3D Web Scenes using ArcGIS with ArcScene, ArcGIS Pro, in Scene Viewer, in Storymap Map
Journal Template Usage was shortly presented in 2016 Esri Federal GIS Conference Proceedings (Hoak 2016
a). “The input for Export Web Map is a piece of text in JavaScript object notation (JSON) format describing
the layers, graphics, and other settings in the web map. The JSON must be structured according to the the
ExportWebMap specification topic found in the ArcGIS Help. This tool is shipped with ArcGIS Server to
support web services for printing, including the preconfigured service named PrintingTools. The ArcGIS web
APIs for JavaScript, Flex, and Silverlight use the Printing Tools service to generate images for effortless map
printing. For advanced printing scenarios, for example, swapping out service layers with local vector data,
creating map books, and so on, you do not use Export Web Map at all; rather, you can use the
ConvertWebMapToMapDocument() function in the Python arcpy.mapping module included with ArcGIS. To
make your Python script available to a web application, one can expose the script through an ArcGIS Server
geoprocessing service. For more information, one can see Printing in web applications in the ArcGIS Server
help. A JSON representation of the state of the map to be exported as it appears in the web application. One
can see the ExportWebMap specification to understand how this text should be formatted. The ArcGIS web
APIs (for JavaScript, Flex, Silverlight, and so on) allow developers to easily get this JSON string from the map”
Page 5 of 12(ArcGIS 2017). 3D across the platform, complete workflow for editing, managing, publishing and sharing data
in 3D are in 6 presented.
3D across the Esri product family is as following (Hoak B. 2016 b):
• “ArGIS Pro – powerful 2D/3D desktop authoring and data management
• 3D Analyst – rich analysis for advanced 3D workflow
• CityEngine – advanced edting tool for Urban Designers
• ArcGIS for Server – scalable 2D/3D enterprise content distribution and geoprocessing
• ArcGIS Online – content and services for sharing ideas in 2D and 3D
• ArcGIS Earth – easy-to-use 3D data exploration
• ArGIS Runtime – developer tools for 2D and 3 3D custom solutions
• ArcGIS Marketplace - 3rd party geospatial apps and data for the enterprise.”
The technology supports different properties:
• layer types: feature layers (point, line, polygon ad multipatch including layer extrusion or 3D
symbology), raster layer, TIN layer
• ArcScene documents properties: scene coordinate system, Area of Interest (AOI), bookmarks, group
layers, vertical exaggeration
Figure 1 - 3D across the platform, complete workflow for editing, managing, publishing and sharing data in 3D, Hoak B.
2016 b.
2.2 Hexagon
Hexagon Geospatial has two leading products Hexagon Smart M.App and Power Portfolio (Hexagon Power
Portfolio, 2016). Power Portfolio deals with the organization of Hexagon Geospatial products into specific
product lines by combining the best available photogrammetric, remote sensing, GIS and cartographic
technologies. These product lines are Producer, Provider and Platform.
The Platform Suite allows for delivering information over the Internet, or using mobile (smartphones,
Android phones) or other smart solutions. It is possible to build and extend your own geospatial applications
Page 6 of 12and solutions through the use of more sophisticated technology. This line includes products from the WebGIS
solution family: GEOMEDIA® WEBMAP, GEOSPATIAL PORTAL and GEOSPATIAL SDI. Geospatial SDI extends
GEOMEDIA® WEBMAP services using the CSW (Catalog Service for the Web) standards. This type of site is
the primary tool for exploring, accessing, maintaining, and organizing geospatial metadata catalogs that
describe data and relationships.
Geospatial SDI (Spatial Data Infrastructure), is an interoperable data infrastructure designed for data
providers that must effectively manage, securely transfer, and license their data to clients based on Web
services standards (Hexagon Geospatial SDI Brochure, 2016). Geospatial SDI complies with the OGC
(Enhanced Open Geospatial Consortium) standards; consumer services such as WMS, WFS and WMTS are
directed directly to the portal user providing the highest operational level), INSPIRE (Infrastructure for Spatial
Information in Europe), and ISO (International Standards Organization) for web services and metadata
compatibility.
Geospatial SDI is used to catalog and deliver geospatial data to customers through the network. It provides
excellent tools for monitoring of service compliance with standards, monitoring of shared data, as well as for
monitoring and reporting of data service activities. So, a solid tools and detailed instructions are very good
suport for users, and an open development environment that allows them to build web and mobile solutions.
The Web service administration console provides tools for creating and configuring platform functionality.
The Geospatial SDI allows for the management and monitoring of geospatial data published on the geospatial
data platform, as well as log-in by other users and reporting of the measurements being made there. The
service allows you to connect to existing databases in order to avoid duplication and maintenance of
repeated information.
Geospatial SDI, as it is an extension of Geospatial PORTAL, offers the same functionality. Working on
geospatial data from anywhere and at any time is also possible by customizing the site to work on mobile
devices as applications available on iOS, Android, and mobile Windows platforms. Moreover, geo-data can
be displayed in 3D in a very realistic way by introducing shadow options that change according to the location
of the sun at a specific time of day on a given day of the year. 3D objects need not only be located on the
surface of a terrain, but also below it. There is an option to change visibility for underground objects. The
Portal also has a perspective view of the person, allowing you to feel like you are in the real world by browsing
virtual 3D cities. The browser uses WebGL by default (the ERDAS APOLLO ECW 3D plugin can be used
interchangeably), that is, the map underlay is displayed on a three-dimensional globe, and the remaining 3D
objects are rendered on the surface depending on whether or not it is necessary. These options do not
require additional configuration, they are provided as standard. So in addition to the traditional 2D map
display, you can view and edit 3D data. With the WFS-T service, it is now possible to edit the attributes of
individual objects already on the data server.
Hexagon Geospatial provides detailed and up-to-date documentation on all aspects of working with their
products in a simple and trouble-free way. In addition, Quick Guide composed of several tutorials "from A to
Z". Free guides guide beginners through the process of creating the world's most popular WebMap services.
As for the technical requirements to be met, see the System Requirements Geospatial (SDI Hexagon WebGIS
Guide, 2016).
Page 7 of 122.3 Open Source
Open Source software testing included approach for 3D model web presentation and point clouds sharing.
For 3D model presentation model technology initialy based on HTML5 was applied: Cobweb X3D browser.
Cobweb X3D Browser "Cobweb is a new X3D Browser engine entirely written in JavaScript and uses WebGL
for 3D rendering. Authors can publish X3D source within an HTML5 page with Cobweb that works with Web
browsers without prior plugin installation. This gives X3D authors the ability to displays content in 3D, using
WebGL 3D graphics technology to display X3D content in several different browsers across several different
operating systems. Cobweb supports custom shaders, clip planes, reflection mapping, script nodes,
prototyping capabilities and event driven programming to provide you with an improved quality level of
virtual effects and tools ready for the Internet. “, (X3D VRML WebGL, 2017 Cobweb 2017).
Lastly Cobweb an X3D player is now X_ITE (Cobweb X_ITE, 2017). X_ITE implements a high-performance X3D
player in open-source JavaScript. Authors can publish X3D source within an HTML5 page that works in
modern Web browsers without prior plugin installation.
For point clouds Internet presentation Portree was applied. Potree is a free open-source WebGL based point
cloud renderer for large point clouds, developed at the Institute of Computer Graphics and Algorithms, TU
Wien (Potree 2017).
3. Web sharing – Krakow fortress example
Initial tests included comparison of 2 commercial solutions: Esri and Hexagon and one Open-Source. On the
web site (AGH CHt2 Home 2017, Error! Bookmark not defined.), which is under construction, few details can
be found. The main aim was to compare 3 technologies described shortly in chapter 2. The examples of online
visualization are performed on the 2 objects: Fort Kosciuszko and Fort Wegrzce (Error! Bookmark not
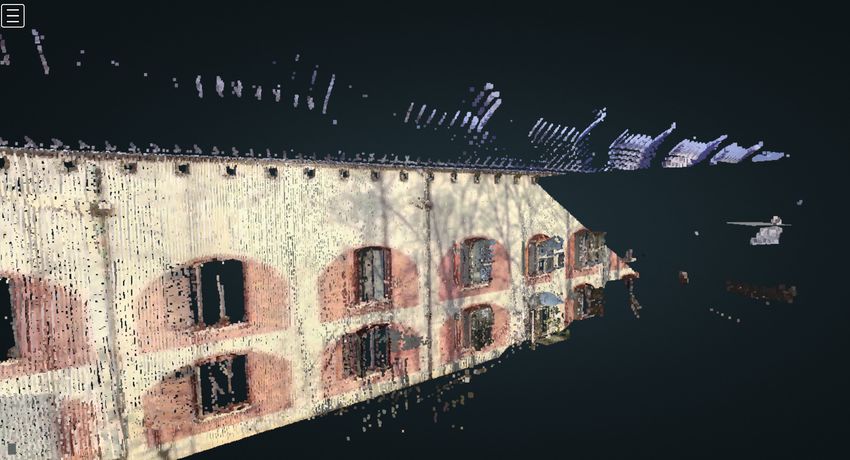
defined.). New 3D model from UAV optic images are published (9). On the other hand the 3 D historical
model, prepared from archive documents is presented in Hexagon and X3D technology. Besides one example
of point cloud presentation, using other example: Wegrzce Fort was in Potree technology shown (10).
Figure 2 - Test project web site – Home (AGH CHt2 Home, 2017).
Page 8 of 12Figure 3 - Test project web site – Online Visualization (AGH CHt2 Home, 2017).
Figure 4 - Test project web site – ArcGIS online – Fort Kosciuszko (AGH CHt2 Home, 2017)
Page 9 of 12Figure 5 - Test project web site – Potree point cloud – Fort Wegrzce (AGH CHt2 Home, 2017)
4. Conclusions
After the test phase of the research the following conclusions can be drawn:
1. Esri technology is user friendly, many tools for web sharing are available.
2. Hexagon provides solutions for automatic geometry simplification, some problems with texturing were
observed.
3. Open-source methods seems to be very promising but there are also problems with texturing.
The work in this area is expected to yield results that will allow for the ultimate choice of 3D data sharing and
technology on the Internet for all partner’ test areas.
Page 10 of 135. Literature
6. Geospatial World, 2017 - A new framework for 3D Web GIS,
https://www.geospatialworld.net/article/a-new-framework-for-3d-web-gis-applications/
7. WebGL, 2017 - OpenGL ES for the Web, https://www.khronos.org/webgl/
8. WeBGLEarth, 2017 - WebGL Earth JavaScript API, http://www.webglearth.org
9. Software framework, 2017 - https://en.wikipedia.org/wiki/Software_framework
10. Geoweb3d, 2017 - Advancing Visualization, http://www.geoweb3d.com
11. CESIUM, 2017 – An open-source JavaScript library for world-class 3D globes and maps,
https://cesiumjs.org/index.html
12. CESIUM Tutorials, 2017 - https://cesiumjs.org/tutorials.html
13. GISGeography 2017 - 13 Free GIS Software Options: Map the World in Open Source,
http://gisgeography.com/free-gis-software/
14. GraphiTech, 2017 - http://www.graphitech.it/
15. GeoBrowser 3D, 2017 – The power of 3D GIS tools in your browser, http://geobrowser3d.com/
16. GeoBrowser 3D youtube, 2017
https://www.youtube.com/watch?v=rFwXnFZOspc&list=PLlB_rfTJJP4RwaNA8D1jlpiTMEKFfGEjn
17. GeoBrowser 3D Overwiev, 2017 - http://www.geobrowser3d.com/documents/GeoBrowser3D.pdf
18. GeoBrowser 3D Development Libraries, 2017 - http://www.graphitech.it/48-our-role-in-the-
market/software-facilities
19. Hoak B. 2016 b – Workflows for 3D Web Scene
http://proceedings.esri.com/library/userconf/fed16/papers/fed_05.pdf , 2016 Esri Federal GIS
Conference Proceedings
20. Hoak B. 2016 c – Working in 3D with ArcGIS Pro
http://proceedings.esri.com/library/userconf/fed16/papers/fed_06.pdf , 2016 Esri Federal GIS
Conference Proceedings
21. ArcGIS 2017 – Export Web Map, http://desktop.arcgis.com/en/arcmap/10.3/tools/server-
toolbox/export-web-map.htm
22. Hexagon Power Portfolio, 2016 - http://www.hexagongeospatial.com/products/power-portfolio
23. Hexagon WebGIS Products, 2016 - http://www.hexagongeospatial.com/products/power-
portfolio/geospatial-portal/2016-product-release-details
24. Hexagon Geospatial SDI Brochure, 2016 - http://www.hexagongeospatial.com/brochure-
pages/geospatial-sdi-brochure
25. Hexagon WebGIS Guide, 2016 http://www.hexagongeospatial.com/technical-documents/release-
guides-2016/webgis-2016-release-guide
26. Hexagon AGH, 2017 - http://sdidemo.intergraph.pl/AGH_CP/#
27. X3D VRML WebGL, 2017 - X3D/VRML players - Web3D browsers - 3D engines - VRML plugins,
http://www.vrinternal.com/docs/links.html
28. Cobweb, 2017 - https://github.com/create3000/cobweb
29. Cobweb X_ITE, 2017 - http://www.web3d.org/news-story/cobweb-now-xite
30. Potree, 2017 - Potree is a free open-source WebG, http://www.potree.org/index.html
31. AGH CHt2 Home, 2017 - https://twiki.fotogrametria.agh.edu.pl/cht2/
Page 11 of 12You can also read