Institutional Presentation - 2Q19 - Amazon S3
←
→
Page content transcription
If your browser does not render page correctly, please read the page content below

| Apresentação do Roadshow
 Institutional Presentation
                             2Q19

                                    1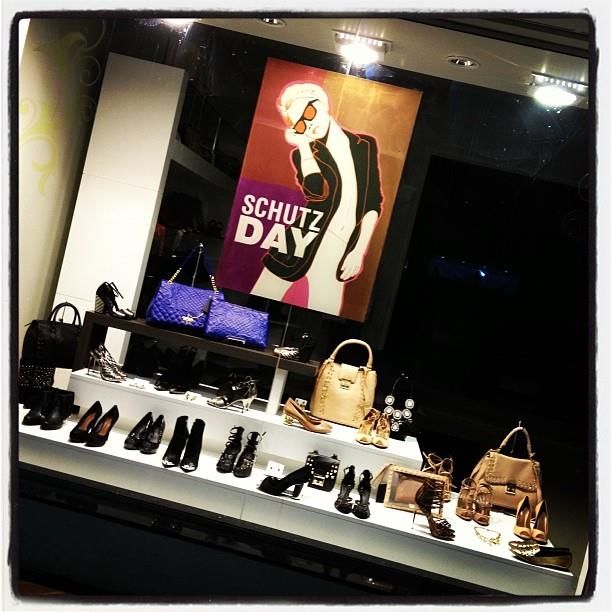
Disclaimer
Statements regarding the Company’s future business perspectives and projections of operational and
financial results are merely estimates and projections, and as such they are subject to different risks and
uncertainties, including, but not limited to, market conditions, domestic and foreign performance in general
and in the Company’s line of business.
These risks and uncertainties cannot be controlled or sufficiently predicted by the Company management
and may significantly affect its perspectives, estimates, and projections. Statements on future
perspectives, estimates, and projections do not represent and should not be construed as a guarantee of
performance. The operational information contained herein, as well as information not directly derived from
the financial statements, have not been subject to a special review by the Company’s independent
auditors and may involve premises and estimates adopted by the management.

                                                                                                               2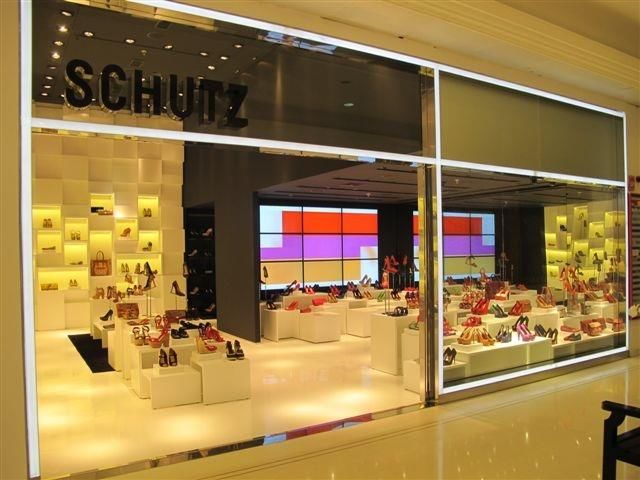
| COMPANY OVERVIEW
1    Platform of brands of reference

Arezzo&Co is the leading Company in the footwear, handbags and accessories
industry through its platform of Top of Mind brands

                                                                             4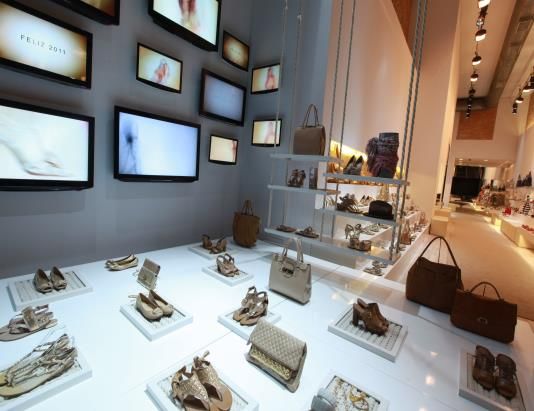
1
                  Company overview

Arezzo&Co is the reference in the Brazilian retail sector and has a unique positioning combining
growth with high cash generation

     Leading company
       in the footwear                                                              Development of
      and accessories                          Controlling                                                        Asset light: high            Strong cash
                                                                                    collections with
        industry with                      shareholders are                                                         operational               generation and
                                                                                    efficient supply
       presence in all                      reference in the                                                         efficiency                high growth
                                                                                          chain
      Brazilian states                           sector

 13.5 million pairs of shoes (1)          More than 47 years of                    ~11,500 models created       90,3% outsourced            Net revenues CAGR:
                                          experience in the sector                 per year                     production                  9.7% (2014 - 2018)
 1.5 million handbags (1)
                                          Wide recognition                         Average lead time of 40      ROIC of 27.7% in 2Q19 (3)   Net Profit CAGR: 6.1%
 More than 3,000 points of                                                         days                                                     (2014 - 2018 )
 sale                                                                                                           2,515 employees
                                                                                   15 to 18 launches per year                               Increased operating
 ~12% total market share and                                                                                                                leverage
 ~28% market share on AB
 classes
1.    As of 2018
2.    Refers to the Brazilian women footwear market (source: Company estimates).
3.    Results excluding the adoption of IFRS 16 / CPC 06 (R2)                                                                                                       5
1
                 Successful track record of
                 entrepreneurship
The right changes at the right time accelerated the Company's development

    FOUNDATION AND
                                       INDUSTRIAL ERA                   RETAIL ERA                  CORPORATE ERA                 INDUSTRY REFERENCE
     STRUCTURING
              70’s                             80’s                          90’s                             00’s                        2011 - 2019
Founded in 1972                   Consolidation of industrial   Focus on retail                 Specific brands for each
Focused on brand and product      business model located in     R&D and production              segment
                                  Minas Gerais                                                                                           CONSOLIDATE
                                                                outsourcing on Vale dos Sinos   Expansion of distribution             LEADERSHIP POSITION
                                  1.5 mm pairs per year         - RS                            channels
                                  and 2,000 employees           Franchises expansion            Efficient supply chain

                                                                                                Launch of new brands              International expansion
Opening of the first                                                                                                              9 owned stores in us
shoe factory

First store                                                     Opening of the flagship
                                                                store at Oscar Freire           Merger
Launch of the first design with
national success                                                                                                +

                                                                                                Strategic Partnership
                                                                                                (November 2007)
                                                                                                                                  Launch of new brands
                                                                Schutz launch

                                                                Commercial operations
                                                                centralized in São Paulo
                                                                                                  Initial Public Offering (IPO)
                                                                Fast Fashion concept                      February 2011

                                                                                                                                                            6
1
         Shareholder Structure

                                                                        Others                                  Aberdeen      Management³
                                                            44.6%                                      4.6%                 0.0%

                                           Birman Family                                                            Float
                                       50.8%                                                           49.2%

1.   Arezzo&Co capital stock is composed of 90.954.280 common shares, all nominative, book-entry shares with no par value
2.   Shareholder structure as of August 05th, 2019
3.   Includes LTI plan
                                                                                                                                            7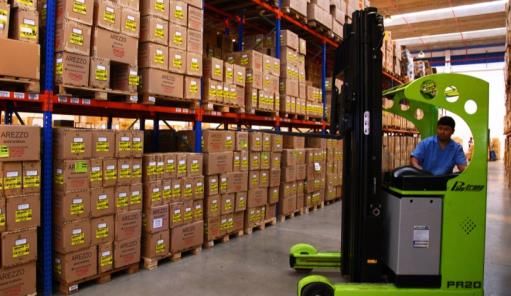
1
                  Strong platform of brands

Strong platform of brands, aimed at specific target markets, enables the Company to capture
growth from different income segments

                                            1972                                                    1995                                                 2008

                                        TRENDY                                                 FASHION                                                  POP
                                         NEW                                                  UP TO DATE                                            FLAT SHOES
                                      EASY TO USE                                                BOLD                                               AFFORDABLE
                                        ECLETIC                                              PROVOCATIVE                                             COLORFUL

                                      16 – 60 YEARS                                          18 – 40 YEARS                                          12 – 60 YEARS

                            CHANNELS AND % REVENUE                                 CHANNELS AND % REVENUE                                  CHANNELS AND % REVENUE
                              O    F     MB    EX                                    O    F     MB    EX                                     O    F     MB    EX
                              14  406   1,219 127                                    17   73   1,094 138                                     3   157   1,569 124
                             12%  65%   13%    2%                                   20%  18%   26%   25%                                    5%   50%   37%    1%

                                WEB GROSS REVENUE                                      WEB GROSS REVENUE                                         WEB GROSS REVENUE
                                  R$ 85.8 MM (8%)                                        R$ 68.9 MM (11%)                                          R$ 15.6 MM (7%)

                                 RETAIL PRICE POINT                                      RETAIL PRICE POINT                                      RETAIL PRICE POINT
                                   R$ 240.00 / PAIR                                        R$ 380.00 / PAIR                                        R$ 140.00 / PAIR

                                   GROSS REVENUE                                           GROSS REVENUE                                           GROSS REVENUE
                                  R$ 977.1 MM (50.1%)                                     R$ 604.1 MM (30.9%)                                     R$ 239.3 MM (12.2%)
Notes:
1.   Points of sales (LTM); O = Owned Stores; F = Franchised Stores; MB = Multi-brand Stores; EX = Exports (including US and ROW wholesalers).
2.   % of each brand gross revenues (LTM) does not include other revenues (not generated by any of the 6 brands).
3.   Gross revenues LTM, including external market; does not include other revenues (not generated by any of the 6 brands).                                             8
4.   % of Company’s total gross revenues of LTM.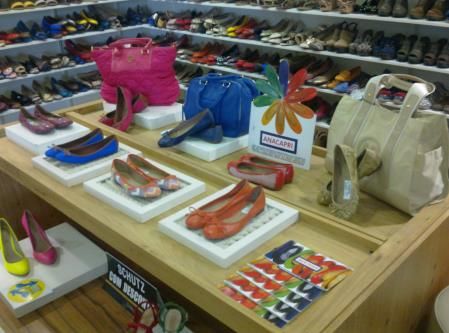
1
                  Strong platform of brands

Strong platform of brands, aimed at specific target markets, enables the Company to capture
growth from different income segments

                                            2009                                                    2015                                                2018

                                        DESIGN                                                   CASUAL                                              COMFORT
                                      EXCLUSIVITY                                                YOUNG                                               WELLNESS
                                       IDENTITY                                                   URBAN                                               BEAUTY
                                      SEDUCTION                                                  MODERN                                              SELF CARE

                                      20 – 45 YEARS                                          15 – 30 YEARS                                          30 – 60 YEARS

                             CHANNELS AND % REVENUE                                 CHANNELS       AND % REVENUE                           CHANNELS     AND % REVENUE
                                P      MM      EX                                      P            MM      EX                                P          MM      EX
                                4      26      47                                      5            427     23                                2          292     95
                               29%     5%     62%                                     40%          48%      0%                               30%        55%      1%

                                WEB GROSS REVENUE                                      WEB GROSS REVENUE                                         WEB GROSS REVENUE
                                   R$ 3.6 MM (4%)                                        R$ 3.7 MM (12%)                                           R$ 1.9 MM (14%)

                                 RETAIL PRICE POINT                                      RETAIL PRICE POINT                                      RETAIL PRICE POINT
                                  R$ 1,500.00 / PAIR                                       R$ 320.00 / PAIR                                        R$ 230.00 / PAIR

                                    GROSS REVENUE                                          GROSS REVENUE                                          GROSS REVENUE
                                    R$ 90.7 MM (4.6%)                                      R$ 30.3 MM (1.5%)                                      R$ 13.4 MM (0.7%)
Notes:
1.   Points of sales (LTM); O = Owned Stores; F = Franchised Stores; MB = Multi-brand Stores; EX = Exports (including US and ROW wholesalers).
2.   % of each brand gross revenues (LTM) does not include other revenues (not generated by any of the 6 brands).
3.   Gross revenues LTM, including external market; does not include other revenues (not generated by any of the 6 brands).                                             9
4.   % of Company’s total gross revenues of LTM.
1
                Multiple distribution channels

Flexible platform through different distribution channels with specific
strategies, maximizing the Company's profitability
                                                                                         NUMBER OF STORES – DOMESTIC MARKET 2Q19
                                                       2,621             Broad
636 franchises                                                                                          FRANCHISE____________406
                               45 owned             multibrand¹       distribution
 in more than                                                                                           OWNED STORE__________14
                               stores in             clients in         network
  250 cities in                                                                                         MULTIBRAND____________1.219
                                 Brazil             more than         throughout
     Brazil
                                                    1,361 cities         Brazil
                                                                                                        FRANCHISE____________73
                                                                                                        OWNED STORE__________17

                                                                                                        MULTIBRAND____________1.094
                Gross Revenue Breakdown by Channel2 – (R$ mm)
   44,0%             20,4%             14,7%        9,2%       0,1%   11,7%     100,0%
                                                                                                       FRANCHISE____________157
                                                                                                       OWNED STORE__________3
                                                                                1.921                  MULTIBRAND___________1.569

                                                                                                        OWNED STORE__________4

                                                                                                        MULTIBRAND___________26

                                                                                                        OWNED STORE__________5

                                                                                                        MULTIBRAND___________427

 Notas:                                                                                                OWNED STORE__________2
 1. Without store overlap between brands
 2. LTM                                                                                                MULTIBRAND____________292
 3. Domestic Market – multibrand without overlap.                                                                                     10
| BUSINESS MODEL
2
        Unique business model in Brazil

                Customer focus: we are at the forefront of
                  Brazilian women fashion and design

1             2                  3                       4                  5
                                                         NATIONWIDE         SEASONED
ABILITY TO    SOLID MARKETING    EFFICIENT                                  MANAGEMENT
                                                         DISTRIBUTION
INNOVATE      AND                SUPPLY CHAIN                               TEAM WITH
                                                         STRATEGY
              COMMUNICATION                                                 PERFORMANCE
              PROGRAM                                                       BASED INCENTIVES

               Communication &
      R&D                         Sourcing & Logistics      Multi-channel      Management
                  Marketing

                                 BRANDS OF REFERENCE

                                                                                            12
2
Ability to Innovate
We develop 15 to 18 collections per year
I. Research II. Development III. Sourcing IV. Store Delivery
Creation:
11,500 SKUs / year
Available for
selection:
63% of SKUs created /
year
Stores:
52% of SKUs created /
year
Activities JAN FEV MAR APR MAY JUN JUL AUG SEP OCT NOV DEC
Creation
Launch
Orders
Production
Delivery
Normal sale
Discount sale
Winter I Winter II Winter III Summer I Summer II Summer III Summer IV
Arezzo&Co delivers on average 5 new models at the stores per day, allowing for consistent desire-
driven purchases 132
Broad Media Plan
Each brand has an integrated and expressive communication strategy, from the creation of
campaigns to the point of sale
STRONG PRESENCE IN SOCIAL, DIGITAL AND PRINT MEDIA LIVE MARKETING AND EXPERIENCE AT POINT OF SALE
OVER 12 MILLION FOLLOWERS CUSTOMER ACTIVATION THROUGH FASHION AND
OVER 4 MILLION MONTHLY WEBSITE ACCESS LIFESTYLE EVENTS
DIGITAL COMMUNICATION PUBLIC RELATIONS
INTERNATIONAL CELEBRITIES ENDORSEMENT AND
CUSTOMIZED CONTENT FOR DIFFERENT CLIENTS STRONG PRESENCE IN THE PRESS
142
Communication & Marketing Program
reflected in every aspect of the stores
Stores are constantly changed to incorporate the concept of each new collection, resulting in a
higher level of desire-driven purchases
POS materials (catalogs, packaging, and others)
Store layout & visual merchandising Flagship stores
All visual communication at stores is monitored and updated simultaneously throughout Brazil
15
for each new collection2
Store atmosphere: differentiated concepts
for each brand
Shelves, Niches and Suspended shelves New Store Concept Wall display
Increased number of displayed items
New store concept being tested in flagship stores Display of a large variety of products
Products highlighted in the center of the stores
New digital experience: mobile check-out, RFID mirror Inventory at the sales area: lower necessity of
Favorable lighting project
and touch-screen TV additional space for storage
Distribution of the furniture provides more comfort to the
Expected roll out for 2018/19
customers
Each theme is disposed in different niches Experimental and creative Wellness and style
Atmosphere of a jewelry store Focus on wellness (comfort and style)
Experimental and creative space
Private shop experience Timeless concept
Interaction with the customer
Focus on exclusivity, design and high quality
Collaborative experience
materials
162
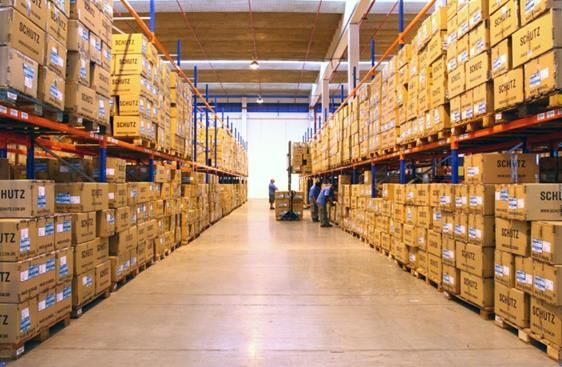
Flexible Production Process
Production speed, flexibility and scalability to ensure Arezzo&Co’s expected growth based on
asset light model
Sourcing Model Gains of scale
Arezzo’s scale and structure gives flexibility to source a large number
Owned factory with capacity to produce 1,1mm pairs annually and a
strong relationship with Vale dos Sinos production cluster as the of SKU’s from various factories on a short time frame at competitive
main outsourcing region prices
Certification and auditing of suppliers Joint purchases
In-house certification and auditing ensure quality and punctuality Coordination of material purchase jointly with shoe, handbag and
(ISO 9001 certification in 2008) accessories’ suppliers
New Distribution Center – Espirito Santo State Sourcing model – 90% of production outsourced¹
10%
Arezzo&Co Owned Factories
90% Others
Consolidation and improvement of distribution in
national scale
1 Reception: 100,000 units/day
2 Storage: 100,000 units/day
3 Picking: 150,000 units/day
4 Distribution: 200,000 units/day
172
Operation composed by flagship stores in
key Brazilian locations
Owned stores are key to develop retail know-how and increase brands’ visibility
Flagship Stores Greater brand awareness coupled with operational efficiencies
Owned stores are larger and more productive than average and
are located in key cities of Brazil (mainly SP and RJ)
The direct customer interaction enables the development of retail
capabilities, which are also reflected at franchised stores
Arezzo – Iguatemi / SP
Anacapri – Oscar Freire/ SP
Average Annual Sales per Store LTM (R$ MM)
Fiever – Oscar Freire/ SP
Franchises 1,3
Owned Stores 6,6
Schutz – Iguatemi/ SP Alme – Oscar Freire/ SP
182
Strong focus on performance in both
owned and franchised stores
Structure applied to retail in order to achieve better sales and margin results as well as to
integrate and connect all monobrand stores’ back office
Strong focus on franchise and owned store performance
• All sales team (4,000+ people) get connected through national internet broadcast for three sales conventions per
year, creating an aligned sales pitch and a great sense of motivation before each season
• Large service program to assist franchisees on sales and profitability goals
• Recurring training programs in products, fashion trends, sales techniques, store management, IT, among others
• Strong visual merchandising, trade marketing and ambiance investments and training
192
Efficient management of the franchise
network
Model allows fast expansion with low invested capital
Successful Partnership: “Win – Win” Franchise Concentration per Operator
Intense retail training (# of franchises by # of franchisees)
Ongoing support: average of 6 stores/ consultant and average of
4 or more
22 visits per store/ year
franchises
Strong relationship with and ongoing support to franchisee
10%
IT integration with our franchises amounts to 100%
3 franchises 10%
As mono-brand stores, franchises reinforce branding in each city
they are located
1 franchise
56%
24%
Seal of Excellence from ABF (Brazilian Association of 2 franchises
Franchising)
Notes:
96% satisfaction of franchisees1 1. 96% of the current franchisees indicated they would be interested in opening a
franchise if they did not already have one
2. For a regular Arezzo brand store, with expected annual sales of R$ 2,2 million, the
5-year contract and average payback of 36-48 months2 average investment is approximately R$ 670 thousand, including store capex,
franchise fee, WC and initial inventory)
202
Multibrand stores as tool for increased
capilarity
Multibrand stores widen the distribution network and the brands’ visibility, resulting in a stronger
retail footprint
Multibrand stores’ gross revenue¹ Improved distribution and brand visibility
140,0
11.9%
Greater brand distribution network
2.621
Presence in over 1,361 cities
2.700
130,0
2.342
2.500
Fast expansion at low investment and risk
120,0
3.2% Multibrand stores -
2.300
Main focus: increase share of wallet, through the sale of more
107,4 Gross Revenue (R$ brands at the same POS and also handbags as part of the mix
104,1 MM)
110,0
2.100
Important sales channel for smaller cities and the Brazilian
100,0
# Multibrand stores
1.900
countryside
90,0
1.700
Sales team optimization: internal team and commissioned sales
representatives
80,0 1.500
2Q18 2Q19
Multi-brand stores
Notes:
1. Domestic market only 212
New Organizational Structure
Created in 2017, the structure represented the reduction in the number of CEO reports, besides
more agility in decision making, with more focus on people and sustainability.
Risk, Audit and
Board of Directors Finance Committee
People Committee
Internal Auditing
Strategy, Innovation
CEO/CCO and Brands Committee
Alexandre Birman
Operations Digital Administrative and People, Culture and
Brands International
and Industrial Transformation Finance Business Develop. Business
Cassiano Lemos/
Silvia Machado Maurício Bastos
Cisso Klaus Rafael Sachete Marco Aurélio Vidal
BU Arezzo Planning IT Finance/Legal/Fiscal People Schutz USA
BU Schutz Engineering Squads DT Controller Business develop. UN AB
BU Anacapri Sourcing Innovation Investor Relations Sustainability Exports
BU Fiever Quality Valorizza/CRM Risk Management Governance
BU Alme Industry WEB (BR/USA) Strategic Non productive
LAB Logistics Planning/PMO purchase
Management
(Method, goals and
indicators)
222
Corporate governance
The Board is comprised of 7 members, of which 5 are independent, and has a very large
engagement on the strategic planning of Arezzo&Co
Board of Directors
Natura’s CEO for over a decade and former Board Current CEO of Arezzo&Co and part of the controlling group.
Alessandro Carlucci Alexandre Birman
Member of Lojas Renner, Redecard, Alcoa Latam and Founder of Schutz brand, with over 18 year of experience on
Chairman of the Board Member
Itau-Unibanco the footwear industry.
Founder and CEO of “Ethos Desenvolvimento Humano e
José Bolonha Juliana Rozenbaum Over 13 years of experience as sell side equity research
Organizacional“; Board member of the Inter-American
Vice Chairman of the Board Independent Member analyst, focused on retail and consumer sector
Economic and Social Council (UN, WHO)
Luiza Trajano 28 years of experience in Management and Leadership.
Chairman of the Board of Magazine Luiza and LuizaCred Luiz Fernando Giorgi Current member of people committees for Santander, Sul
Independent member and former member of Sadia S.A. Board. Independent Member
América and Grupo Martins
Guilherme A. Ferreira CEO of Bahema Participações, current board member of
Independent Member Petrobras, Valid, Sul América, Gafisa and T4F
Committees
Risk, Audit and Finance Committee Strategy, Innovation and Brands Committee People Committee
Guilherme A. Ferreira (Coordinator) Juliana Rozenbaum (Coordinator) José Bolonha (Coordinator)
Members: Members: Members:
Alessandro Carlucci, Guilherme A. Ferreira and Alexandre Birman, Luiza Trajano and Juliana Luiz Fernando Giorgi, José Bolonha and Cláudia
Edward Ruiz Rozenbaum Falcão
232
Multibrand and multichannel strategy
Organic growth leveraged by multi-brand, multichannel strategy in footwear and handbags
RECEITA
BRUTA
LTM1,2
FOCUS ON SSS
NEW CATEGORIES NATIONAL ROLL-OUT FRACHISES MODEL
44,0%
FOCUS ON BAGS LAUNCH OF START THE
FOCUS ON SSS ON-GOING INVEST. EM READY TO START IN R$ 860.0
SERVICES FRANCHISES FRANCHISES
LIFE STYLE MKT 2019
FRANCHISES SEGMENTATION MM
INCREASE IN SHARE RECENT RECOGNITION
OF WALLET OF THE BRAND IN THE SOLD AT SELECTED
20,4%
CROSS-SELL OF BAGS EXPANSION IN NEW EXPANSION IN NEW
CUSTOMERS CHANNEL POINTS AND IN LINE R$ 398.3
ACTIVATION POS MKT POINTS OF SALE POINTS OF SALE
ATTRACTION CROSS- INCREASE WITH THE BRANDING
MULTIBRAND SELL OF BAGS PENETRATION MM
GROWTH WITH FOCUS
FINALIZE TRANSFER OF 14,7%
PILOT STORES OPENING OF FLAGSHIP OPENING OF FLAGSHIP
FOCUS ON SSS ON SSS FOCUS ON SSS R$ 287.9
RETAINING A MAXIMUM STORES STORES
REFRESH FLAGSHIP
OWNED STORES OF 2 FLAGSHIPS MM
CHANNEL BOOST, EX.: FASHION INFO SHOP
BOOST DIGITAL
LAUNCH IN 2017 IN TOOL FOR ENHANCING TOOL FOR ENHANCING
9,2%
PRESENCE INCREASE
APP BRAZIL AND 2018 USA BRAND AWARENESS BRAND AWARENESS R$ 179.5
TRAFFIC AND
PILOT STORE SHIPPING NEW APP AND EUROPE AND PENETRATION AND PENETRATION
WEB COMMERCE CONVERSION MM
US OPERATION AND
11,7%
FOCUS ON KEY USA PROJECT NOT A CURRENT NOT A CURRENT NOT A CURRENT
SHOWROOM IN R$ 227.9
ACCOUNTS MULTIBRAND STORES FOCUS FOCUS FOCUS
EUROPE
FOREIGN MM
SHARE OF EACH 50,0% 30,9% 12,2% 4,6% 1,5% 0,8% 100%
BRAND (LTM) 2 R$ 977.2 MM R$ 604.2 MM R$ 239.3 MM R$ 90.7 MM R$ 30.3 MM R$ 13.4 MM R$ 1.9 BI
Notes:
1. % of each brand gross revenues (LTM) does not include other revenues (not generated by any of the 6 brands).
2. Gross revenues LTM from the 6 brands; includes foreign market; does not include other (not generated by any of the 6 brands)
LTM Base 242
Strategy
Business model allows multiple growth options
Brands
Other brands
Alme
Channels Fiever Categories
Kiosks Alexandre Birman
Other categories
Dept Stores Anacapri
Outlets Clothing
Online Schutz Other accessories
Exports
Arezzo Leather accessories
Owned stores
Multi-brand Handbags Core
Franchises Footwear Adjacencies
Female
White soles
Brazil
Wellness
North America Class A1 Male
Latin America Teenager
Class A2 Full plastic
Europe Class B1 Children
Middle East
Class B2
Geography Class C1 Segment
Class C2
Positioning
252
Key messages
Arezzo&Co keeps developing its business model in a sustainable way
Consolidated business model with multiple growth opportunities
1 •
•
Sustainable growth and improvement in the profitability of existing brands.
Launch of a new brand Alme and encouraging results in Fiever brand
Staff management an ongoing development
2 •
•
Shareholders value creation sustained by leadership and training of talents
Strengthening of Company’s culture
Ownership of the value chain, greater competitive advantage
3 •
•
More agile and collaborative model
Sell-out oriented to boost results in the value chain
Company’s resilient financial growth
4 •
•
Consistent dividend payout combined with a strong cash flow
Expenses optimization in line with growing revenues
Multi-channel management know-how, excellent platform to lift brands
5 •
•
•
Digital transformation and Omni channel growth as key priorities
Strong knowledge in franchises’ management coupled with efficiency opportunities
Multibrand channel boosting the growth of new brands
2603 | FINANCIAL HIGHLIGHTS
3
                 Operational and financial highlights

    Gross Revenue Breakdown by Brand – Domestic Market (R$ million)
     2.500,0                                                                                                                                         2.000,0

                                                                                                                                                     1.500,0

                                                              CAGR: 7.0%
     2.000,0                                                                                                                                         1.000,0

                                                                                                              1.679
                                                                                      1.524
                                                                                                                                                     500,0

                                                                                                                 65
                                                              1.402
               1.282                  1.307                                              42
     1.500,0

                                                                 21                                             220                                  -

                 9                       9                                              157
                                                                119
                72                      93                                                                                                           -500,0

                                                                                                                443
                                                                                        451                                            4.6%
                                                                458
               434                      467
     1.000,0                                                                                                                                         -1.000,0

                                                                                                                                                     -1.500,0

                                                                                                                                405           424
      500,0

                                                                                                                951              15            21    -2.000,0

                                                                804                     874
               767                      738                                                                                      48            57
                                                                                                                                114           117    -2.500,0

                                                                                                                                227           228
          -                                                                                                                                          -3.000,0

               2014                    2015                    2016                    2017                    2018             2Q18          2Q19
                                                                          Arezzo          Schutz          Anacapri     Others

Other: includes A. Birman, Fiever and Alme brands only on the domestic market and other non-brand specific receipts.                                            28
3
Operational and financial highlights
Gross Revenue Breakdown by Channel – Domestic and External Market (R$ million)
2.500,0 2.000
CAGR: 8.3% 1.866
1.679
1.800
1.554
2
2.000,0 1.600
1.435
1.358 5 163 1.400
3 129
1.500,0 3 108 299 1.200
5
69 299
44 301
292
1.000
272 384
344 7.7%
1.000,0
304 800
300 305
455 489 600
831 0 1
500,0
686 748
50
400
661 638 41 69
75
104 107 200
185 197
128 152 154 187
– 76 50 66 –
2014 2015 2016 2017 2018 2Q18 2Q19
Foreign Market Franchise Multibrands Owned Stores Web commerce Others Total
Other: includes A. Birman, Fiever and Alme brands only on the domestic market and other non-brand specific receipts. 293
Operational and financial highlights
Key highlights
Sales area increased 5.4% in the last twelve months.
Net Revenues (R$ mln) Number of Stores (R$ mln) and Total Area (m2- ‘000)
CAGR 2007-2018: 20.6% Area CAGR 2014-2018: 7.3%
12,2% 1.527
9,8%
10,6% 1.360
6,4% 1.239
9,3% 1.121
11,9% 1.053
963
26,7% 860
18,8%
38,7% 679
572
12,3%
412
89,4% 367
194
2007 2008 2009 2010 2011 2012 2013 2014 2015 2016 2017 2018
303
Operational and financial highlights
Gross Profit Evolution (R$ MM) and Gross Margin (%) Net Profit Evolution (R$ MM) and Net Margin (%)
-100 bps
1.000
47,8% 50,0%
46,6% 46,8%
45,8%
44,3%
900 43,3% 42,5%
45,0%
800 40,0%
250,0
11,4% 11,4% 12,0%
711 10,7% 10,8%
700 35,0% +190 bps
624 9,4% 9,3% 10,0%
200,0
8,9%
549
600 30,0%
476 154 8,0%
500
456 25,0%
150,0
143
400 20,0%
120 120 116 6,0%
300
3.1% 15,0%
100,0
27.9%
4,0%
200
179 184 10,0%
50,0 42
100 5,0%
33 2,0%
– –
- 0,0%
2014 2015 2016 2017 2018 2Q18 2Q19
2014 2015 2016 2017 2018 2Q18 2Q19
Gross Profit Gross Margin
Net Profit Net Margin
Results excluding the adoption of IFRS 16 / CPC 06 (R2) 313
Operational and financial highlights
Gross Revenue (R$ MM) EBITDA Evolution (R$ MM) and EBITDA Margin (%)
CAGR: 8.3%
1.866
2.000,0 2.000
1.800,0
1.679 1.800
1.600,0
1.554 1.600
1.435
1.358
1.400,0 1.400
350,0
-20 bps 18,0%
15,3% 15,2% 15,2% 15,1% 14,9%
1.200,0 1.200
300,0
14,8% 14,3%
16,0%
14,0%
1.679
1.000,0 1.000
250,0
232
1.524 206
12,0%
1.402 7.7%
1.307 177
800,0 800
200,0
165
10,0%
1.282 161
600,0
455 489 600
150,0
8,0%
4.0% 6,0%
400,0 400
100,0
405 424 57 59 4,0%
200,0 200
50,0
2,0%
128 152 154 187
–
76 50 66 –
0,0 0,0%
2014 2015 2016 2017 2018 2Q18 2Q19 2014 2015 2016 2017 2018 2Q18 2Q19
Foreign Market Domestic Market EBITDA EBITDA Margin
Results excluding the adoption of IFRS 16 / CPC 06 (R2) 323
Operational and financial highlights
Arezzo&Co has a solid balance sheet with a healthy net cash position, coupled with a strong
ability to generate operating cash flow and dividend payments
Arezzo&Co generated R$155,6 MM in operating cash
Operating cash flow yield¹ 3.6% flow in the last twelve months, translating into cash flow
yield of 3.2%.
Consistent dividend payments, with a payout of more
Dividend Payout (YTD) 92.7% than 92.7% of net profit available LTM.²
Working Capital Decrease in working capital needs by 110 bps from
(% of Net Revenue) 25.2% 2Q19 to 2Q18.
Change in the capex level from 2015, in line or below
Capex / Depreciation LTM -0.9x annual depreciation.
The Company has a strong balance sheet and a
Net Cash / EBITDA 0.3x Net Cash/EBITDA ratio of 0.3x in June/19.
1) Operating cash flow yield = LTM Operating cash flow / Firm value. Considered Firm Value of R$ 4.352,6 MM (as the average from 06/29/2018 to 06/28/2019).
2) Available Net Income = Net income (-) Constitution of legal reserve (-) Constitution of fiscal incentive reserve 333
Operational and financial highlights
Cash Conversion Cycle (R$ thousand) Capex (R$ thousand)
Cash Conversion 2Q19 2Q18 Change Δ 19 x 18
Cycle (in days) Summary of Investments 2Q19 2Q18
#days (R$'000) #days (R$'000) (%)
107 408.558 101 340.401 7 Total CAPEX 17.486 15.014 16,5%
Inventory¹ 70 162.613 66 128.153 4 Stores - expansion and refurbishing 2.209 3.705 (40,4%)
Accounts Receivable² 85 394.770 85 345.085 0 Corporate 4.280 7.377 (42,0%)
(-) Accounts Payable¹ 48 148.825 51 132.837 -3 Other 10.997 3.932 179,7%
¹ Days of COGS
² Days of Net Revenues
Operational Indicators Cash Flow From Operating Activities (R$ thousand)
Δ (%)
Operating Indicators 2Q19 2Q18 Operating Cash Flow 2Q19 2Q18
19 x 18
# of pairs sold ('000) 3.185 3.075 3,6% Profits before incom e tax and social contribution 44.718 34.883
# of handbags sold ('000) 436 308 41,9% Depreciation and am ortization 19.868 8.788
# of em ployees 2.515 2.468 1,9% Others 665 13.541
# of stores* 696 636 60 Decrease (increase) in assets / liabilities (9.758) (28.098)
Owned Stores 54 52 2 Trade accounts receivables 23.388 9.804
Franchises 642 584 58 Inventories (1.064) (14.689)
Outsourcing (as % of total production) 90,3% 91,8% -1,5 p.p Suppliers (36.638) (25.485)
SSS² Sell-in (franchises) 1,3% 7,3% -6,0 p.p Change in other noncurrent and current assets and liabilities 4.556 2.272
SSS² Sell-out (ow ned stores + franchises + w eb) 4,1% 3,9% 0,2 p.p Paym ent of incom e tax and social contribution (14.309) (2.751)
Net cash flow generated by operational activities 41.184 26.363
* Include international stores 343
Operational and financial highlights
Indebtedness (R$ thousand)
Total indebtedness of R$ 175.9 million in 2Q19 against R$ 175.5 million in 2Q18.
Net cash of 0.3x versus 0.5x EBITDA in 2Q18.
Cash position and Indebtedness 2Q19 1Q19 2Q18
Cash 257.135 299.755 283.172
Total debt 175.957 174.253 175.501
Short-term 153.533 81.827 162.002
% total debt 87,3% 47,0% 92,3%
Long-term 22.424 92.426 13.499
% total debt 12,7% 53,0% 7,7%
Net debt (81.178) (125.502) (107.671)
35Appendix
36A
Key financial indicators
Δ (%) 2Q19 Δ (%)
Key financial indicators 2Q19 2Q18
19 x 18 Pro forma 4 19 x 18
Gross Revenues 489.482 454.679 7,7% 489.482 7,7%
Net Revenues 393.546 373.859 5,3% 393.546 5,3%
COGS (209.215) (195.108) 7,2% (209.234) 7,2%
Depreciation and am ortization (cost) (743) (329) n/a (469) n/a
Gross Profit 184.331 178.751 3,1% 184.312 3,1%
Gross margin 46,8% 47,8% (1,0 p.p) 46,8% (1,0 p.p)
SG&A (135.210) (130.987) 3,2% (134.894) 3,0%
% of net revenues (34,4%) (35,0%) 0,6 p.p (34,3%) 0,7 p.p
Selling expenses (84.011) (88.314) (4,9%) (91.976) 4,1%
Ow ned stores and w eb commerce (29.009) (31.059) (6,6%) (32.546) 4,8%
Selling, logistics and supply (55.002) (57.255) (3,9%) (59.430) 3,8%
General and adm inistrative expenses (43.488) (32.126) 35,4% (45.384) 41,3%
Other operating revenues (expenses) 5 11.414 (2.088) n/a 11.398 n/a
Depreciation and am ortization (expenses) (19.125) (8.459) 126,1% (8.932) 5,6%
EBITDA 68.989 56.552 22,0% 58.818 4,0%
EBITDA Margin 17,5% 15,1% 2,4 p.p 14,9% (0,2 p.p)
Net Incom e 40.568 33.123 22,5% 42.356 27,9%
Net Margin 10,3% 8,9% 1,4 p.p 10,8% 1,9 p.p
Working capital¹ - as % of revenues 24,4% 26,3% (1,9 p.p) 25,2% (1,1 p.p)
Invested capital² - as % of revenues 42,7% 36,9% 5,8 p.p 37,4% 0,5 p.p
Net cash/EBITDA LTM 0,3x 0,5x - 0,3x -
Cash 257.135 283.172 (9,2%) 257.135 (9,2%)
Total debt 175.957 175.501 0,3% 175.957 0,3%
Net cash³ 81.178 107.671 (24,6%) 81.178 (24,6%)
(1) Working Capital: current assets minus cash, cash equivalents and financial investments less from current liabilities minus loans and financing and dividends payable.
(2) Invested Capital: working capital plus fixed assets and other long term assets less income tax and deferred social contributions.
(3) Net debt is equal to total interest bearing debt position at the end of a period less cash, cash equivalents and short-term financial investments.
(4) Excluding the impacts of IFRS 16 / CPC 06 (R2)
(5) Net non-recurring effect of R$ 8.4 million due to the recovery of extemporaneous tax credits arising from the exclusion of income tax and social contribution on the ICMS tax benefit in 2016. 37A
Store History
Store Information 2Q18 3Q18 4Q18 1Q19 2Q19
Sales area¹,³ - Total (m ²) 42.044 42.504 43.965 44.086 44.322
Sales area - franchises (m²) 35.567 36.075 37.691 37.704 37.768
Sales area - ow ned stores² (m²) 6.477 6.429 6.274 6.382 6.553
Total num ber of dom estic stores 627 640 673 677 681
# of franchises 579 590 628 632 636
Arezzo 388 393 405 405 406
Schutz 67 68 73 74 73
Anacapri 124 129 150 153 157
# of ow ned stores 48 50 45 45 45
Arezzo 14 14 14 14 14
Schutz 22 22 17 17 17
Alexandre Birman 4 4 4 4 4
Anacapri 3 3 3 3 3
Fiever 4 5 5 5 5
Alme 1 2 2 2 2
Total num ber of international stores 9 9 12 13 15
# of franchises 5 5 6 6 6
4
# of ow ned stores 4 4 6 7 9
(1) Includes areas in square meters of the stores overseas
(2) Includes seven outlet type stores with a total area of 2,217 m²
(3) Includes areas in square meters of expanded stores
(4) Includes Alexandre Birman and Schutz stores, 3 in New York, 2 in Miami, 1 in Los Angeles, 1 in Las Vegas, 1 in New
Jersey, and 1 in San Francisco. 38A
Balance Sheet - IFRS
Assets 2Q19 1Q19 2Q18 Liabilities 2Q19 1Q19 2Q18
Current assets 877.448 928.010 842.426 Current liabilities 420.301 428.398 360.659
Cash and Banks 7.842 5.691 17.464 Loans and financing 153.533 81.827 162.002
Financial Investments 249.293 294.064 265.708 Lease 36.390 34.272 0
Trade accounts receivables 370.837 394.770 333.982 Suppliers 111.810 148.825 107.352
Inventory 163.368 162.613 140.861 Other liabilities 118.568 163.474 91.305
Taxes recoverable 57.554 42.903 48.899 Non-current liabilities 204.966 260.079 24.089
Other credits 28.554 27.969 35.512 Loans and financing 22.424 92.426 13.499
Non-current assets 426.667 404.581 213.878 Related parties 1.428 1.452 1.436
Long-term receivables 60.003 60.400 59.363 Other liabilities 9.715 9.130 9.154
Aplicações financeiras 0 0 0 Lease 171.399 157.071 0
Trade accounts receivables 10.948 11.070 10.569 Shareholder's Equity 678.848 644.114 671.556
Deferred income and social contribution 20.811 20.410 25.207 Capital 352.715 341.073 341.073
Other credits 28.244 28.920 23.587 Capital reserve 49.035 47.909 45.925
Investments property 3.314 3.324 3.325 Profit reserves 90.033 90.033 178.748
Property, plant and equipment 299.640 275.874 77.831 Tax incentive reserve 136.443 136.443 64.658
Intangible assets 63.710 64.983 73.359 Other comprehensive income 7.257 5.515 1.916
Total assets 1.304.115 1.332.591 1.056.304 Accumulated Profit 43.365 23.141 39.236
Total liabilities and shareholders' equity 1.304.115 1.332.591 1.056.304
39A
Income Statement - IFRS
2Q19
Income Statement - IFRS 2Q19 2Q18 Var.% Var.%
Pro forma
Net operating revenue 393.546 373.859 5,3% 393.546 5,3%
Cost of goods sold (209.215) (195.108) 7,2% (209.234) 7,2%
Gross profit 184.331 178.751 3,1% 184.312 3,1%
Operating incom e (expenses): (135.210) (130.987) 3,2% (134.894) 3,0%
Selling (97.908) (94.581) 3,5% (98.111) 3,7%
Administrative and general expenses (48.717) (34.319) 42,0% (48.182) 40,4%
Other operating income, net 11.415 (2.087) -647,0% 11.399 -646,2%
Incom e before financial result 49.121 47.764 2,8% 49.418 3,5%
Financial income (4.403) (12.881) -65,8% (2.914) -77,4%
Incom e before incom e taxes 44.718 34.883 28,2% 46.504 33,3%
Income tax and social contribution (4.150) (1.760) 135,8% (4.148) 135,7%
Current (5.381) (9.001) -40,2% (5.381) -40,2%
Deferred 1.231 7.241 -83,0% 1.233 -83,0%
Net incom e for period 40.568 33.123 22,5% 42.356 27,9%
40A
Cash Flow Statement - IFRS
Cash Flow 2Q19 2Q18
Operating activities
Income before income tax and social contribution 44.718 34.883
Adjustm ents to reconcile net incom e w ith cash from
20.533 22.329
operational activities
Depreciation and amortization 19.868 8.788
Income from financial investments (3.478) (4.605)
Payments of Interest on loans (190) (1.685)
Interest and exchange rate 207 12.858
Other 4.126 6.973
Decrease (increase) in assets
Trade accounts receivables 23.388 9.804
Inventory (1.064) (14.689)
Recoverable taxes (14.305) (9.036)
Change in other current assets 1.689 (1.005)
Judicial deposits 466 (857)
(Decrease) increase in liabilities
Suppliers (36.638) (25.485)
Labor liabilities 6.528 10.545
Fiscal and social liabilities 3.396 (781)
Variation in other liabilities 6.782 3.406
Paym ent of incom e tax and social contribution (14.309) (2.751)
Lease - -
41A
Cash Flow Statement - IFRS
Cash Flow 2Q19 2Q18
Net cash flow from operating activities 41.184 26.363
Investing activities
Sale of fixed and intangible assets 987 (2)
Acquisition of fixed and intangible assets (17.486) (15.014)
Financial Investments (243.012) (182.058)
Redemption of financial investments 290.187 244.619
Net cash used in investing activities 30.676 47.545
Financing activities w ith third parties
Increase in loans 6.358 45.770
Payments of loans (2.227) (60.872)
Créditos (débitos) com partes relacionadas, exceto sócios
Instalment Lease (10.410) -
Net cash used in financing activities w ith third parties (6.279) (15.102)
Financing activities w ith shareholders
Interest on equity (20.847) -
Profit distribution (54.153) (48.796)
Receivables (payables) w ith shareholders (24) 198
Issuing of shares 11.642 -
Repurchase of shares - (1.814)
Net cash used in financing activities (63.382) (50.412)
Increase (decrease) in cash and cash equivalents 2.199 8.394
Cash and cash equivalents
Foreign exchange effect on cash and cash equivalents (48) 778
Cash and cash equivalents - Initial balance 5.691 8.292
Cash and cash equivalents - Closing balance 7.842 17.464
Increase (decrease) in cash and cash equivalents 2.199 8.394
42Contacts CFO Rafael Sachete IR Officer Aline Penna IR Coordinator Victoria Machado IR Analyst Marcos Benetti Telephone: +55 11 2132-4303 ri@arezzoco.com.br www.arezzoco.com.br
You can also read