CORPORATE PRESENTATION NOVEMBER 2020 - JUMBO ...
←
→
Page content transcription
If your browser does not render page correctly, please read the page content below
CORPORATE PRESENTATION
NOVEMBER 2020
IMPORTANT NOTICE
                     JUMBO GROUP LIMITED CORPORATE PRESENTATION
DISCLAIMER
This presentation is prepared for information purposes only, without regard to the objectives, financial situation nor needs of any specific person. This
presentation does not constitute or form any part of any offer for sale or subscription of, or solicitation of any offer to buy or subscribe for, any securities nor
shall it or any part of it form the basis of, or be relied on in connection with, any contract or commitment whatsoever.
This presentation was prepared exclusively for the parties presently being invited for the purposes of discussion. Neither this presentation nor any of its content
may be distributed, reproduced, or used without the prior written consent of Jumbo Group Limited (“Company”). The Company does not make any
representation or warranty, expressed or implied as to the accuracy of the information contained herein, and expressly disclaims any and all liability based, in
whole or in part, on such information, errors therein or omissions therefrom.

FORWARD-LOOKING STATEMENTS
This presentation may contain certain forward-looking statements with respect to the financial condition, results of operations and business of the Company
and its subsidiaries and certain of the plans and objectives of the management of the Company and its subsidiaries. Such forward-looking statements involve
known and unknown risks, uncertainties and other factors which may cause the actual results or performance of the Company and its subsidiaries to be
materially different from any future results or performance expressed or implied by such forward-looking statements. Such forward-looking statements were
made based on assumptions regarding the present and future business strategies of the Company and its subsidiaries and the political and economic
environment in which the Company and its subsidiaries will operate in the future. Reliance should not be placed on these forward-looking statements, which
reflect the view of the management of the Company and its subsidiaries as of the date of this presentation only.

CONFIDENTIALITY
This presentation is given to you on a confidential basis and solely for your information and must not be reproduced, disclosed, distributed or passed to any
other person. No copy of this presentation shall be taken or transmitted to any country where distribution or dissemination of this presentation is prohibited. By
accepting this presentation, you agree to be bound by the limitations and restrictions set out herein.

                                                                                                                                                                       2
AGENDA
•   Corporate Overview
•   Our Brands’ Development
•   Growth Strategies
•   Latest Financials
C O R P O R AT E
  O V E RV I E W
ABOUT JUMBO
           OUR HUMBLE                                            OUR CURRENT
           BEGINNINGS                                            ACHIEVEMENTS

• Started in Singapore in 1987 with a single JUMBO      • One of Singapore’s leading multi-dining concept F&B
  Seafood outlet (now our flagship restaurant) at the     establishments
  East Coast Seafood Centre                             • Listed on SGX Catalist since November 2015
                                                        • Famous for its Award-Winning Chilli Crab, a symbolic
                                                          dish of Singapore
                                                        • Operates a network of 37 outlets, spanning across 15
                                                          cities in Asia                                         5
Beijing
                                       Seoul
                           Ilsan
                                               Osaka   Tokyo     We own 6 brands…
       Xi’an

                    Shanghai

                           Fuzhou
                              Taoyuan
                                Taipei
                                   Hsinchu
                                   Taichung

   Bangkok
                Ho Chi
                Minh
                                                               and manage 2 brands…
                City

Singapore
                                                                across 15 Cities
                                                                    in Asia           6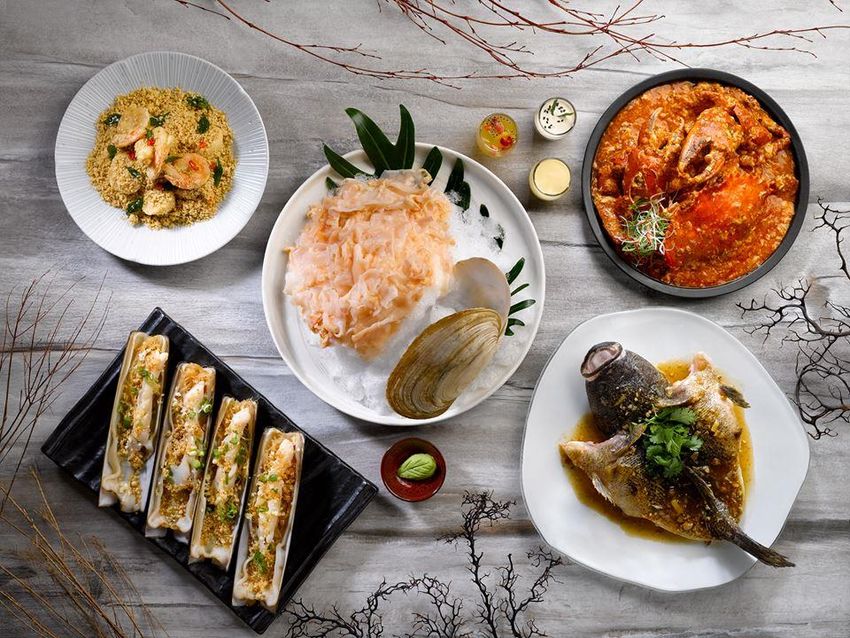
THE BIG NAME IN
                                  SEAFOOD

     1.8 tonnes                     8,000                  ~950
           of crabs sold            diners served   staff employed in Singapore,
            each day1                   daily1             China & Taiwan2
1.   Data based on FY2019
2.   As of 30 September 2020                                                       7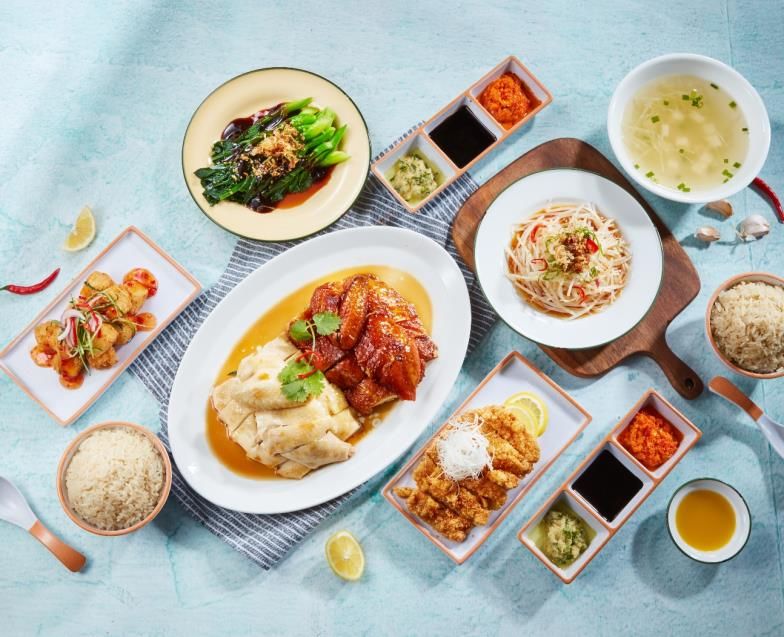
CORPORATE MILESTONES

                                        BEING A FRANCHISEE     BKT STEPPING OUT OF SINGAPORE                       GROWTH OF OUR
                                          First Tsui Wah Cha             First NG AH SIO                             BKT BRAND
                                         Chaan Teng brought     Bak Kut Teh (“NASBKT”) Franchise             First NASBKT Outlet Opened
                                            into Singapore              Opened in Taipei              2019
                                                                                                                     in Shanghai

                                                                    2018                                          CREATION OF NEW
                                                                                                                 CHICKEN RICE BRAND
                            GOING PUBLIC                                                                             First XINYAO
                         Listed on SGX Catalist                                                              Hainanese Chicken Rice Outlet
                                                                                First JUMBO Seafood               Opened in Shanghai
    SCALING UP FOR                      2015                          START OF Franchise Opened in
                                                               2017
       EXPANSION                                                    FRANCHISING      Ho Chi Minh                 CREATION OF NEW
Establishment of JUMBO                                                                                           PAO FAN CONCEPT
     Central Kitchen
                                                                                                                First Chao Ting Pao Fan
           2008                         OVERSEAS Flagship JUMBO                                                  Opened in Singapore
                                  2013
                                       EXPANSION Seafood Restaurant
                                                     in Shanghai

                         Flagship JUMBO
                OUR    Seafood Restaurant
    1987     BEGINNING     in Singapore                                                                                                      8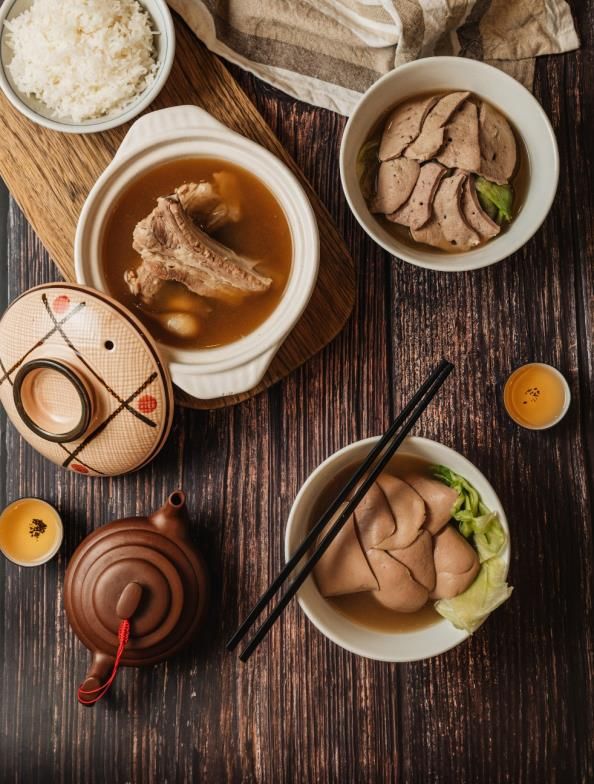
STABLE GROWTH IN
                                       FOOTPRINT     2015 – 2019 Revenue
                                            136.8                145.3                153.7        153.6    CAGR: 5.8%
                        122.8
Revenue, S$m                                                                                                97.61

                                                                                                            37
                                                                                                     34
                                                                                                            12
                                                                                       28            10
                                                                   25
                         22                   23                                       9
                                                                   5
                          4                   4
Number of
outlets
                                                                                                     24     25
                         18                   19                   20                  19

                        FY15                FY16                  FY17                FY18          FY19    FY20
                                                   Self Managed Outlets      Franchised Outlets   Revenue

1.   Not representative of growth momentum as revenue impacted by COVID-19 pandemic                                      9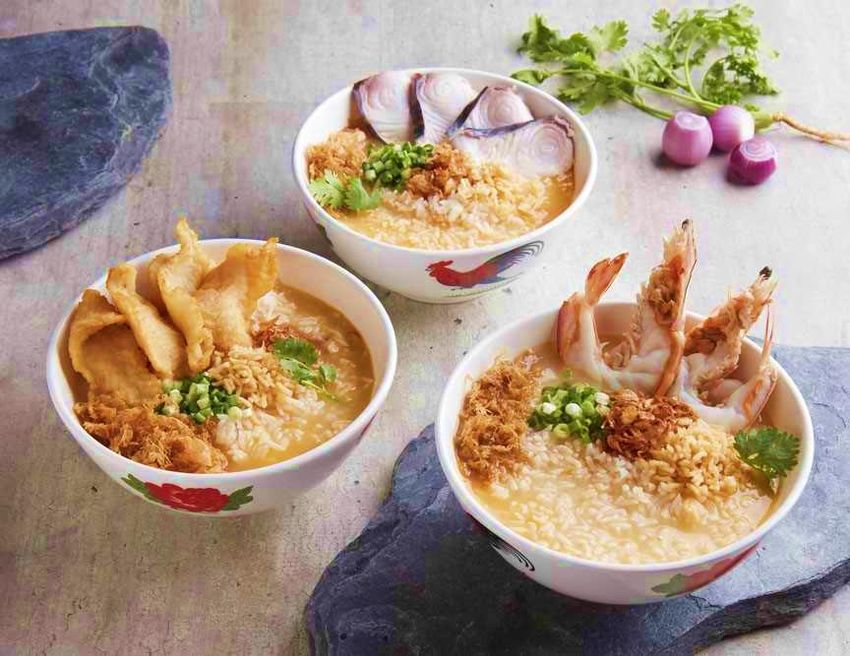
NEW OUTLET
                                      OPENINGS
                                                    OCT 2018 – SEP 2019              OCT 2019 – SEPT 2020
                   BRANDS                       NUMBER OF             CITY        NUMBER OF             CITY
                                               NEW OUTLETS                       NEW OUTLETS
JUMBO Seafood
 Self Managed                                       2         Singapore               -         -
 Franchise                                          1         Seoul                   1         Ilsan
JUMBO Kitchen (Self Managed)                        1         Shanghai                -
Zui Teochew Cuisine (Self Managed)                  1         Singapore               -
Chao Ting (Self Managed)                            1         Singapore               -
NASBKT
 Self Managed                                       -         -                       1         Shanghai
 Franchise                                          2         Hsinchu & Taipei        1         Taoyuan
XINYAO Hainanese Chicken Rice (Self Managed)        -         -                       1         Shanghai
Tsui Wah (Self Managed)                             1         Singapore               -
Total                                               9                                 4

                                                                                                               10
OUR BRANDS’ DEVELOPMENT
Our Pioneer Brand
    Renowned for its Singapore-style
        seafood cuisine & iconic
       Award-Winning Chilli Crab
              Number of
  Cities
               Outlets
 Singapore       6
 Shanghai        3
  Beijing        1
   Xi’an         1
 Taichung        1
                          Took over outlet management in Oct 19
  Taipei         1
  Fuzhou         1
Ho Chi Minh      1
 Bangkok         1        Franchised Outlets
   Seoul         1
   Ilsan         1
   Total         18
                                                                  12
A Heritage Singapore Dish
Founded in 1955 with over a million
bowls served since
Renowned for its savoury, pork-based,
peppery Teochew-style soup
Number of
Cities
Outlets
Singapore 4
Shanghai 1 New outlet opened in December 2019
Taipei 2
Hsinchu 1 Franchised Outlets
Taoyuan 1
Total 9
13Teochew Cooking at its Finest
Well-known for high-quality, refined iconic
Teochew classic dishes
Both outlets in Singapore are strategically
located within sites of historic significance,
syncing nicely with the elegance of Teochew
cuisine
14Modern Twists to Classic Dish
A creative concept introduced in 2019,
targeted at fast-moving diners who still yearn
for delicious quality seafood broth without
heading to a restaurant
Casual quick-service establishment specialising
in Teochew ‘Pao Fan’ – perfectly cooked grains
of rice served in flavourful broth
15Spreading Love for Local Delights
A new concept to introduce one of
Singapore’s famous national dishes, the
Hainanese Chicken Rice, to those abroad
First outlet opened in December 2019 at
One ITC, Shanghai
A dish which bonds the traditional culture
and flavours of the same origin between
Hainan (China) and Singapore
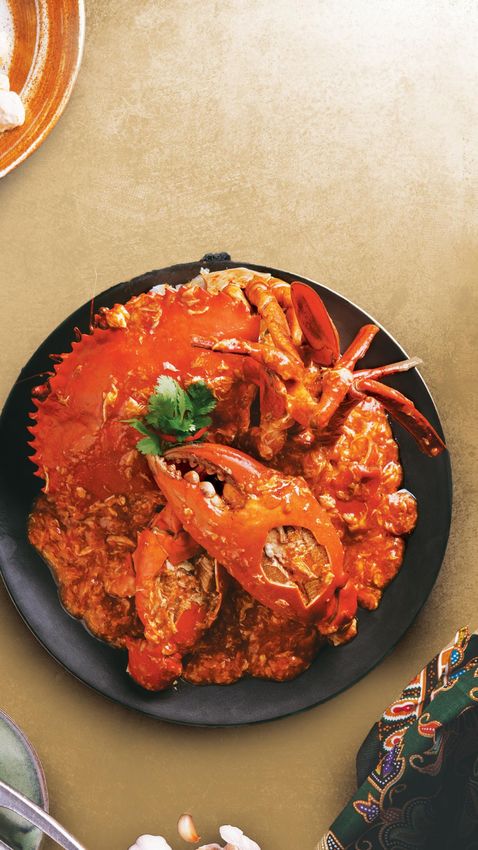
16Cultivating THAT Attitude for Food
The first virtual dining concept launched;
delivering affordable, fresh seafood staples
cooked in bombastic Southeast Asian
sauces, all in a bag
HACK IT – a term used to describe the action
of cracking or smashing. The carpe diem
sentiment of HACK IT exudes a “You Only
Live Once (YOLO)” attitude of having fun and
seizing the day with one’s favourite seafood,
whenever and wherever
Launching in December 2020
17Bringing Hong Kong To You
One of the most popular Hong Kong Style
“Cha Chaan Teng”
Introduced in Singapore in 2018, via a joint
venture between Jumbo and Tsui Wah
A symbolic move as Tsui Wah establishes its
presence outside the Greater China region
18Best of All Worlds
An unique collaboration amongst four of
Singapore best-loved seafood dining groups
Finest of Singapore seafood cuisine
encapsulated under one roof
Number of
Cities
Outlets
Singapore 1 Managed by Jumbo
Tokyo 2
Licensed Outlets
Osaka 1
Total 4
19GROWTH S T R AT E G I E S
GROWTH DRIVERS
                                • Leveraging on strong brand equity of current brands to deepen presence
                                  in existing markets, via opening of new outlets, and expansion of
         ORGANIC EXPANSION        franchise / joint venture outlet network
                                • Innovation and development of new concepts

                                                 Acquisitions of reputable and quality brands in similar or complementary
                     INORGANIC GROWTH
                                                 industries to further strengthen our product offerings or enhance our
                                                 capabilities

  Expanding                                          Preparing for the future by focusing on these 4 key aspects:
Our Reach By            INFRASTRUCTURE &             • Increasing the efficiency and productivity of corporate and strategic
                                                        functions
Staying Ahead              CAPABILITIES              • Enhancing Central Kitchen and logistic functions’ capabilities to support
 of the Curve                                           growth and expansion
                                                     • Investing in information technology systems to further strengthen our
                                                        competitive edge
                                                     • Developing a robust human capital development framework to attract and
                                                        groom talents
                WIDEN REVENUE
                   SOURCES      • Retail packs    • Home delivery
                                • Catering        • Collaborations

                                                                                                                              21
EXPANSION PLANS
• Expansions contingent upon economic recovery
from the COVID-19 pandemic
• Singapore:
▪ Expansion of Tsui Wah network & Chao Ting
concept
• Expansion of franchise network in:
▪ China: JUMBO Seafood & NASBKT
▪ Vietnam: JUMBO Seafood
▪ Thailand: JUMBO Seafood
22SCALE-UP SG
JUMBO is honoured to be selected to
participate in the Scale-Up SG programme
SCALE-UP SG FRAMEWORK
PREPARE STRATEGISE ACCELERATE GRADUATE
COMPLETED IN PROGRESS
• Identification of key focus areas • Business expansion – to incubate new ideas
(i.e. revenue growth, M&A strategies and talent and expand product lines and concepts
management) • Digital transformation – to holistically address
• Setting aspiration targets technical, management and people systems
• Drafted roadmap to achieve key objectives within a digital environment to succeed
Note: Scale-Up SG is a programme initiated by Enterprise Singapore that helps selected high-growth local companies scale rapidly, become leaders in their fields
and be groomed into future global champions. 23L AT E S T FINANCIALS
FINANCIAL HIGHLIGHTS
                                                                           Key Summary:
         REVENUE                       GROSS PROFIT                        • Significant decline in revenue in Singapore during Circuit
         S$97.6m                             S$60.7m                         Breaker (“CB”). Weak recovery post-CB due to border controls
                                                                             and social distancing measures, eliminating tourists flow, limiting
     (FY19: S$153.6m)                    (FY19: S$97.9m)                     dine-in crowd and reducing outlet capacity
      Down 36.5% YoY                     Down 38.0% YoY                    • Gross profit narrowed further due to intensive promotions and
                                                                             discounts to attract customers

                            FY20                                           • Decrease in employee benefits expense and rental expenses
                                                                             (on back of rental rebates) not sufficient to offset weakness in
                                                                             topline

       (L)/PATOC1                            EBITDA2                       • One-off exceptional items – Other income boosted by Singapore
                                                                             government’s subsidies (i.e. Jobs Support Scheme and Foreign
         (S$8.2m)                             S$8.0m                         Workers’ Levy rebates) of S$6.6m, partially offset by impairment
                                                                             on property, plant and equipment (“PPE”) and loans of S$3.7m
      (FY19: S$11.7m)                    (FY19: S$19.4m)
                                                                           • No final dividend declared to preserve liquidity for working
           YoY N.M.                      Down 58.9% YoY                      capital requirements

1.   (L)/PATOC: (Loss)/Profit attributable to Owners of the Company
2.   EBITDA for FY20 is not directly comparable against FY19 due to the adoption of SFRS(I) 16, effective from 1 October 2019                      25
FINANCIAL HIGHLIGHTS
Business Updates in 2H2020 – Singapore Operations
Circuit Breaker Phase 2 of Reopening
- Only six out of 16 outlets opened - All outlets in operations for dine-in
for deliveries and takeaways
- Dine-in crowd muted due to border controls,
- Created Bento sets and set menus social distancing measures and work-from-
more apt for deliveries to drive home arrangements
sales
- Started catering to small-scale weddings at
- Elimination of bonus, unpaid leave, CHL
and lower overtime pay due to
shorter operating hours to manage - Voluntary directors’ fees reduction by the board
employee benefits expense - No headcount replacement for natural attrition
Phase 1 of Reopening
- Gradual reopening of outlets with up to
14 outlets in operations, but still only for
deliveries and takeaways
- Across the board temporary pay cut to
manage staff costs
- Secured additional financing facilities
as backup sources of funding
26FINANCIAL HIGHLIGHTS
Business Updates in 2H2020 – Overseas Operations
China Taiwan Overseas Franchisees
• Shanghai: • Took over both JUMBO Seafood • South Korea:
▪ iAPM outlet was closed from 15 outlets from 1 October 2019 ▪ Sporadic outbreak across different
March to 5 May for facelift • COVID-19 situation in Taiwan has cities led to uncertain and volatile
▪ Outlet at Raffles City terminated been rather stable, recovery operating environment. Waves of
early in end-March trajectory positive since May lock-down and containment
measures being implemented,
• Footfall and revenue was gradually • Overall revenue was better than
impacting consumer sentiments
back to pre-COVID-19 levels by same month last year since May and dine-in propensity negatively
May • Nonetheless, performance for • Vietnam & Thailand:
• Revenue was better than same Taichung outlet was below
expectations for entire FY2020 – ▪ Footfall down, particularly in
month last year since May
Thailand due to lockdown and
due to high rental and lower per
political instability
head spend
▪ Waived off franchise royalty fees
for April to June
▪ Seen gradual improvement in last
quarter of FY2020
27FINANCIAL HIGHLIGHTS
Weak Topline due to Covid-19, Margins Narrowed
63.2% 63.4% 62.9% 63.8% 62.2%
GP Margin
153.7 153.6
145.3
136.8
97.6
Revenue &
Gross Profit, S$m
86.5 92.1 96.6 97.9
60.7
FY16 FY17 FY18 FY19 FY20
Gross Profit Cost of Sales GP Margin
28FINANCIAL HIGHLIGHTS
Lower profitability due to COVID-19, EBITDA impact mitigated by SFRS(I) 16 adoption
16.1% 15.4%
EBITDA Margin 11.9% 12.6%
22.4 8.2% 1
22.0
18.3 19.4
15.5 14.5
11.0 11.7
EBITDA & 8.0 1
PATOC, S$m
FY16 FY17 FY18 FY19 FY20
-8.2
EPS (cents) 1.7 2.4 2.3 1.7 (1.3)
EBITDA PATOC EBITDA Margins
1. EBITDA for FY20 is not directly comparable against FY19 due to the adoption of SFRS(I) 16, effective from 1 October 2019. 29FINANCIAL HIGHLIGHTS
Revenue Movement & Breakdown by Geography
(S$m) -44.9% -22.3% +100.0%
Taiwan, 7%
China, 22% 18%
FY19
82%
Singapore,
71%
-36.5%
FY20
Note: The Group acquired a major stake in the JUMBO
Seafood business in Taiwan in October 2019. 30FINANCIAL HIGHLIGHTS
Revenue Movement & Breakdown by Brands
(S$m) -46.1% -1.4% -26.4% -43.9% -36.8% -52.3% Franchise, Others,
1% 3%
NASBKT,
JS (SG), 53%
5%
Zui Teochew,
10% 4%
6%1%
9%
FY19
18%
62%
-36.5% JS (o/s SG),
28% FY20
Notes:
1. JS (o/s SG) refers to JUMBO Seafood outside Singapore (i.e. China and Taiwan)
2. NASBKT includes the wholly-owned outlet in Shanghai
31FINANCIAL HIGHLIGHTS
Same Store Sales Growth
13%
0%
-1% 0%
-15% -15%
-18% -18%
-43%
-48% -50% -49%
NASBKT Zui Teochew JS (o/s SG) JS (SG) China Singapore
Note: JS (o/s SG) refers to JUMBO Seafood outside FY19 FY20
Singapore (i.e. China and Taiwan) 32FINANCIAL HIGHLIGHTS
PATOC movement, FY20 vs FY19
(S$’000) -36.5% -33.8% N.M. -18.4% -75.3% -20.1% N.M. N.M. N.M. N.M. -4.3% -64.2% N.M. N.M.
33PROFIT & LOSS
FY20 FY19 Variance
PROFIT & LOSS
S$'000 % of Revenue S$'000 % of Revenue S$'000 %
Revenue 97,573 100.0% 153,631 100.0% (56,058) (36.5%)
Cost of sales (36,840) 37.8% (55,690) 36.2% (18,850) (33.8%)
Gross profit 60,733 62.2% 97,941 63.8% (37,208) (38.0%)
Other income 10,551 10.8% 2,380 1.5% 8,171 ->100%
Employee benefits expense (38,493) 39.5% (47,196) 30.7% (8,703) (18.4%)
Operating lease expenses (3,477) 3.6% (14,098) 9.2% (10,621) (75.3%)
Utilities expenses (3,127) 3.2% (3,913) 2.5% (786) (20.1%)
Depreciation:
- Property, plant and equipment (6,707) 6.9% (5,438) 3.5% 1,269 23.3%
- Right-of-use assets (10,369) 10.6% - - 10,369 N.M.
- Intangible assets (29) 0.0% - - 29 N.M.
Interest expense:
- Leases (783) 0.8% - - 783 N.M.
- Bank loans (48) 0.0% - - 48 N.M.
Impairment loss recognize on financial assets (2,324) 2.4% - - 2,324 N.M.
Impairment loss recognize on PPE (1,353) 1.4% - - 1,353 N.M.
Other operating expenses (14,253) 14.6% (14,901) 9.7% (648) (4.3%)
Share of results of associates (295) 0.3% (824) 0.5% (529) (64.2%)
(Loss)/Profit before tax (9,974) 10.2% 13,951 9.1% (23,925) N.M.
Income tax credit/ (expense) 104 0.1% (3,096) 2.0% 3,200 N.M.
(Loss)/Profit for the period (9,870) (10.1%) 10,855 7.1% (20,725) N.M.
EBITDA1 7,963 8.2% 19,389 12.6% (11,427) N.M.
(Loss)/Profit Attributable to Shareholders (8,169) 8.4% 11,668 7.6% (19,837) (58.9)
EPS (Cents) – Basic and Diluted (1.3) 1.8
1. EBITDA for FY20 is not directly comparable against FY19 due to the adoption of SFRS(I) 16, effective from 1 October 2019 34BALANCE SHEET
As at As at
ASSETS 30 Sep 2020 30 Sep 2019 LIABILITIES AND EQUITY 30 Sep 2020 30 Sep 2019
S$'000 S$'000 S$'000 S$'000
Current assets Current liabilities
Cash and cash equivalents 27,745 46,575 Trade and other payables 9,190 13,466
Trade and other receivables 11,141 14,107 Provision for reinstatement costs 1,989 2,051
Short-term investments 343 432 Lease liabilities2 11,767 -
Inventories 2,406 1,714 Bank borrowings 1,584 -
Total current assets 41,635 62,828 Income tax payable 356 2,470
Total current liabilities 24,886 17,987
Non-current assets
Investment in associates 1,178 1,446 Non-current liabilities
Lease liabilities2 12,871 -
Available-for-sale investment 325 75
Bank borrowings 549 -
Investments at fair value through profit or loss 3,109 3,201
Deferred tax liability 370 370
Goodwill and intangible assets1 1,838 782
Total non-current liabilities 13,790 370
Property, plant and equipment 23,554 21,764
Right-of-use assets (“ROU”)2 23,308 - Capital and reserves
Club memberships 238 238 Share capital 48,806 48,806
Other non-current assets 817 - Treasury shares (438) (447)
Total non-current assets 54,367 27,506 Currency translation reserve (191) (521)
Merger reserve (2,828) (2,828)
Total assets 96,002 90,334 Retained earnings 9,994 23,728
Equity attributable to owners of the Company 55,343 68,738
Non-controlling interests 1,983 3,239
1. Increase mainly due to the acquisition of a majority interest in Taiwan Total equity 57,326 71,977
Jumbo Seafood, which includes goodwill of S$0.9 million
Total liabilities and equity 96,002 90,334
2. Impact of adoption of SFRS(I) 16, effective from 1 October 2019 35CASHFLOW STATEMENT FY20 FY19 FY20 FY19
CASHFLOW STATEMENT
S$'000 S$'000 S$'000 S$'000
Operating activities Investing activities
Profit before income tax (9,974) 13,951 Acquisition of property plant and equipment (7,500) (6,128)
Adjustments for: Acquisition of business assets (840) -
Depreciation expense 6,707 5,438 Acquisition of investment in an associate (277) (577)
Depreciation cost of right-of-use assets 10,369 - Acquisition of other investment (250) -
Amortisation of intangible assets 29 - Acquisition of treasury shares (159) (487)
Impairment loss on property, plant and equipment 1,353 - Proceeds from disposal of property plant and equipment 70 13
Impairment loss recognised on financial assets 2,324 - Proceeds from reduction of investments in associate 250 -
Interest expense: leases 783 - Reinstatement costs paid (80) (102)
Interest expense: loans 48 - Dividend income from associates - 375
Interest income (182) (342) Net cash used in investing activities (9,603) (6,906)
Loss on property plant and equipment written off 148 288 Financing activities
Other receivables written off 212 - Dividend paid to owners of the Company (4,485) (7,694)
Gain on disposal of property plant and equipment (9) (23) Repayment of bank borrowing (309) -
Reversal of provision for reinstatement - (219) Repayment of lease obligation (10,263) -
Fair value loss on investments at fair value through profit or loss 92 507 Proceeds from issuance of shares to non-controlling interest
Fair value loss on short-term investments 89 4 540 -
in a subsidiary company
Share-based payment expense 168 40 Net cash used in financing activities (14,517) (7,694)
Share of results of associates 295 824
Net decrease in cash and cash equivalents (18,874) (6)
Unrealised foreign exchange loss/(gain) 242 (459)
Cash and cash equivalents at beginning of the year 46,575 46,583
Operating cash flows before movements in working capital 12,694 20,009
Effect of foreign exchange rate changes 44 (2)
Trade and other receivables 447 (2,390) Cash and cash equivalents at end of the period 27,745 46,575
Inventories (572) (172)
Trade and other payables (4,664) (320)
Cash generated from operations 7,905 17,127
Interest income 182 342
Interest paid (831) -
Income tax paid (2,010) (2,875)
Net cash from operating activities 5,246 14,594 36PROPOSED
STRATEGIC ACQUISITION
Proposed acquisition of 75% of the share capital of Kok Kee, milestone
development marking the Group’s first inorganic expansion since its listing in 2015
Kok Kee Wanton Noodle (国记云吞面) started in 1985 as a humble wanton noodle stall at
Lavender Food Square in Singapore before moving to Hoa Nam Building in Jalan Besar. Operations
ceased briefly between 2016 and 2019 before re-opening at its present location, Bistro 8
coffeeshop at 30 Foch Road.
Known for its springy noodles and special lard-based sauce, Kok Kee is a familiar and popular name
among many Singaporeans. It is also well-known for its soup dumplings and crispy wontons. Kok
Kee has been featured by various local food critics and mainstream news portals, such as The
Straits Times, AsiaOne and Mothership, when the stall reopened at Bistro 8 Coffeeshop.
37PROPOSED
STRATEGIC ACQUISITION
Advocating authentic local flavours and
deepening our presence in the Singapore Food and Beverage scene
Acquisition Rationale: Key Transaction Statistics:
• Adds the well-loved local-style wanton mee to • Propose to acquire 75% of the total issued and paid-up
JUMBO’s portfolio of authentic Singapore flavours, share capital of Kok Kee Wanton Noodle Pte. Ltd.
entrenching its presence in the discerning local • Remaining 25% of the share capital continued to be held
diners’ market by original owner
• To leverage on JUMBO’s expertise of standardising • Aggregate consideration is S$2,100,000, to be payable
F&B operational workflows, and achieve economies in two lump sum tranches
of scale and ensuring consistency in quality through
Central Kitchen production to develop a franchise • Consideration shall be 70% satisfied in cash, financed
model for Singapore and beyond with JUMBO’s internal resources, and 30% by the
allotment and issuance of JUMBO’s ordinary shares, for
• Provides diversification of revenue with this heritage each relevant payment of the Consideration
hawker concept
• Proposed Acquisition is not expected to have any
material effect on the net asset value and earnings per
share of the Group for FY2021
38OUTLOOK
Expects long-drawn COVID-19 impact till vaccine is available
Outlook: Proactive strategies to ride through the storm:
• Operating environment remains challenging, • Innovation on new concepts and products:
particularly in Singapore, on back of border controls ▪ New offerings (e.g. High Tea) to lengthen productive
and safe distancing measures operating hours
• Upcoming relaxations which offer some bright spots: ▪ Debut of new virtual brand – Hack It, in December.
i. Opening of borders to selective countries, including Targets the young and adventurous, who wants to
China, which may rejuvenate travellers flow; enjoy quality food in the comfort of their homes
ii. Pilot run for larger scale events (i.e. weddings) may • Continue to grow overseas presence:
increase demand for events and catering business ▪ Upcoming new project in Beijing
iii. Phase 3 of reopening which may include an ▪ Further expansion of franchise network, for existing
increase in maximum dine-in to 8 persons per table and new franchisees
• Cognizant of possible intermittent lockdowns and • Intensify cost-management efforts & improve efficiency:
rising unemployment, which will have a negative
impact in terms of lower footfall at restaurants, weaker ▪ Optimising manpower base and rationalising staff
sales revenue and further drain on cashflows costs and other overheads
• Confident of long-term prospects of F&B, given pent- ▪ Maintain close dialogues with landlords to manage
up demand and consumers’ hunger for enjoyable rental expenses
dine-in experience ▪ Accelerate digitalisation efforts
• Prudent cash management. Shore up liquidity with bank
facilities drawdown 39JUMBO GROUP LIMITED
THANK YOU
This presentation has been prepared by Jumbo Group Limited (the “Company” and together with its subsidiaries, the “Group”) and has been reviewed by the Company’s sponsor, United Overseas Bank Limited
(the “Sponsor”), for compliance with Rules 226(2)(b) and 753(2) of the Singapore Exchange Securities Trading Limited (the “SGX-ST”) Listing Manual Section B: Rules of Catalist.
This presentation has not been examined or approved by the SGX-ST and the SGX-ST assumes no responsibility for the contents of this presentation, including the correctness of any of the statements or
opinions made or reports contained in this presentation.
The contact persons for the Sponsor are Mr. David Tham, Senior Director, Equity Capital Markets and Ms. Priscilla Ong, Vice President, Equity Capital Markets, who can be contacted at 80 Raffles Place, #03-03
UOB Plaza 1, Singapore 048624, telephone: +65 6533 9898.You can also read