Cromwell European REIT - SGX-REITAS Webinar 15 September 2020 - Investor ...
←
→
Page content transcription
If your browser does not render page correctly, please read the page content below

Cromwell European REIT
SGX-REITAS Webinar

15 September 2020

About Cromwell European REIT
Resilience and Diversification Key to Mitigating Impact of COVID-19 Pandemic

         Portfolio Breakdown by Asset Class

                                Others                                                                                                                      FINLAND
                                  6%

                                                          Light
                                                                                                   €2.1 BILLION1                                            Properties             11

                                                       Industrial /                               DIVERSIFIED PORTFOLIO                                     POLAND
                                                        Logistics
                                                          31%                                                                                               Properties              6

                                                                                                                                                            DENMARK
                       Office
                         63%                                                                                                                                Properties             11
                                                                                                  95                                                        THE
                                                                                                   PRIMARILY FREEHOLD
                                                                                                                                                            NETHERLANDS
       Light Industrial / Logistics                    Office                  Others2             PROPERTIES
                                                                                                                                                            Properties             12
          Portfolio Breakdown by Geography

                               Denmark
                         Finland 4%
                           6%             The
                  Germany              Netherlands                                                  7                                                                                             GERMANY
                    8%                    29%                                                      EUROPEAN
                                                                                                                                                                                                  Properties       15
                                                                                                   COUNTRIES
                  Poland
                   12%                                                                                                                                                                            ITALY
                                                                                                                                                                                                  Properties       18
                        France                     Italy
                         19%                       22%                                            1.4 million sqm                                                                                 FRANCE
                                                                                                   NET LETTABLE AREA
                                                                                                                                                                                                  Properties       22
The Netherlands     Italy                   France                    Poland
Germany             Finland                 Denmark
                                      1.   Based on 95 properties as at 14 August 2020; valuation is based on independent valuations conducted by Colliers and Cushman &
                                           Wakefield as at 30 June 2020 of 22 assets representing ~50% of CEREIT’s portfolio by value (18 in Italy, Parc des Docks (France) and
                                           3 office assets in the Netherlands). The three German assets acquired on 24 March 2020 and the asset acquired on 13 August 2020
                                           are carried at purchase price as the most representative valuation. The remaining 69 properties in the portfolio are carried at their        SGX-REITAS WEBINAR     2
                                           valuations as at 31 December 2019 plus any capital expenditure incurred in 1H 2020
                                      2.   Others include three government-let campuses, one leisure / retail property and one hotel in Italy
Strong and Committed Sponsor
Cromwell Property Group is a Real Estate Investor and Manager Operating Across Three Continents with 200+ People
Working on the Ground in 19 European cities

Office Locations                                                                                                Portfolio

        Markets with                                                                                                        A$11.5
        Cromwell’s presence
                                                                                                                            (€7.1)1                   3.4
                                                                                                                            billion                   million
                                                                                                                                                      sq m
                                                                                                                            AUM2

                                                                                                                            A$2.4                     25
                                                                                                                                                      properties
                                                                                                                            (€1.5)
                                                                                                                            billion
                                                                                                                            Market
                                                                                                                            capitalisation3           3,000+
                                                                                                                                                      tenant-
                                                                                                                                                      customers
                                                                                                                            A$221.2
                                                                                                                            (€135.2)
                                                                                                                            million                   460+
                                                                                                                            Profit for LTM4           people

1.   Exchange rate as at 30 Jun 2020
2.   Total assets for Cromwell Property Group as at 30 Jun 2020
3.   Including attributable asset under management (“AUM”) of Phoenix Portfolios (45%) and Oyster Group (50%)
4.   Market capitalisation as at 30 Jun 2020
5.   LTM 30 Jun 2020

                                                                                                                                              SGX-REITAS WEBINAR   3
Defensive Core Properties in European Gateway Cities

       Haagse Poort                De Ruyterkade                      Bastion                 Gewerbepark Hamburg-Billstedt       Parc Des Grésillons             Green Office
The Hague, The Netherlands   Amsterdam, The Netherlands   ’s-Hertogenbosch, The Netherlands        Hamburg, Germany                  Paris, France               Kraków, Poland

    Milano Piazza Affari              Bretten                       Avatar Office                     Central Plaza                  Koningskade                  Plaza Forte
        Milan, Italy            Pforzheim, Germany                 Kraków, Poland              Rotterdam, The Netherlands     The Hague, The Netherlands        Helsinki, Finland

   Roma Amba Aradam              Moorfleeter Strasse               Parc Des Docks                       Riverside                  Herstedvang 2-4                 Paryseine
        Rome, Italy              Hamburg, Germany                   Paris, France                    Warsaw, Poland             Copenhagen, Denmark              Paris, France

                                                                                                                                                     SGX-REITAS WEBINAR          4
Diversified High-Quality Tenant-Customer Base
Top 10 Tenant-Customers Now Represent 34.5% of the Portfolio (Down from 41.0% at IPO)

  Total no. of leases as at 30 June 2020                                                                                                              935

  Total no. of tenant-customers as at 30 June 2020                                                                                                    766

                      Top 10 Tenant-Customers                                                          Tenant-Customer Trade Sector Breakdown by
                                                                                                       Headline Rent1
                                                                       % of Total
  #              Tenant                       Country
                                                                     Headline Rent1
       Agenzia del Demanio
  1    (Italian State Property        Italy                                13.5%                                                               13.5%               16.6%
       Office)
  2    Nationale-Nederlanden          The Netherlands                       5.9%                                                       3.7%
                                                                                                                                   3.8%
  3    Essent Nederland               The Netherlands                       2.7%
                                                                                                                                   3.8%                                      12.8%
  4    Kamer van Koophandel           The Netherlands                       2.1%                                                   4.2%
       Employee Insurance Agen
  5                            The Netherlands                              2.0%                                                    5.4%
       cy (UWV)2
       Motorola Solutions                                                                                                                                                 12.3%
  6                            Poland                                       1.9%                                                           6.7%
       Systems Polska
                                                                                                                                                     7.6%   9.6%
  7    Holland Casino3                The Netherlands                       1.7%
  8    Santander Bank Polska          Poland                                1.7%
  9    Felss Group                    Germany                               1.5%                               Public Administration              Financial - Insurance           Wholesale - Retail
                                                                                                               Professional - Scientific          Manufacturing                   Transportation - Storage
  10   Anas                           Italy                                 1.4%
                                                                                                               IT - Communication                 Entertainment                   Other Service Activities
                                                                           34.5%                               Real Estate                        Administrative                  Others4

                             1.   As at 30 June 2020
                             2.   Uitvoeringsinstituut Werknemersverzekeringen (UWV)
                             3.   Nationale Stichting tot Exploitatie van Casinospelen in the Netherlands                                                            SGX-REITAS WEBINAR                  5
                             4.   Others comprise Accommodation / Utility / Education / Rural / Human Health / Mining / Other Service Activities /
                                  Residential / Water / Miscellaneous Services
FY 2020 to Date
Moved to “Safety-First” Mode, Completed Transactions, Provided Frequent Business Updates amid COVID-19

                                                             7 Apr:
                                                             Released FY 2019 Annual Report
25 Feb:                                                                                                                                       5 Aug:
Announced FY 2019 results and                                8 Apr:                                                                           Ranked 7th in the Singapore
provided COVID-19 business                                   Provided COVID-19 business                                                       Governance and Transparency
update                                                       update (including the mention of                                                 Index 2020 – REITs and
                                                             full drawdown of RCF)                                                            Business Trusts category
Late Feb:
Moved to “safety-first” mode as                              27 Apr:                                                                          14 Aug:
COVID-19 spread in Europe                                    Announced transition to half-             26 Jun:                                Completed acquisition of asset in
                                                             yearly financial statement                Conducted FY 2019 AGM and              Germany
28 Feb:                                                      announcements and interim                 announced proposed partial
Announced proposed acquisition                               business updates for the first and        repayment drawdown of RCF as           14 Aug:
of asset in Germany                                          third quarters                            part of COVID-19 update                Announced 1H 2020 results

                                                                                          Lockdown measures in place in Europe

             Feb                             Mar                             Apr                May                  Jun                   Jul                  Aug

                                 VIX hits highest level               Europe passes                           Europe eases certain lockdown measures
                                                                     COVID-19 peak1

                           13 Mar:                                                 12 May:                                       13 Jul:
                           Provided COVID-19 business update                       Provided 1Q 2020 business update              Entered agreement to co-invest
                                                                                   (including COVID-19 update)                   directly in two data centre
                           24 Mar:                                                                                               projects in London and Frankfurt
                           Completed disposal of 12 assets in                      29 May:
                           France, Denmark, and the                                Released FY 2019 Sustainability
                           Netherlands; and acquisition of 3                       Report
                           assets in Germany
 1.   In terms of average number of cases in the EU; Source: The Financial Times

                                                                                                                                                 SGX-REITAS WEBINAR      6
Europe Stands Out in light of COVID-19
Countries in Europe are Managing Covid-19 Pandemic Better than Most

▪ Europe was badly affected by COVID-19 in 2Q 2020 but countries are
  emerging out of COVID-19 lockdowns in 3Q 2020
▪ After steep -15.3% decline in 2Q 2020 Eurozone GDP, 2H 2020 is
  expected to see a rebound in economic activity and stabilisation in
  unemployment and trade, with full-year 2020 GDP forecast at -7.8%
▪ Strength in Euro currency and bonds due to recent EU 27-country €1.1
  trillion rescue relief package agreement; 8% rally of the Euro against the
  Singapore Dollar year to date

                              CEREIT’s pan-European portfolio is well-diversified across
                              sectors that are likely to remain the least affected by COVID-19;
                              COVID-19 impact on CEREIT’s tenant-customers has been limited
COVID-19-related updates as at 5 August 2020:                                           Cumulative Relief / Rebate Requests
▪ 243 tenant-customers (~20.8% of yearly gross income) approached
  CEREIT for re-profiling of leases (no material change from July)                                                           Flattening Of
                                                                                            300                                The Curve     25%
▪ Over half (~10.2% of yearly gross income) lease payments have been

                                                                               No. oF Requests
  temporarily reprofiled; abatement requests of tenant-customers                            250                                              20%

                                                                                                                                                   % of Income
  representing 3.1% of yearly gross income have been rejected                               200
                                                                                                                                             15%
                                                                                            150
▪ Only €405,000 in rent abatements agreed to date (mainly to smaller                                                                         10%
                                                                                            100
  tenant-customers (up from €236,000 as at end-April)                                                                                        5%
                                                                                                 50
▪ €3.0 million provisions in 1H 2020, based on detailed micro discussions                        0                                           0%
  with tenant-customers
▪ ~86% cash collection as at 5 August 2020; cash collection in 5 out of 7                             No of requests     % of income
  countries of operations is close to or above 90% since 1 March 2020

                                                                                                                       SGX-REITAS WEBINAR                    7
Resilient Portfolio with Stable Occupancy
1H 2020 Portfolio Management Highlights

 Demonstrable                                                                                              5.1-year
                                          94.7%                           +6.4%
 portfolio resilience                     portfolio                      rent reversion                   WALE
                                          occupancy

 De-risking the                           34.5%                          ~91%                            Only 3.3%
 Portfolio                                exposure to top                exposure to                     of FY 2020
                                          10 tenant-                     government,                     lease expiries
                                          customers                      MNCs and                        remain
                                          With WALE2 of 7.0
                                          years
                                                                         large                           Down from 14.5% at
                                                                                                         the beginning of the
                                                                         corporates                      year

 Active asset                  ▪ Leasing momentum continued despite COVID-19, with large new leases in the
                                 Netherlands, France and Finland in 2Q 2020
 management
                               ▪ €8.8 million before tax (€6.0 million after tax) realised capital gains from 13-asset sale
 despite COVID-19
                               ▪ ~30% reduction in exposure to SME tenant-customers to ~9% of tenant-customers
                               ▪ Capex reduced to essential works while meeting new environmental standards

                                                                                                      SGX-REITAS WEBINAR        8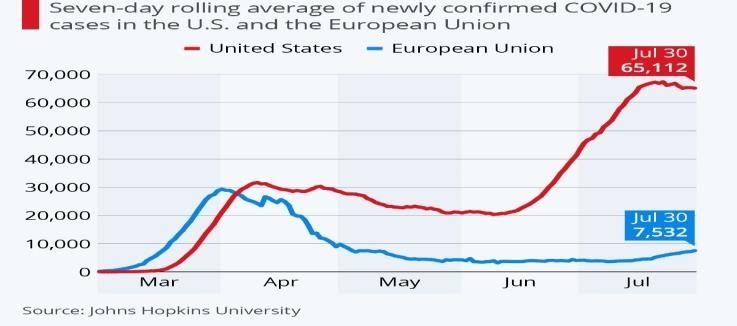
2Q 2020 Portfolio Leasing Highlights
Lease Expiry Profile – Commenced the Year with 14.5% Expiring in FY20; Now only 3.3% in 2H 2020

               Overall Portfolio                                          Office Sector                                      Light Industrial / Logistics

             19,123 sqm                                                8,300 sqm                                               10,823 sqm
              (45 leases)                                              (15 leases)                                             (30 leases)
              19 new leases (11,815 sqm) and                           7 new leases (5,312 sqm) and                            12 new leases (6,503 sqm) and
              26 renewals (7,308 sqm)                                  8 renewals (2,988 sqm)                                  18 renewals (4,320 sqm)

              +1.3%                                                    +1.6%                                                   +0.6%
              rent reversion                                           rent reversion                                          rent reversion
              5.1-year                                                  5.0-year                                                   4.8-year
              WALE                                                      WALE                                                       WALE

 Lease Expiry as at 30 June 2020

                                                                                                                                            63.8%

    55% of headline rent expiries and breaks                      ▪ Long WALE (5.1 years) and WALB (3.5 years)
    up to 31 December 2020 have been de-                          ▪ Top 10 tenant-customers’ WALE is 7.0 years
    risked as at 30 June 2020
                                                                                                                                                       33.8%
                                                                                         24.6%
                                                         17.3%                                                             17.0%
                                          12.2%
                    7.3%                                                   9.1%                              8.3%
      6.6%

             2020                                 2021                            2022                              2023                     2024 and beyond

                                                          % by WALE                              % by WALB

                                                                                                                                       SGX-REITAS WEBINAR      9
Limited Impact on Results from COVID-19
1H 2020 Financial and Capital Management Highlights
1H 2020 DPU only €57.7 million €44.6 million €1.74 cents
3.4% lower than 1H Net Property Distributable DPU
2019 on a like-for- Income Income Only 3.4% lower than
1H 2019 on a like-for-
Only 0.6% lower than
like basis1; 6.6% higher than 1H 2019
1H 2019
like basis1
underpins full-year
34.4% 6.7x €50.3 cpu
outlook; 100%
Net gearing2 ICR3 Net Asset Value
payout ratio 39.0% aggregate Well within all loan Minimal impact from
maintained leverage is within range covenants COVID-19
set by the Board
Vigilant and 1H 2020 DPU is based on 100% payout of DI and includes:
cautious €3.0 million allowance for COVID-19-related uncollected rent in 2Q 2020
approach €2.8 million distribution of realised capital gains from divestments
minimises Management fees paid 100% in cash, reducing long-term dilution NAV and DPU
High cash levels maintained; cash balance of €158 million as at 30 June 2020,
COVID-19 impact following repayment of €75 million of RCF given more normalised market indicators
€2.07 billion carrying value of investment portfolio, reduced by only ~1% based on
revaluation of ~ 50% of portfolio as at 30 June 2020
1. 1H 2020 fees to be paid 100% in cash. On a like-for-like basis, assuming that the management fees and property manager fees had been paid 100% / 40% respectively in Units as done previously, DPU would have been
€1.97 cents, which is only 3.4% below 1H 2019
2. Net gearing is total debt less cash over total assets less cash. Aggregate leverage is 39.0% as per the Property Funds Appendix and includes €75 million drawn against the RCF
3. Calculated in line with the Code on Collective Investment Schemes (“CIS Code”) revised on 16 April 2020
SGX-REITAS WEBINAR 10Key Financial Metrics
NPI and Income Available for Distribution
▪ NPI and income available for distribution have been growing steadily since IPO due to new acquisitions, partially offset by
divestments. However, the onset of COVID-19 has negatively impacted these:
▪ 1Q 2020 NPI impacted by COVID-19 lockdowns from February
▪ 2Q 2020 NPI further affected by COVID-19 with a €3.0 million allowance for uncollected rent, lower carparking income in
Central Plaza, Rotterdam and no income from cinema in Lissone, Milan
▪ On a like-for-like basis:
▪ 1H 2020 office portfolio NPI was €26.0 million (€1.4 million lower than 1H 2019 due to the lower income from Central
Plaza as mentioned above and lower NPI from the Finnish portfolio which was in line with the acquisition underwriting)
▪ 1H 2020 light industrial / logistics portfolio NPI was €17.3 million (€1.1 million lower than 1H 2019, mostly due to
lower other income from the one-off French government compensation of €0.9 million paid in 1H 2019)
Net Property Income (€‘000) Income Available for Distribution (€‘000)
Number of Properties Number of Properties
74 75 75 90 97 97 103 103 94 94 74 75 75 90 97 97 103 103 94 94
€ ‘000 € ‘000
35,000 30,000
30,000 33,563 25,000
30,956 25,772 26,286
25,000 28,449 20,000 23,256
26,419 27,715 26,765 22,394 22,446 21,309
20,000
21,508 20,929 15,000
15,000 19,751 20,739 16,363 17,265 17,090 17,220
10,000
10,000
5,000 5,000
0 0
1Q FY18 2Q FY18 3Q FY18 4Q FY18 1Q FY19 2Q FY19 3Q FY19 4Q FY19 1Q FY20 2Q FY20 1Q FY18 2Q FY18 3Q FY18 4Q FY18 1Q FY19 2Q FY19 3Q FY19 4Q FY19 1Q FY20 2Q FY20
1. 1Q FY18 covers the period from 1 Jan 2018 to 31 Mar 2018
SGX-REITAS WEBINAR 11Negligible COVID-19 Impact on Valuations
Substantial Portfolio Valuations Carried out at 30 June 2020
• Valuations carried out as at 30 June 2020 for 22 properties (representing ~50% of CEREIT’s portfolio,
comprising all 18 Italian assets, Parc des Docks in France and three office assets in the Netherlands)
• €2.07 billion carrying value of investment portfolio, reduced by only ~1% based on revaluation stated above
• Net valuation of these assets fell by €17.7 million (2.0%), mostly due to Italy valuations which fell by €15.3
million, largely because of impact on the hotel in Saronno and cinema-anchored retail property in Lissone,
Milan
• Portfolio NOI yield of 6.0%, with industrial NOI yield of 6.47%, office NOI yield of 5.56% and other sector NOI
yield of 8.71%
• Three assets, including core assets Affari in Milan and Parc des Docks in Paris, saw valuations increase due
to asset management initiatives and small cap rate compression
• Full independent valuation of existing portfolio planned as at 31 December 2020
Fair Value Gain / (Loss) of Investment Properties since IPO
SGX-REITAS WEBINAR 12Responsible Capital Management
Aggregate Leverage Continues to be Within Board-approved Range; Low Cost of Funding Results in High Interest Cover
39.0% 100% ~1.5% p.a. 6.7x
aggregate leverage1 hedged2 cost of funding Interest Coverage
Includes €75 million high percentage of total and 73% of portfolio Well within loan covenants
temporarily drawn gross debt is hedged now unencumbered
from the RCF
As at 30 Jun 2020 As at 31 Dec 2019
Total Gross Debt €885.4 million €830.8 million
Proportion of Hedge Ratio2 100% 97.5%
Aggregate Leverage1 39.0% 36.8%
Net Gearing (%)1 34.4% 34.5%
Interest Coverage Ratio 6.7x 6.7x
Weighted Average Term to Maturity 2.8 years 3.4 years
1. Aggregate Leverage is calculated as per the Property Funds Appendix and includes €75 million drawn against the RCF. Net gearing is more relevant and is
calculated as total debt less cash over total assets less cash
2. Proportion of Hedge Ratio is the amount of debt (excluding the RCF) which has been hedged with interest rate derivatives
SGX-REITAS WEBINAR 13Distribution Policy, Distributions and Fees
Distribution Timetable for 1H 2020 Distribution
Last Day of Trading on a “cum” Basis 20 August 2020 (Thursday)
Ex-Date 21 August 2020 (Friday)
Books Closure Date 24 August 2020 (Monday)
Deadline for submitting Currency Election Notice 14 September 2020 (Monday)
Announcement of exchange rate on SGXNET 21 September 2020 (Monday)
Distribution Payment Date 28 September 2020 (Monday)
Distribution Amount per Unit (for period from 1 Jan 2020 to 30 Jun 2020) €1.74 cents
▪ 100% of CEREIT’s annual distributable income for 1H 2020 is being paid out
▪ Payment of Manager’s fees and property management fees for 1H 2020 will be in cash, demonstrating alignment
with unitholders and ensuring no dilution to future NAV and DPU from issuing Units at a significant discount to
NAV / unit
▪ Consideration is still being given to changing the frequency to quarterly distributions, subject to completion of a
corporate simplification programme and economic uncertainty caused by COVID-19 pandemic tapering off
SGX-REITAS WEBINAR 14Investment Activity Resuming in 2H 2020
1H 2020 Strategy and Investment Highlights
Re-emerging ▪ Long-term target portfolio of 75% or more within Western Europe and 75% or more in
office and light industrial / logistics with current focus on:
acquisition pipeline
▪ Increased exposure to logistics and data centres
and development
opportunities ▪ Targeted divestment of a number of office assets
▪ Planned key redevelopment opportunities in Paris, Amsterdam and Milan
New opportunity to ▪ Stratus / Cromwell joint venture offers exposure to burgeoning data centre asset class
invest in data ▪ Potential projects include 100MW London and 300MW Frankfurt sites
centres ▪ Various project milestones to be achieved before CEREIT participation is confirmed
▪ CEREIT to benefit from “first look” rights on pipeline
Diversified register ▪ Well-diversified, quality unitholder register, boosted by inclusion in about 50 FTSE,
MSCI, iEdge and other indices in 1H 2020
and well-advanced
credit rating ▪ CEREIT’s trading liquidity has increased 13-fold since IPO, well above EPRA Nareit
Developed Asia Index hurdle
process support
future capital ▪ Well-advanced credit rating process and preparation for EMTN programme
raises
SGX-REITAS WEBINAR 15Commentary on the European Economy
Sentiment is Improving
▪ Eurozone GDP fell by a historic 12.1% in 2Q 2020, Eurozone: Contributions to GDP growth
driven by the impact of COVID-19 lockdowns
▪ 2H 2020 GDP is expected to rebound and finish the
year at -7.8%, leading to +6.4% growth in 2021
▪ With the pandemic hitting some countries harder than
others and various degrees of policy responses put in
place, recovery is expected to be uneven across the
region
▪ Approval of the €1.1 trillion recovery plan presented by
the European Commission supports the region’s
medium-term growth outlook
▪ Employment fell in 2Q 2020, however drop is mitigated
by short-time work schemes introduced by various
governments
▪ Unemployment rate is expected to rise over the course
of 2020 to 8.4%, peaking in 2021 at 9.1%, before falling
back thereafter as the Eurozone economy gathers
momentum
Source: Oxford Economics
SGX-REITAS WEBINAR 16European Office Market
Average Vacancy Rates Rise but Marginally as Speculative Development Slows
▪ The uncertainty brought on by COVID-19 has led to a small rise in vacancy rates across most European office markets. However, the
rates are still historically low with CEREIT’s key Paris and Dutch market vacancies below the average of 6.47%
▪ Over the next 12 months, occupier demand is expected to be weak due to COVID-19 impact on corporate profits. Over the medium
term, the effect of working from home on a large scale may also have an uncertain impact on the amount of office space that occupiers
wish to lease. This could lead to a further vacancy rates rise, partially offset by the likely scaling back in speculative development
▪ Despite 2Q 2020 easing of demand, there is a current lack of high-quality office space across Europe, keeping prime headline rents
flat. There has been some evidence of incentives increasing, particularly in secondary markets
▪ There is limited (prime) capital value growth forecast over the next five years, with each country growing by 1.6% per year on average.
Income return may therefore become increasingly more important in driving stronger total returns
▪ CEREIT’s office portfolio with a mixture of core and core+ assets is well-positioned to suit changing needs
Office Vacancy Rates 2Q 2020
16
14
12
10
%
8 Average 6.47%
6
4
2
0
Source: CBRE
SGX-REITAS WEBINAR 17European Light Industrial / Logistics Market
High Occupier Demand is Expected to Keep Vacancy Rates at a Low Level
▪ Occupier demand for logistics has largely remained strong in 1H 2020, with online retailers and supermarket chains continuing to
drive healthy levels of take-up. Several occupiers are also looking to near-shore operations, further increasing the demand within
the sector
▪ The high levels of leasing activity is expected to continue into the second half of the year, which will keep vacancy rates at the
current low level of 4.1%. As a result, prime rents are forecast to see positive growth over the next two years
▪ Development activity remains strong, with a number of schemes set to complete over the next 12 months. The majority of this
space is expected to lease quickly, meaning a sharp rise in vacancy rates is not expected
▪ Investors have continued to target the sector due to its stability and potential growth compared to other sectors across Europe. The
weight of capital from European and global investors is expected to keep prime yields stable over the next 12 months. The lack of
yield softening combined with positive rental growth will lead to an average annual total return of 6.6% over the next five years
Light Industrial / Logistics Vacancy Rates 2Q 2020
9.00
8.00
7.00
6.00
5.00 Average 4.1%
%
4.00
3.00
2.00
1.00
0.00
Source: CBRE
SGX-REITAS WEBINAR 18Key Takeaways
Outlook is Clearer and Underpins Greater Confidence in FY 2020 DPU / NAV
€2.1 BILLION PAN- LIMITED COVID-19 BALANCE SHEET
EUROPEAN PORTFOLIO IMPACT ON RESULTS IN GOOD SHAPE
Diverse office and light €1.74 cents 1H 2020 DPU Low net gearing of
industrial / logistics underpinned by on-the- 34.4% and less than 1%
portfolio is resilient with ground active asset decrease in portfolio
improved occupancy and management valuations
positive rent reversion
CAPITAL TRANSACTIONS TO CLEARER 2H 2020
MANAGEMENT RESUME IN 2H 2020 OUTLOOK
Manager is assessing Focus on logistics assets Greater visibility on FY
refinancing options; has in Germany and 2020 DPU / NAV, with Euro
well-advanced neighbouring countries and bond strength from the
preparations for rated and potential EU-27 €1.1 trillion rescue
EMTN issue in 2H 2020 transformational entry in relief package
data centres
SGX-REITAS WEBINAR 19THANK YOU If you have any queries, kindly contact: Cromwell EREIT Management Pte. Ltd., Chief Operating Officer & Head of Investor Relations, Ms Elena Arabadjieva at elena.arabadjieva@cromwell.com.sg, Tel: +65 6920 7539, or Newgate Communications at cereit@newgatecomms.com.sg.
Glossary and Definitions
All figures in this presentation are as at 30 June 2020 and stated in Euro (“EUR” or “€”), unless otherwise stated

 Abbreviations / mentions     Definitions

 1H 2019 / 2H 2019 / FY       “1H 2019” refers to the period from 1 January 2019 to 30 June 2019; “2H 2019” refers to the period from 1 July 2019 to 31 December 2019; “FY 2019” refers to the period from 1 January 2019
 2019 / 1Q 2020 / 2Q 2020 /   to 31 December 2019; “1Q 2020” refers to the period from 1 January 2020 to 31 March 2020; “2Q 2020” refers to the period from 1 April 2020 to 30 June 2020; “1H 2020” refers to the period
 1H 2020 / FY 2020 / 3Q       from 1 January 2020 to 30 June 2020; “FY 2020” refers to the period from 1 January 2020 to 31 December 2020; “3Q 2020” refers to the period from 1 July 2020 to 30 September 2020, “FY
 2020 / FY 2021               2020” refers to the period from 1 January 2020 to 31 December 2020; “FY 2021” refers to the period from 1 January 2021 to 31 December 2021

 Capex                        Capital expenditure

 DI                           Distributable Income available for distribution to unitholders

 DPU / cpu                    Distribution per Unit / cents per Unit

 EMTN                         Euro medium-term note
                              Estimated rental value, typically representing valuers' opinion of the open market rent which, on the date of valuation, could reasonably be expected to be obtained on a new letting or rent
 ERV                          review of a property
                              ICR is computed as trailing 12 months adjusted EBITDA divided by trailing 12 months interest expense and borrowing-related fees which are amortised over the loan tenure, as defined in the
 ICR                          CIS Code revised on 16 April 2020. Previously, ICR was computed based on net income before tax, fair value changes and finance costs divided by interest expense, which returns a ratio of
                              7.3x and 8.6x for June 2020 and December 2019 respectively. The decrease in ICR is a result of an increase of borrowing costs related to the drawdown of the RCF during 2Q 2020

 MNCs / SME(s)                Multinational corporations / Small- and medium-sized enterprise(s)

 MW                           megawatts

 NAV / NPI                    Net asset value / Net property income

 NOI                          Net operating income

 P.a.                         Per annum

 P.p.                         Percentage points

 RCF                          Revolving credit facility
                              Calculated as a percentage representing a fraction with a numerator the new headline rent of all modified, renewed or new leases over the relevant period and denominator the last passing
 Rent reversion               rent of the areas being subject to modified, renewed or new leases
                              Valuers’ term; typically calculated as a percentage representing a fraction with a numerator the net market rental value per annum (net of non-recoverable running costs and ground rent)
 Reversionary yield           expressed and denominator he net capital value.

 Sponsor                      CEREIT’s sponsor, Cromwell Property Group

 Sqm / NLA                    Square metres / Net lettable area

 Tenant-customer              Tenant-customer retention rate by ERV is the % quantum of ERV retained over a reference period with respect to Terminable Leases, defined as leases that either expire or in respect of which
 retention rate               the tenant-customer has a right to break over a relevant reference period

 YoY / QoQ                    Year-on-year / quarter-on-quarter
                              WALE is defined as weighted average lease expiry by headline rent based on the final termination date of the agreement (assuming the leases are not terminated on any of the permissible
                              break date(s), if applicable); WALB is defined as the weighted average lease break by headline rent based on the earlier of the next permissible break date at the tenant-customer’s election or
 WALE / WALB                  the expiry of the lease. WALE and WALB as at 30 June 2020. The reassessment of the lease structure for the tenant-customerr Agenzia del Demanio in Italy had a positive impact of 0.8 years
                              on the portfolio WALE and 2.3 years on the top 10 tenant-customers WALE as at 30 June 2020. which would have otherwise been 4.3 years and 4.7years respectively

                                                                                                                                                                                      SGX-REITAS WEBINAR                         21
Disclaimer
This presentation shall be read only in conjunction with and as a supplementary information to Cromwell European Real Estate Investment Trust’s (“CEREIT”)
1H 2020 financial results announcement dated 14 August 2020 published on SGXNet.
This presentation is for information purposes only and does not constitute or form legal, financial or commercial advice, or a recommendation of any kind, part of
an offer, invitation or solicitation of any offer to purchase or subscribe for any securities of CEREIT in Singapore or any other jurisdiction nor should it or any part
of it form the basis of, or be relied upon in connection with, any contract or commitment whatsoever. Nothing herein should be or deemed to be construed, or
relied upon, as legal, financial or commercial advice or treated as a substitute for specific advice relevant to particular circumstances. It is not intended nor is it
allowed to be relied upon by any person. The value of units in CEREIT (“Units”) and the income derived from them may fall as well as rise. The Units are not
obligations of, deposits in, or guaranteed by Cromwell EREIT Management Pte. Ltd, as manager of CEREIT (the “Manager”), Perpetual (Asia) Limited (as trustee
of CEREIT) or any of their respective affiliates. The past performance of CEREIT is not necessarily indicative of the future performance of CEREIT.
This presentation may contain forward-looking statements that involve risks and uncertainties. Actual future performance, outcomes and results may differ
materially from those expressed in forward-looking statements as a result of a number of risks, uncertainties and assumptions. These forward-looking statements
speak only as at the date of this presentation. No assurance can be given that future events will occur, that projections will be achieved, or that assumptions are
correct. Representative examples of these factors include (without limitation) general industry and economic conditions, interest rate trends, cost of capital and
capital availability, competition from similar developments, shifts in expected levels of property rental income, changes in operating expenses, including
employee wages benefits and training, property expenses, governmental and public policy changes and the continued availability of financing in the amounts and
the terms necessary to support future business.
Prospective investors and unitholders of CEREIT (“Unitholders”) are cautioned not to place undue reliance on these forward-looking statements, which are based
on the current view of the Manager on future events. No warranties, representations or undertakings, express or implied, is made as to, including, inter alia, any
as to the fairness, accuracy, completeness or correctness for any particular purpose of such content, nor as to the presentation being up-to-date. The content of
this presentation should not be construed as legal, business or financial advice. No reliance should be placed on the fairness, accuracy, completeness or
correctness of the information, or opinions contained in this presentation. None of the Manager, the trustee of CEREIT or any of their respective advisors,
representatives or agents shall have any responsibility or liability whatsoever (for negligence of otherwise) for any loss howsoever arising from any use of this
presentation or its contents or otherwise arising in connection with this presentation. The information set out herein may be subject to updating, completion,
revision, verification and amendment and such information may change materially. An investment in Units is subject to investment risks, including possible loss
of the principal amount invested.
Unitholders have no right to request that the Manager redeem or purchase their Units while the Units are listed. It is intended that Unitholders may only deal in
their Units through trading on Singapore Exchange Securities Trading Limited (the “SGX-ST”). Listing of the Units on the SGX-ST does not guarantee a liquid
market for the Units.
SGX-REITAS WEBINAR 22You can also read