K Invest Globale Aktier II Quarter End Statement - For the period January 1, 2021 to March 31, 2021

Page created by Jill Wood
 
CONTINUE READING
K Invest Globale Aktier II Quarter End Statement - For the period January 1, 2021 to March 31, 2021
K Invest Globale Aktier II
Quarter End Statement
   For the period January 1, 2021 to March 31, 2021

                                                      BARON®
                                                      CAPITAL
K Invest Globale Aktier II Quarter End Statement - For the period January 1, 2021 to March 31, 2021
As of March 31, 2021
Baron Investment Philosophy   Reporting Currency: DKK
As of March 31, 2021
    K Invest Globale Aktier II                                                                                                        Reporting Currency: DKK

    Portfolio Manager: Alex Umansky                                         Primary Contact:       Stephen Millar                       +44(0)20 3941 5961
                                                                                                   Vice President, Head of EMEA

                                                                            Client Service:        Janet Lam Chen                           +1-212-583-2162
                                                                                                   Director, Client Service
    Investment Strategy                                                                            Jennifer Bailey                          +1-212-583-2197
                                                                                                   Senior Associate, Client Service
    The portfolio invests mainly in growth companies of all sizes located
    throughout the world. Diversified.                                                             Michael Howard                           +1-917-933-0127
                                                                                                   Associate, Client Service

                                                                            Table of Contents:
                                                                            Portfolio Summary                                                              2
                                                                            Performance                                                                    3
                                                                            Quarterly Top Contributor/Detractors                                           4
                                                                            Performance Attribution                                                        5
                                                                            Performance Attribution by Region                                              6
                                                                            Attribution Commentary                                                          7
                                                                            Significant Transactions                                                       8
                                                                            GICS Sector Breakdown                                                          9
                                                                            Relative Sector Breakdown                                                     10
                                                                            Relative Country, Region, Developed/Emerging Breakdown                         11
                                                                            Top Ten Holdings Investment Premise                                           12
                                                                            Portfolio Holdings by GICS Sector                                             13
                                                                            Portfolio Holdings by Country                                                 14
                                                                            Reports                                                                       15
                                                                               Schedule of Investments

1
As of March 31, 2021
    K Invest Globale Aktier II                                                                                                                                                                                          Reporting Currency: DKK

    Portfolio Characteristics                                                                                                                                  Summary of Activities
                                                                     Account            MSCI ACWI Index                                                        Portfolio Value on December 31, 2020                       1,246,463,818.96 DKK
    # of Equity Securities / % of Net Assets                        56 / 97.4%                 -                                                                     Contributions                                                181,033,609.15
    Median Market Cap                                          123.10 billion DKK       72.28 billion DKK
                                                                                                                                                                     Withdrawals                                                  -90,563,300.36
    Weighted Average Market Cap                              1,603.84 billion DKK 1,894.16 billion DKK
                                                                                                                                                                     Dividends and Interest                                            -10,268.53
    Inception Date                                            December 21, 2020                  -
    Net Assets                                                  1.35 billion DKK                 -                                                                   Management Fees                                                          0.00

                                                                                                                                                                     Appreciation/Depreciation                                       9,647,473.14
    Monthly Performance (Net %) for Quarter Ended March 31, 2021
                                                                                                                                                               Portfolio Value on March 31, 2021                          1,346,571,332.36 DKK

                             Account                  MSCI ACWI Index
    January                   2.22                         0.18
    February                   5.92                          2.39
    March                     -6.30                          6.05

    Portfolio Review and Outlook
    The first quarter of 2021 saw a perceptible shift in market leadership from growth to value. At the same time, the “reopening trade,” or rotation away from the work-from-home stocks, picked up steam. Though this has little to do with
    how we make investment decisions, we believe it partially explains our recent underperformance. Index returns were driven by energy, bank stocks, airlines, cruise lines, and hotels – areas we typically do not invest in -- while many of the
    work-from-home beneficiaries (i.e., companies enabling digital transformation, some of which we have owned for years) sold off. After enjoying a favorable investing environment over the last four years, we think it is fair to point out this
    headwind, which, while challenging, was not entirely unexpected. That said, we have no intention of adjusting the portfolio in response to these headwinds. The reasons are rooted in our investment philosophy and process and how we
    execute it in circumstances like these.
        • We focus on big ideas – companies we believe to be beneficiaries of disruptive change – which are rarely found in the industries benefiting from the reopening. Brick and mortar retailers, for example, will see more short-term
               foot traffic but will continue to be structurally disrupted by e-commerce.
        • We are long-term investors with focus on duration of growth. If our research suggests a company has sustainable competitive advantages that will enable it to compound its intrinsic value over the long term, we will exercise
               patience, even during periods of underperformance.
        • We believe all investing is value-based – everything else is speculation. We invest only when companies are trading at 20% discounts (or more) to our estimate of intrinsic value. Because we prioritize businesses we believe will
               compound their intrinsic value over the long term, we are willing to hold them when they are fairly valued, or even modestly overvalued, to allow fundamentals to catch up to the stock price.
        • As long-term investors we do not equate risk to market volatility. We define risk as probability of permanent loss of capital. As a result, we do not attempt to manage market volatility through cash management or sector
               rotation. There is nothing wrong with either; it is simply not a part of our process or skill set.
    While the recent changes in market leadership have been unfavorable to the businesses we favor, we are not all that concerned. We think rotations, pullbacks, and corrections are generally necessary and healthy and often create
    attractive opportunities for long-term investors like us. The more important development, in our view, has been the steady rise in interest rates. Besides offering a bit of an alternative to savers, higher interest rates make fast growing
    companies more expensive since future earnings must be discounted back at higher rates. Having said that, the Fed has said that it intends to keep interest rates low until at least 2023. And as the saying goes: “don’t fight the Fed,”
    especially, as in this case, when the government is helping with fiscal stimulus.

                                                                                                                                                                                                                                    BARON®
2                                                                                                                                                                                                                                   CAPITAL
As of March 31, 2021
    K Invest Globale Aktier II                                                                                                                                                                                         Reporting Currency: DKK

    Performance

                                                                                                                                                                                                 ¹

                                                                            Total Returns(%)                                                 Annualized Returns(%)
                                                                                                                                                                                       Since Inception1
                                                                     1st Q 2021         Year to Date            1 Year             3 Years            5 Years            10 Years
                                                                                                                                                                                         12/21/2020
                                                                   Return +        - Return +         - Return +          - Return +          - Return +          - Return +         - Return + -
    K Invest Globale Aktier II                                       1.45              1.45               N/A                 N/A                 N/A                 N/A               -0.43
    MSCI ACWI Index                                                  8.77     -7.32      8.77    -7.32       N/A                 N/A                N/A                 N/A               10.67 -11.10
    The blue shading represents portfolio outperformance vs. the corresponding benchmark. The yellow shading represents underperformance.

    1- The account performance is calculated on a time-weighted basis and is net of fees.
    The MSCI ACWI Index Net(DKK) measures the equity market performance of large and mid-cap securities across developed and emerging markets. The MSCI indexes and the Funds include reinvestment of dividends, net
    of withholding taxes, which positively impact the performance results.
    The performance data quoted represents past performance. Past performance is no guarantee of future results. Current performance may be lower or higher than the performance data quoted.
                                                                                                                                                                                                                               BARON®
3                                                                                                                                                                                                                              CAPITAL
As of March 31, 2021
    K Invest Globale Aktier II                                                                                                                                                                     Reporting Currency: DKK

    Quarterly Contribution to Return¹
    By Sub-Industry                                                                                              By Holdings
                                                                                                                 Top Contributors                                         Average Weight(%)             Contribution(%)
                                                                                                                 Alphabet Inc.                                                   4.32                         0.83
                                                                                                                 10X Genomics, Inc.                                              1.98                         0.58
                                                                                                                 Facebook, Inc.                                                  3.42                         0.43
                                                                                                                 Fiverr International Ltd.                                       2.76                         0.39
                                                                                                                 Coupang, LLC                                                    0.26                         0.39
                                                                                                                 Top Detractors                                           Average Weight(%)             Contribution(%)
                                                                                                                 RingCentral, Inc.                                               3.16                        -0.50
                                                                                                                 StoneCo Ltd.                                                    1.63                        -0.44
                                                                                                                 TAL Education Group                                             1.70                        -0.39
                                                                                                                 Pinduoduo Inc.                                                  1.62                        -0.34
                                                                                                                 GDS Holdings Limited                                            3.00                        -0.34

    Contributors                                                                                                 Detractors
    • Alphabet Inc. is the parent company of Google, the world’s largest search and online advertising           • RingCentral, Inc. provides global cloud communications and collaboration solutions across multiple
      company. Shares rose in the quarter on strong fourth quarter results that saw continued recovery in ad       channels (voice, video, and messaging). Despite continued solid execution with revenue
      spend and accelerated cloud revenue growth. We remain highly convicted in Alphabet's merits as it            acceleration, RingCentral’s stock corrected during the quarter as the market rotated out of fast growing
      continues to benefit from growth in mobile and online video advertising, which accrues to its core           stocks. With its distribution advantage and the pandemic crystalizing the need for a communications
      assets of search, YouTube, and the Google ad network. Alphabet's investments in AI, autonomous               platform that is agile, scalable, and global, RingCentral remains early in penetrating its addressable
      driving (Waymo), and life sciences (Verily, Calico) provide additional optionalities for growth.             market, which we think should drive sustainable growth for years to come.
    • 10X Genomics, Inc. sells products combining hardware, software, and chemistry to offer life sciences       • StoneCo Ltd. is a leading financial technology services company in Brazil. Shares declined on results that
      researchers single cell, spatial, and in situ views of biological systems. Shares performed well for the     were weaker than analyst forecasts coupled with macro factors, including a steep devaluation in the
      quarter. There continues to be growing excitement about the company’s position on the cutting edge           Brazilian real and a resurgence of COVID-19 in Brazil, which will likely impact near-term payment
      of research, with a strong core competency in single-cell analysis and continued innovation in               volumes in Stone's core small and medium-sized enterprise segment. We believe Stone has the best
      launching new instruments and product lines. We see a future for applications in clinical diagnostics as     value proposition for clients through its solutions in payments, software, and e-commerce, driving
      well.                                                                                                        higher lifetime customer value and market share gains vs. peers.
    • Shares of Facebook, Inc., the world’s largest social network, were up on robust fourth quarter results     • TAL Education Group is a leading K-12 after-school tutoring company in China with over 900 learning
      driven by strong ad pricing growth and tailwinds to newer shopping and payments products from                centers in 91 cities. Shares declined during the first quarter following rumors of upcoming regulatory
      rapidly increasing e-commerce adoption. In our view, Facebook continues to utilize its leadership in         changes that investors fear will adversely impact the after-school tutoring industry in China. We
      mobile to provide global advertisers targeted marketing capabilities at scale, with substantial              continue to hold our shares while awaiting official announcements that will allow us to assess our
      monetization opportunities ahead across its various assets including WhatsApp, video tools including         position in the stock.
      Watch and IG TV, and community-based marketplace, shopping, jobs, and dating features.

    1 - Sources: FactSet PA and BAMCO.

                                                                                                                                                                                                              BARON®
4                                                                                                                                                                                                             CAPITAL
As of March 31, 2021
    K Invest Globale Aktier II                                                                                                                                                                                  Reporting Currency: DKK

    Quarterly Performance Attribution¹
    When reviewing performance attribution on our portfolio, please be aware that we construct the portfolio from the bottom up, one stock at a time. Each stock is included in the portfolio if it meets our
    rigorous investment criteria. To help manage risk, we are aware of our sector and security weights, but we do not include a holding to achieve a target sector allocation or to approximate an index. Our
    exposure to any given sector is purely a result of our stock selection process

                                                Comm.         Consumer Consumer                                                                           Information
    Sector Average Weights(%)                   Services     Discretionary Staples                 Energy         Financials      Health Care Industrials Technology      Materials   Real Estate   Utilities     Total²
    K Invest Globale Aktier II                     9.90           23.91               -                -              1.51            19.55             0.29      40.62       -          1.65          -          100.00
    MSCI ACWI Index                                9.44           13.03              6.98             3.30           13.88            11.62             9.68      21.69      4.98        2.54         2.86        100.00
    Over/Underweight                               0.46           10.88            -6.98            -3.30           -12.37             7.93            -9.39      18.93     -4.98        -0.89       -2.86           -
    Total Return(%)
    K Invest Globale Aktier II                   14.66             -2.74              -                -              1.52             6.90          -12.40       -2.20       -          -2.94         -            1.51
    MSCI ACWI Index                              10.91              6.40             3.19           22.43            15.91             4.48            11.80       5.87    10.64        10.28         4.63          8.77
    Relative Return                                3.75            -9.13           -3.19           -22.43           -14.39             2.42          -24.20       -8.07   -10.64       -13.22        -4.63         -7.26

    Return calculations are transaction based and are calculated from the underlying security-level data; they may not correspond with performance information.
    1 - Sources: FactSet PA and BAMCO.
    2 - Includes: cash, fees and unassigned securities.

                                                                                                                                                                                                                           BARON®
5                                                                                                                                                                                                                          CAPITAL
As of March 31, 2021
    K Invest Globale Aktier II                                                                                                                                                                                           Reporting Currency: DKK

    Quarterly Performance Attribution by Region1
    When reviewing performance attribution, please be aware that we construct the portfolio from the bottom up, one stock at a time. Each stock is included in the portfolio if it meets our
    rigorous investment criteria. To help manage risk, we are aware of our sector and security weights, but we do not include a holding to obtain a sector distribution to resemble an index. Our
    exposure to any given region is a result of our stock selection process.

                                                 2

                                                 0

                                                -2

                                                -4

                                                -6

                                                -8
                                                           Africa/Mideast          Asia/Pacific ex Japan               Europe                       Japan                  Latin America              North America                Total²

                                                                                         Value Added from Sector Weights                     Value Added from Stock Selection                     Total Value Added

    Sector Average Weights (%)                             Africa/Mideast          Asia/Pacific ex Japan               Europe                       Japan                  Latin America               North America               Total²
    K Invest Globale Aktier II                                   5.69                       17.40                        8.07                         --                         9.70                       56.88                  100.00
    MSCI ACWI Index                                              1.26                       14.08                       17.04                        6.74                        1.11                       59.77                  100.00
    Over/Underweight                                             4.42                        3.31                       -8.97                       -6.74                        8.59                       -2.89                    --

    Total Return (%)
    K Invest Globale Aktier II                                  15.31                       -1.64                        6.82                         --                        -14.79                       2.89                   1.51
    MSCI ACWI Index                                             13.75                        6.85                        8.21                        5.65                       -2.29                        9.84                   8.77
    Relative Return                                              1.57                       -8.49                       -1.39                       -5.65                       -12.50                      -6.95                   -7.26

    Sources: FactSet PA and BAMCO.
    Return calculations are transaction based and are calculated from the underlying security-level data; they may not correspond with published performance information.
    1 - Region levels are provided by MSCI, Inc. Baron has reclassified the country classifications provided by MSCI for certain securities. These country weights are not official MSCI weights. Some stocks are classified
        by Baron and not by MSCI.
    2 - Includes cash, fees, and unassigned securities.

6
As of March 31, 2021
    K Invest Globale Aktier II                                                                                                                                                Reporting Currency: DKK

    Quarterly Attribution Commentary

    K Invest Globale Aktier II underperformed the MSCI ACWI Index in the first quarter due to stock selection and, to a lesser extent, differences in sector/sub-
    industry weights. Style biases also hampered relative results, driven by overexposure to the poor performing momentum factor and underexposure to the
    strong performing earnings yield factor.

    Adverse stock selection in North America accounted for nearly half of the underperformance in the period, driven by investments in the U.S. Negative
    stock selection in Latin America, led by Brazilian equities, and higher exposure to this underperforming region also hurt relative performance. Lastly,
    underperformance of Chinese equities weighed on relative results in the Asia/Pacific ex Japan region.

    On a sector level, lack of exposure to the lagging Consumer Staples sector and outperformance of online advertising company Alphabet Inc. in
    Communication Services added the most value. Alphabet’s shares were up sharply after the company’s quarterly results surprised to the upside given the
    continued recovery in advertising spend and accelerating cloud revenue growth.

    Investments in Information Technology (IT), Consumer Discretionary, and Industrials; limited exposure to Financials, where banks were up sharply; and lack
    of exposure to the strong performing Energy sector detracted the most from relative results. Within IT, RingCentral, Inc., GDS Holdings Limited, Splunk,
    Inc., CrowdStrike, Inc., Snowflake Inc., and several others were negatively impacted by the swift rotation from growth into value during the quarter.
    Payment platforms StoneCo Ltd. and PagSeguro Digital Ltd. also weighed on performance as deteriorating market conditions in Brazil caused investors to
    reduce their exposure. Lastly, meaningfully higher exposure to underperforming software and internet services & infrastructure stocks, which were last
    year’s market darlings, also hampered relative performance. Negative stock selection in Consumer Discretionary was partly driven by Chinese K-12 after-
    school tutoring company TAL Education Group, e-commerce platform Pinduoduo Inc., and Latin American digital marketplace MercadoLibre, Inc. TAL was
    the third largest detractor on an absolute basis following rumors of upcoming regulatory changes that investors fear will adversely impact the after-school
    tutoring industry in China. Shares of Pinduoduo and MercadoLibre were down as investors rotated out of last year’s COVID-19 lockdown beneficiaries and
    into stocks perceived to benefit from economic reopening and normalization. Brazilian education companies Afya Limited and Arco Platform Limited also
    hindered performance in the sector. Within Industrials, lower exposure to this better performing sector and share price losses from Polish e-commerce
    enablement platform InPost SA hurt relative results.

    The discussion of market trends is not intended as advice to any person regarding the advisability of investing in any particular security. The views expressed in this
    presentation reflect those of the respective speaker. Some of our comments are based on management expectations and are considered “forward-looking statements.”
    Actual future results, however, may prove to be different from our expectations. Our views are a reflection of our best judgment at the time and are subject to change
    at any time based on market and other conditions and Baron has no obligation to update them.
                                                                                                                                                                                      BARON®
7                                                                                                                                                                                     CAPITAL
As of March 31, 2021
    K Invest Globale Aktier II                                                                                                                                                Reporting Currency: DKK

    Significant Transactions
    Top Net Purchases for the Quarter Ended March 31, 2021                                                          Top Net Sales for the Quarter Ended March 31, 2021
                                                                                                                                                            Quarter End
                                                                                                                                                            Market Cap or
                                                                Quarter End            Amount              Ending                                            Market Cap     Amount         Ending
                                                                Market Cap            Purchased            Weight                                            When Sold        Sold         Weight
                                                                 (billions)           (millions)            (%)                                               (billions)    (millions)      (%)

    Alphabet Inc.                                                  8,833.4                17.4              5.7     Slack Technologies Inc.                     153.8         13.3           --

    BridgeBio Pharma, Inc.                                           58.2                 16.9              1.3     PTC Therapeutics                            21.1           3.9          0.9

    Coupang, LLC                                                     536.9                11.6              1.3     PagSeguro Digital Ltd.                      96.3           1.9           1.0

    GDS Holdings Limited                                              96.1                 9.5              2.8     MercadoLibre, Inc.                          465.7          1.6           3.2

    Facebook, Inc.                                                 5,320.2                 7.4              4.1     StoneCo Ltd.                                119.9          1.1           1.3

    Portfolio holdings are subject to change. Current and future portfolio holdings are subject to risk.
    Sources: FactSet PA & BAMCO.

8
As of March 31, 2021
    K Invest Globale Aktier II                                                                                                                                                                                                     Reporting Currency: DKK

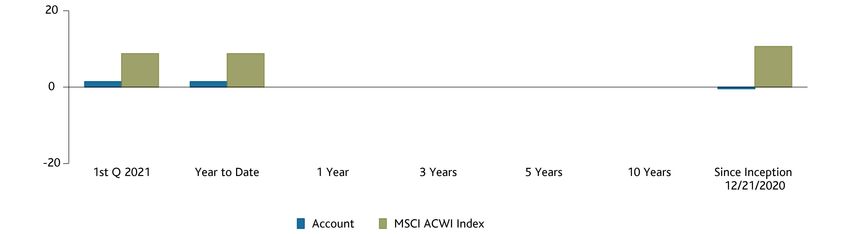
    GICS Sector Breakdown¹                                                                                                                         Top 15 GICS Sub-Industry Breakdown¹

    Top 10 Holdings                                                                               % of Net Assets
    Alphabet Inc.                                                                                                         5.7
    Alibaba Group Holding Limited                                                                                         4.7
    Amazon.com, Inc.                                                                                                      4.6
    Facebook, Inc.                                                                                                        4.1
    MercadoLibre, Inc.                                                                                                    3.2
    Acceleron Pharma Inc.                                                                                                 3.1
    Twilio Inc.                                                                                                           3.0
    GDS Holdings Limited                                                                                                  2.8
    Wix.com Ltd.                                                                                                          2.7
    RingCentral, Inc.                                                                                                     2.7
    Total                                                                                                               36.6                       Colors of Sub-Industry bars correspond to GICS Sector Breakdown chart.

    1 - Industry sector or sub-industry group levels are provided from the Global Industry Classification Standard (“GICS”), developed and exclusively owned by MSCI, Inc. (“MSCI”) and Standard & Poor’s Financial Services LLC
    (“S&P”). All GICS data is provided “as is” with no warranties. The Adviser may have reclassified/classified certain securities in or out of a sub-industry. Such reclassifications are not supported by S&P or MSCI.
                                                                                                                                                                                                                                           BARON®
9                                                                                                                                                                                                                                          CAPITAL
As of March 31, 2021
     K Invest Globale Aktier II                                                                                                                      Reporting Currency: DKK

     Relative Sector Breakdown
                                                    Portfolio (%)   Benchmark (%)                                   Underweight/Overweight
     Information Technology                             38.9            21.3                                                                                            17.6
     Consumer Discretionary                             22.8            12.8                                                                       10.0
     Health Care                                        20.0            11.4                                                                 8.6
     Communication Services                             12.0             9.4                                                           2.6

     Unclassified                                       0.5              --                                                      0.5

     Real Estate                                         1.3             2.6                                             -1.3

     Utilities                                           --              2.9                                      -2.9

     Energy                                              --              3.4                                     -3.4

     Materials                                           --              5.0                              -5.0

     Consumer Staples                                    --              7.0                       -7.0

     Industrials                                        0.4             10.0                -9.6

     Financials                                          1.5            14.3        -12.8

     Cash & Cash Equivalents                            2.6              --

     Figures may not sum to 100% due to rounding.
     Sector allocations are subject to change.
     Sources: FactSet PA and BAMCO.

10
As of March 31, 2021
     K Invest Globale Aktier II                                                                                                                                                                                       Reporting Currency: DKK

     Relative Country, Region, Developed/Emerging Breakdown                                             Variation in Ending
                                                               Portfolio (%)        Benchmark (%)             Weight                                                                              Underweight/Overweight
     North America                                                 58.2                   60.5                   -2.3
           United States                                           54.9                   57.7                   -2.8
                                                                                                                                            North America                                           -2.3
           Canada                                                   3.3                    2.8                   0.5
     Asia/Pacific ex Japan                                          16.9                  13.5                   3.4
           China                                                    13.9                   4.9                   9.0
           India                                                    1.5                    1.3                   0.3                  Asia/Pacific ex Japan                                                                  3.4
           Korea                                                    1.2                    1.7                   -0.5
           Indonesia                                                0.2                    0.2                    0.1
           Other Asia/Pacific ex Japan Exposure                      --                    5.4                   -5.4
     Latin America                                                  8.4                    1.1                   7.3                          Latin America                                                                         7.3
           Brazil                                                   4.0                    0.6                   3.4
           Argentina                                                4.4                    0.1                   4.2
           Other Latin America Exposure                              --                    0.4                   -0.4
     Europe                                                         8.3                   17.1                   -8.8                                Europe                         -8.8
           Netherlands                                              5.5                    1.1                   4.4
           United Kingdom                                           2.4                    3.8                   -1.3
           Poland                                                   0.4                    0.1                   0.3
           Other Europe Exposure                                     --                   12.1                  -12.1                       Africa/Mideast                                                                    4.4
     Africa/Mideast                                                 5.7                    1.3                   4.4
           Israel                                                   5.7                    0.2                   5.5
           Other Africa/Mideast Exposure                             --                    1.1                   -1.1
     Japan                                                           --                    6.5                   -6.5                                  Japan                               -6.5
           Japan                                                     --                    6.5                   -6.5
     Cash & Cash Equivalents                                        2.6                     --                   2.6

     Developed                                                      71.8                  86.9                  -15.1                            Developed           -15.1

     Emerging                                                      25.6                   13.1                   12.5                              Emerging                                                                               12.5

     Region and country levels are provided by MSCI, Inc. Baron has reclassified the country classifications provided by MSCI for certain securities. These country weights are not official MSCI weights. Some stocks are
     classified by Baron and not by MSCI.
     Allocations are subject to change.
     Figures may not sum to 100% due to rounding.
     Sources: FactSet PA and BAMCO.
11
As of March 31, 2021
     K Invest Globale Aktier II                                                                                                                                                                                                Reporting Currency: DKK

     Top 10 Holdings
     Company                                       Investment Premise                                                                   Company                                   Investment Premise
     Alphabet Inc. (GOOG) is the world's           Alphabet is the largest beneficiary of a secular shift in advertising from           Acceleron Pharma Inc. (XLRN) is a         We think Luspatercept will be a $2+ billion peak sales drug.
     most dominant online search provider          all other media to online and mobile. Alphabet has processed and                     biotechnology company developing a        Acceleron is also developing a drug for pulmonary atrial
     and offers a variety of other services and    indexed more data than any other company, and its leadership position                drug called Luspatercept for the          hypertension that we think will help expand the company's
     products including display advertising,       in artificial intelligence allows Alphabet to leverage its large data sets           treatment of serious and chronic          revenue base in years to come. Given the scarcity value of having
     Android, Chrome, Google Cloud, Google         to quickly improve its products. Subsidiaries GCP and Waymo provide                  anemias. Acceleron has partnered with
                                                                                                                                                                                  two blockbuster drugs in its pipeline, we view Acceleron as a rare
     Maps, Google Play, and YouTube. Its           key exposure to cloud and autonomous driving. We believe Alphabet                    Celgene, which is managing commercial
                                                                                                                                                                                  high-quality asset.
     Other Bets segment consists of                has the greatest collection of engineering talent of any company we                  responsibilities for Luspatercept and
     businesses such as CapitalG, GV, and          cover, which should allow it to grow and innovate for years to come.                 paying Acceleron a royalty north of
     Verily.                                                                                                                            20%.
     Alibaba Group Holding Limited (BABA) is       With over 757 million active buyers and over 10 million merchants, we                Twilio Inc. (TWLO) is a leading           Twilio offers a solid value proposition to developers and organizations
     the largest e-commerce company in the         believe Alibaba is poised to benefit disproportionately from the                     Communications Platform as a              by reducing the cost of integrating communications into software
     world. Alibaba owns and operates the          increased penetration of internet, mobile, and e-commerce in China. It               Service company offering a set of         while increasing by a few orders of magnitude the speed with which it
     two largest online shopping platforms in      enjoys more than 70% market share of all e-commerce transactions in                  APIs (Application Programming             can be done. With just a few lines of code, customers can use Twilio's
     China, Taobao and Tmall, as well as a         China, and we expect it to continue growing revenue at a rate of more                                                          API instead of buying hardware, negotiating with telcos, and writing
                                                                                                                                        Interfaces) that help developers
     33% stake in Ant Financial, which is the      than 20% for years to come. We also see significant positive                                                                   code that is not core to the organization. Twilio benefits from digital
                                                                                                                                        embed communications into their
     country's dominant payments platform.         optionality in Alibaba's cloud computing, data management, and                                                                 transformation trends that are leading enterprises to increasingly
                                                                                                                                        software.
                                                   electronic payment platforms.                                                                                                  embed communications into their software, creating a multi-billion-
                                                                                                                                                                                  dollar opportunity.
     Amazon.com, Inc. (AMZN) is an e-              Amazon's market share of U.S. online retail sales is over 30% while its share of     GDS Holdings Limited (GDS) is a           We believe that as the preferred provider to Alibaba and Tencent,
     commerce pioneer, innovator, and              global online retail sales is less than 5%. Amazon has numerous avenues for new      market-leading China-based operator of    GDS is poised to benefit from the exploding growth in cloud
     market share leader, with relentless focus    revenue growth opportunities, including consumer staples, apparel, international     data centers with over 50 data centers,
                                                   expansion, digital media offerings, office and industrial supplies, private label,                                             computing in China. Cloud adoption is still in the early stages in
     on providing value and convenience to its                                                                                          five markets, and approximately           China, and GDS is capturing more than its fair share of
                                                   pharmacy services, and advertising. Given our view that Amazon Web Services
     customers. It also operates the industry-                                                                                          320,000 square meters in service. More
                                                   will account for over 50% of Amazon's value over time, we believe Amazon                                                       incremental deployments due to its proven track record and
     leading cloud infrastructure business         represents a unique opportunity to invest in the secular growth of both online       than 50% of its revenue comes from top
                                                                                                                                                                                  carrier-neutral value proposition.
     Amazon Web Services.                          retail and cloud computing.                                                          Chinese internet companies.
     Facebook, Inc. (FB) is the world's largest    Facebook is a unique social platform whose users continue to demonstrate             Wix.com Ltd. (WIX) provides               Wix is a leading do-it-yourself website-design software, targeting a
     social network, with over 2.74                stickiness and high engagement. Advertisers want to be where users are, and          software to help micro-businesses         large market, as most businesses use professional website
     billion monthly active users and              Facebook's ability to analyze, target, and show clear, demonstrable, and rising                                                development services. We think Wix has strong competitive
                                                   returns on investment makes the platform particularly attractive to them. We         build and maintain websites and
     over 1.82 billion daily active users.                                                                                              operate their businesses. Wix has         advantages, driven by product innovation, data-drive distribution and
                                                   believe the company is still in the middle innings of monetizing its vast customer
     Instagram, Messenger, WhatsApp, and                                                                                                                                          leading brand. Wix's technological edge, supported by over 1,000
                                                   base, especially internationally. In addition, we see significant positive           over 200 million registered users and
     Oculus are also part of the Facebook          optionality from eventual monetization opportunities in search, video,                                                         R&D personnel, results in fast iteration with first-to-market features
                                                                                                                                        over 5.5 million premium users.
     network.                                      publishing, WhatsApp, Messenger, and Oculus.                                                                                   and vertical offerings. Wix's recently introduced do-it-for-me
                                                                                                                                                                                  solutions open a large new TAM for it to address.
     MercadoLibre, Inc. (MELI) is the largest e-   MercadoLibre is an exciting Latin American growth story benefiting                   RingCentral, Inc. (RNG) provides global   RingCentral is a leader in unified communications as a service, a
     commerce company in Latin America.            from the emergence of two secular trends: e-commerce and digital                     enterprise cloud communications and       phone/video/collaboration/contact center in the cloud. The company, which
     The company operates the MercadoLibre         payments. The company has a significant first mover advantage and is                 collaboration software, a unified         has about three million users, is in the early stages of disrupting the on-
     e-commerce marketplace; Mercado                                                                                                    solution across multiple locations and    premises communications market, which serves hundreds of millions of
                                                   investing aggressively to widen its competitive moat. Latin America is a
                                                                                                                                                                                  information workers, representing a total addressable market of more than
     Pago, a payments solution; and Mercado        predominantly cash-based economy with e-commerce penetration                         devices that allows for communications
                                                                                                                                                                                  $100 billion. We think its differentiated strategy as an open platform
     Envios, which offers shipping solutions       under 5%, and MercadoLibre has an attractive asset-light marketplace                 across multiple channels, including       integrating best-of-class partners, high service quality, and exclusive
     for sellers on the company’s                  business model. We believe its logistics network will become a key                   voice, video, collaboration,              distribution agreements should sustain Ring Central's growth for years to come.
     marketplace.                                  competitive advantage at scale, and we see a significant opportunity in              conferencing, online meetings, and fax.
                                                   Mercado Pago off-platform.

                                                                                                                                                                                                                                           BARON®
12                                                                                                                                                                                                                                         CAPITAL
As of March 31, 2021
     K Invest Globale Aktier II                                                                                                                                                                                Reporting Currency: DKK

     Portfolio Holdings by GICS Sector
     Top 10 holdings are highlighted

                                                            Market Cap      Portfolio                                             Market Cap   Portfolio                                          Market Cap     Portfolio
                                                             (bn DKK)       Weight (%)                                             (bn DKK)    Weight (%)                                          (bn DKK)      Weight (%)
             Communication Services                                            12.0           Health Care (Cont'd)                                  -       Information Technology (Cont'd)                            -
               Alphabet Inc.                                  8,833.4           5.7             argenx SE                            89.6         2.3         Dynatrace Holdings LLC                  86.5          1.8
               Facebook, Inc.                                 5,320.2           4.1             Illumina, Inc.                      355.4         2.3         Shopify Inc.                           866.1          1.7
               ZoomInfo Technologies Inc.                        121.3          2.0             10X Genomics, Inc.                  124.9         2.1         Nuvei Technologies Corp.                 52.8         1.6
               Sea Limited                                      723.8           0.2             Veeva Systems Inc.                  252.3         1.9         Snowflake Inc.                          411.7         1.4
               Kuaishou Technology Co., Ltd.                    916.2           0.0             Guardant Health, Inc.                97.2         1.7         ASML Holding N.V.                    1,642.8          1.3
             Consumer Discretionary                                            22.8             Zai Lab Limited                      75.0         1.6         StoneCo Ltd.                           119.9          1.3
               Alibaba Group Holding Limited                  3,899.1           4.7             Schrodinger, Inc.                    33.9         1.4         Cloudflare, Inc.                       137.6          1.2
               Amazon.com, Inc.                               9,883.2           4.6             BridgeBio Pharma, Inc.               58.2         1.3         Bill.com Holdings, Inc.                  75.9         1.2
               MercadoLibre, Inc.                               465.7           3.2             Arrowhead Pharmaceuticals, Inc.      43.7         1.0         Globant, S.A.                            52.7          1.1
               Fiverr International Ltd.                         49.4           2.5             PTC Therapeutics                      21.1        0.9         PagSeguro Digital Ltd.                  96.3          1.0
               Meituan Inc.                                   1,432.8           2.1             MaxCyte, Inc.                         6.4         0.4         Zscaler, Inc.                          148.0          1.0
               TAL Education Group                              205.1           1.4           Industrials                                         0.4         Datadog, Inc.                          162.0          0.8
               Pinduoduo Inc.                                 1,045.1           1.3             InPost SA                             51.9        0.4         Okta, Inc.                             183.5          0.7
               Coupang, LLC                                     536.9           1.3           Information Technology                             38.9         BigCommerce Holdings, Inc.               27.2         0.4
               Afya Limited                                      11.0            1.1            Twilio Inc.                          368.5        3.0         nCino Inc.                              39.9          0.0
               Arco Platform Limited                              9.3           0.7             GDS Holdings Limited                   96.1       2.8       Materials                                                  -
             Consumer Staples                                                      -            Wix.com Ltd.                           99.9       2.7       Real Estate                                             1.3
             Energy                                                                -            RingCentral, Inc.                     171.0       2.7         Opendoor Technologies Inc.              77.6          1.3
             Financials                                                         1.5             EPAM Systems, Inc.                   141.4        2.7       Unclassified                                            0.5
               Bajaj Finance Limited                            269.2           1.5             Endava plc                             29.5       2.4         ION Acquisition Corp 1 Ltd.              3.8          0.4
             Health Care                                                       20.0             CrowdStrike, Inc.                    259.2        2.4         Sarissa Capital Acquisition Corp.        1.6          0.1
               Acceleron Pharma Inc.                             52.1           3.1             Splunk, Inc.                         139.0        1.8       Utilities                                                  -
                                                                                                Adyen N.V.                           430.5        1.8       Cash & Cash Equivalents                                 2.6

      Portfolio holdings may change over time.
      Figures may not sum to 100% due to rounding.
      If portfolio holdings show a 0.0% weighting, that holding has a 0.05% or lower weighting.
                                                                                                                                                                                                                           BARON®
13                                                                                                                                                                                                                         CAPITAL
As of March 31, 2021
     K Invest Globale Aktier II                                                                                                                                                                           Reporting Currency: DKK

     Portfolio Holdings by Country
     Top 10 holdings are highlighted

                                                            Market Cap      Portfolio                                         Market Cap   Portfolio                                         Market Cap    Portfolio
                                                             (bn DKK)       Weight (%)                                         (bn DKK)    Weight (%)                                         (bn DKK)     Weight (%)
             Argentina                                                          4.4           Israel                                          5.7       United States (Cont'd)
               MercadoLibre, Inc.                              465.7            3.2             Wix.com Ltd.                     99.9         2.7        Illumina, Inc.                        355.4          2.3
               Globant, S.A.                                    52.7             1.1            Fiverr International Ltd.        49.4         2.5        10X Genomics, Inc.                    124.9          2.1
             Brazil                                                             4.0             ION Acquisition Corp 1 Ltd.       3.8         0.4        ZoomInfo Technologies Inc.             121.3         2.0
               StoneCo Ltd.                                    119.9            1.3           Korea                                           1.2        Veeva Systems Inc.                    252.3          1.9
               Afya Limited                                     11.0             1.1            Coupang, LLC                    536.9         1.3        Splunk, Inc.                          139.0          1.8
               PagSeguro Digital Ltd.                           96.3            1.0           Netherlands                                     5.5        Dynatrace Holdings LLC                  86.5         1.8
               Arco Platform Limited                             9.3            0.7             argenx SE                         89.6        2.3        Guardant Health, Inc.                   97.2         1.7
             Canada                                                             3.3             Adyen N.V.                       430.5        1.8        Snowflake Inc.                         411.7         1.4
               Shopify Inc.                                    866.1            1.7             ASML Holding N.V.              1,642.8        1.3        Schrodinger, Inc.                       33.9         1.4
               Nuvei Technologies Corp.                         52.8            1.6           Poland                                          0.4        Opendoor Technologies Inc.              77.6         1.3
             China                                                             13.9             InPost SA                        51.9         0.4        BridgeBio Pharma, Inc.                  58.2         1.3
               Alibaba Group Holding Limited                 3,899.1            4.7           United Kingdom                                  2.4        Cloudflare, Inc.                      137.6          1.2
               GDS Holdings Limited                             96.1            2.8             Endava plc                       29.5         2.4        Bill.com Holdings, Inc.                 75.9         1.2
               Meituan Inc.                                  1,432.8            2.1           United States                                  54.9        Arrowhead Pharmaceuticals, Inc.         43.7         1.0
               Zai Lab Limited                                  75.0            1.6             Alphabet Inc.                 8,833.4         5.7        Zscaler, Inc.                         148.0          1.0
               TAL Education Group                             205.1            1.4             Amazon.com, Inc.              9,883.2         4.6        PTC Therapeutics                        21.1         0.9
               Pinduoduo Inc.                                1,045.1            1.3             Facebook, Inc.                5,320.2         4.1        Datadog, Inc.                         162.0          0.8
               Kuaishou Technology Co., Ltd.                   916.2            0.0             Acceleron Pharma Inc.             52.1        3.1        Okta, Inc.                            183.5          0.7
             India                                                              1.5             Twilio Inc.                     368.5         3.0        BigCommerce Holdings, Inc.              27.2         0.4
               Bajaj Finance Limited                           269.2            1.5             RingCentral, Inc.                171.0        2.7        MaxCyte, Inc.                            6.4         0.4
             Indonesia                                                          0.2             EPAM Systems, Inc.              141.4         2.7        Sarissa Capital Acquisition Corp.        1.6         0.1
               Sea Limited                                     723.8            0.2             CrowdStrike, Inc.               259.2         2.4        nCino Inc.                              39.9         0.0
                                                                                                                                                        Cash & Cash Equivalents                               2.6

      Portfolio holdings may change over time.
      Figures may not sum to 100% due to rounding.
      If portfolio holdings show a 0.0% weighting, that holding has a 0.05% or lower weighting.
                                                                                                                                                                                                                    BARON®
14                                                                                                                                                                                                                  CAPITAL
Reports

               BARON®
15             CAPITAL
As of March 31, 2021
     K Invest Globale Aktier II                                                                                                                       Reporting Currency: DKK

     Schedule of Investments

                                                                     CUSIP/                                                                          Pct of   Unrealized
                  Quantity Security                                  SEDOL       Ticker    Unit Cost     Total Cost        Price    Market Value     Assets          G/L
     Common Stock                                                                                       1,280,519,101                1,312,013,344
         Communication Services                                                                          139,937,295                  161,738,337
               Interactive Home Entertainment                                                              3,200,167                    3,187,424
                         2,251 Sea Limited                           81141R100   SE          1,421.66      3,200,167     1,416.00       3,187,424       0.2       -12,743
               Interactive Media & Services                                                              136,737,128                  158,550,913
                         5,852 Alphabet Inc. - Cl C                  02079K107   GOOG       11,204.51     65,568,780    13,121.84      76,788,992       5.7    11,220,211
                        29,514 Facebook, Inc.                        30303M102   FB          1,669.94     49,286,525     1,868.28      55,140,340       4.1     5,853,815
                           632 Kuaishou Technology Co., Ltd.         BLC90T0     1024.HK       91.82          58,030      220.31          139,233       0.0        81,203
                        85,376 ZoomInfo Technologies Inc.            98980F104   ZI           255.62      21,823,792      310.18       26,482,348       2.0     4,658,556
         Consumer Discretionary                                                                          313,011,960                  306,943,708
               Education Services                                                                         51,997,082                   41,311,863
                       119,538 Afya Limited                          BKF9D57     AFYA         143.42      17,143,787      117.92       14,096,043       1.1     -3,047,744
                        54,688 Arco Platform, Ltd. - Class a         BGQT8T7     ARCE         227.56      12,444,897      160.74        8,790,437       0.7     -3,654,459
                        53,941 TAL Education Group - ADR             874080104   TAL          415.42      22,408,398      341.58       18,425,383       1.4     -3,983,015
               Internet & Direct Marketing Retail                                                        261,014,878                  265,631,845
                        44,040 Alibaba Group Holding Limited - ADR   01609W102   BABA        1,528.88     67,331,700     1,438.21      63,338,551       4.7     -3,993,149
                         3,176 Amazon.com, Inc.                      023135106   AMZN       19,333.76     61,404,025    19,626.52      62,333,837       4.6       929,812
                        53,648 Coupang, LLC                          22266T109   CPNG         217.09      11,646,404      313.04       16,793,937       1.3     5,147,533
                        24,600 Fiverr International Ltd.             M4R82T106   FVRR        1,251.91     30,796,928     1,377.63      33,889,625       2.5     3,092,697
                       113,350 Meituan Inc. - Class B                BGJW376     3690.HK      216.40      24,528,671      247.54       28,058,680       2.1     3,530,009
                         4,664 MercadoLibre, Inc.                    58733R102   MELI       10,150.21     47,340,594     9,338.15      43,553,141       3.2     -3,787,452
                        20,800 Pinduoduo Inc. - ADR                  722304102   PDD          863.78      17,966,556      849.23       17,664,074       1.3      -302,483
         Financials                                                                                       19,219,034                   20,413,331
               Consumer Finance                                                                           19,219,034                   20,413,331
                        45,456 Bajaj Finance Limited                 BD2N0P2     BAF.IN       422.81      19,219,034      449.08       20,413,331       1.5     1,194,297
         Health Care                                                                                     252,261,485                  269,360,247
               Biotechnology                                                                             136,528,595                  137,320,861
                        48,991 Acceleron Pharma Inc.                 00434H108   XLRN         781.44      38,283,322      860.21       42,142,457       3.1     3,859,134
                        17,907 argenx SE - ADR                       04016X101   ARGX        1,865.07     33,397,885     1,746.87      31,281,158       2.3     -2,116,727

                                                                                                                                                              BARON®
16                                                                                                                                                            CAPITAL
As of March 31, 2021
     K Invest Globale Aktier II                                                                                                                    Reporting Currency: DKK

     Schedule of Investments

                                                                CUSIP/                                                                            Pct of   Unrealized
                   Quantity Security                            SEDOL       Ticker      Unit Cost     Total Cost        Price    Market Value     Assets          G/L
     Common Stock                                                                                    1,280,519,101                1,312,013,344
         Health Care                                                                                  252,261,485                  269,360,247
               Biotechnology                                                                          136,528,595                  137,320,861
                       32,049 Arrowhead Pharmaceuticals, Inc.   04280A100   ARWR           463.73      14,862,184      420.62       13,480,479       1.0     -1,381,704
                       43,222 BridgeBio Pharma, Inc.            10806X102   BBIO           390.21      16,865,509      390.74       16,888,746       1.3        23,237
                       39,771 PTC Therapeutics                  69366J200   PTCT           392.44      15,607,826      300.35       11,945,335       0.9     -3,662,492
                       25,500 Zai Lab Limited -Adr              98887Q104   ZLAB           686.74      17,511,868      846.38       21,582,686       1.6     4,070,818
               Health Care Technology                                                                  42,610,795                   44,313,745
                       38,700 Schrodinger, Inc.                 80810D103   SDGR           451.62      17,477,823      483.93       18,727,957       1.4     1,250,134
                       15,440 Veeva Systems Inc. Cl - A         922475108   VEEV          1,627.78     25,132,972     1,657.11      25,585,788       1.9       452,816
               Life Sciences Tools & Services                                                          73,122,095                   87,725,641
                       25,062 10X Genomics, Inc.                88025U109   TXG            907.95      22,754,944     1,148.13      28,774,390       2.1     6,019,446
                       23,900 Guardant Health, Inc.             40131M109   GH             743.48      17,769,213      968.30       23,142,301       1.7     5,373,088
                       12,776 Illumina, Inc.                    452327109   ILMN          2,198.22     28,084,406     2,436.19      31,124,745       2.3     3,040,340
                       60,870 MaxCyte, Inc.                     BYVJZ42     MXCT.LN         74.15       4,513,532       76.95        4,684,204       0.4       170,673
         Industrials                                                                                    6,544,628                    5,670,797
               Air Freight & Logistics                                                                  6,544,628                    5,670,797
                       54,585 InPost SA                         BN4N9C0     INPST.NA       119.90       6,544,628      103.89        5,670,797       0.4      -873,831
         Information Technology                                                                       520,435,231                  523,576,320
               Application Software                                                                    86,902,033                   77,624,472
                       17,500 Bill.com Holdings, Inc.           090043100   BILL           854.53      14,954,321      922.94       16,151,500       1.2     1,197,179
                        1,000 nCino Inc.                        63947U107   NCNO           455.39         455,394      423.22          423,222       0.0       -32,172
                       19,240 RingCentral, Inc.                 76680R206   RNG           2,201.54     42,357,722     1,889.53      36,354,505       2.7     -6,003,216
                       28,736 Splunk, Inc.                      848637104   SPLK          1,013.87     29,134,596      859.38       24,695,245       1.8     -4,439,351
               Data Processing and Outsourced Services                                                 79,408,378                   76,813,262
                        1,724 Adyen N.V.                        BZ1HM42     ADYEN.NA     13,836.12     23,853,464    14,154.35      24,402,106       1.8       548,642
                       55,558 Nuvei Technologies Corp.          67079A102   NVEI/U.CN      348.01      19,334,710      383.77       21,321,306       1.6     1,986,596
                       46,807 Pagseguro Digital Ltd             G68707101   PAGS           320.75      15,013,168      293.69       13,746,864       1.0     -1,266,305
                       44,660 StoneCo Ltd.                      G85158106   STNE           474.86      21,207,035      388.33       17,342,986       1.3     -3,864,049

                                                                                                                                                           BARON®
17                                                                                                                                                         CAPITAL
As of March 31, 2021
     K Invest Globale Aktier II                                                                                                                     Reporting Currency: DKK

     Schedule of Investments

                                                                    CUSIP/                                                                         Pct of   Unrealized
                  Quantity Security                                 SEDOL       Ticker    Unit Cost     Total Cost       Price    Market Value     Assets          G/L
     Common Stock                                                                                      1,280,519,101               1,312,013,344
         Information Technology                                                                         520,435,231                 523,576,320
               Internet Services & Infrastructure                                                       102,220,620                 102,256,753
                         12,900 BigCommerce Holdings, Inc.          08975P108   BIGC         424.86       5,480,746     366.64        4,729,654       0.4      -751,092
                         58,431 GDS Holdings Limited - ADR          36165L108   GDS          580.84      33,938,999     514.37       30,055,396       2.2     -3,883,604
                        120,800 Gds Holdings Limited - Local Cl A   BMG40P4     9698.HK       68.88       8,320,340      64.55        7,797,199       0.6      -523,141
                          3,301 Shopify Inc.                        82509L107   SHOP        6,545.19     21,605,669    7,018.81      23,169,079       1.7     1,563,410
                         20,611 Wix.com Ltd.                        M98068105   WIX         1,595.02     32,874,865    1,771.16      36,505,425       2.7     3,630,561
               IT Consulting & Other Services                                                            69,656,294                  83,940,433
                         60,830 Endava plc -ADR                     29260V105   DAVA         445.77      27,116,439     537.21       32,678,475       2.4     5,562,036
                         14,301 EPAM Systems, Inc.                  29414B104   EPAM        2,013.51     28,795,155    2,516.30      35,985,661       2.7     7,190,506
                         11,600 Globant, S.A.                       BP40HF4     GLOB        1,184.89     13,744,699    1,316.92      15,276,297       1.1     1,531,597
               Semiconductor Equipment                                                                   13,128,944                  18,013,917
                          4,600 ASML Holding N.V.                   B908F01     ASML        2,854.12     13,128,944    3,916.07      18,013,917       1.3     4,884,972
               Systems Software                                                                         169,118,963                 164,927,483
                         37,000 Cloudflare, Inc.                    18915M107   NET          495.41      18,330,215     445.68       16,490,040       1.2     -1,840,175
                         27,700 CrowdStrike Holdings, Inc.          22788C105   CRWD        1,063.86     29,469,006    1,157.71      32,068,472       2.4     2,599,466
                         20,008 Datadog, Inc. - Class A             23804L103   DDOG         615.65      12,317,834     528.65       10,577,158       0.8     -1,740,675
                         77,344 Dynatrace, Inc.                     268150109   DT           253.36      19,595,505     306.00       23,667,139       1.8     4,071,634
                          6,800 Okta, Inc.                          679295105   OKTA        1,551.73     10,551,784    1,398.24       9,508,050       0.7     -1,043,735
                         13,300 Snowflake Inc.                      833445109   SNOW        1,998.49     26,579,930    1,454.38      19,343,259       1.4     -7,236,672
                         18,500 Twilio Inc. (Class A Shares)        90138F102   TWLO        2,098.78     38,827,382    2,161.53      39,988,229       3.0     1,160,846
                         12,200 Zscaler Inc                         98980G102   ZS          1,102.24     13,447,307    1,088.95      13,285,138       1.0      -162,169
         Real Estate                                                                                     21,215,360                  17,809,650
               Real Estate Services                                                                      21,215,360                  17,809,650
                        132,499 Opendoor Technologies Inc.          683712103   OPEN         160.12      21,215,360     134.41       17,809,650       1.3     -3,405,709
         Unclassified                                                                                     7,894,109                   6,500,953
               Unclassified                                                                               7,894,109                   6,500,953
                         85,365 ION Acquisition Corp 1 Ltd.                     IACA          80.84       6,901,296      64.13        5,474,479       0.4     -1,426,816

                                                                                                                                                            BARON®
18                                                                                                                                                          CAPITAL
As of March 31, 2021
     K Invest Globale Aktier II                                                                                                                      Reporting Currency: DKK

     Schedule of Investments

                                                                   CUSIP/                                                                           Pct of   Unrealized
                  Quantity Security                                SEDOL       Ticker   Unit Cost     Total Cost        Price   Market Value        Assets          G/L
     Common Stock                                                                                    1,280,519,101               1,312,013,344
         Unclassified                                                                                    7,894,109                   6,500,953
               Unclassified                                                                              7,894,109                   6,500,953
                         3,225 ION Acquisition Corp 1 Ltd.         G49392122   IACA/U       70.18         226,338       65.97         212,753          0.0       -13,585
                        11,845 Sarissa Capital Acquisition Corp.   G7823W128   SRSAU        64.71         766,475       68.70         813,721          0.1        47,245
     CASH AND CASH EQUIVALENTS                                                                         34,557,989                  34,557,989          2.6

     PORTFOLIO TOTALS                                                                               1,315,077,089 DKK           1,346,571,332 DKK      100

                                                                                                                                                             BARON®
19                                                                                                                                                           CAPITAL
Long Term Investors · Research Driven

      We invest in people, not just buildings
     We invest in companies solving problems
            We invest for the long run

       767 Fifth Avenue • New York, NY 10153
You can also read