Odyssean Investment Trust PLC - Q1 2021 Update
←
→
Page content transcription
If your browser does not render page correctly, please read the page content below
Odyssean Investment Trust PLC

                Q1 2021 Update
Disclaimer The sole purpose of this document is to provide information on Odyssean Capital LLP and its underlying investment strategy. The information contained in this document is strictly confidential and is intended for the named recipient only. The unauthorised use, disclosure, copying, alteration or distribution of this document is strictly prohibited and may be unlawful. The information is not intended to form (and should not therefore be relied upon as forming) the basis of any investment decision. The information does not constitute an offer, the solicitation of an offer, or an invitation or recommendation to sell or to buy any financial interest and neither this document nor anything contained in it shall form the basis of, or act as an inducement to enter any contract or commitment whatsoever. Odyssean Capital LLP is authorised and regulated by the FCA and, as such, is subject to the restriction in section 238 of FSMA on the promotion of unregulated schemes. Accordingly, in the United Kingdom, this Information is only being communicated to and is directed only at: (i) persons falling within any of the categories of “Investment Professionals” as defined in article 14(5) of the FSMA (Promotion of Collective Investment Schemes) (Exemption) Order 2001 (the “CIS Promotion Order”) and being persons having professional experience participating in unregulated schemes; (ii) persons falling within any of the categories of persons described in article 22(2) of the CIS Promotion Order; (iii) persons falling within the categories of “Certified High Net Worth Individuals”, “Certified Sophisticated Investors” or “Self‐certified Sophisticated Investors” as described in articles 21, 23 and 23A of the CIS Promotion Order respectively; (iv) persons falling within the categories of persons described in COBS 4.12 in the FCA Handbook of rules and guidance; and (v) any person to whom it may otherwise lawfully be made. Persons of any other description should not act or otherwise rely upon this Information. To comply with FCA Rules we are obliged to provide the following risk warnings: No representation or warranty, either expressed or implied, is or will be made or given and no responsibility or liability is or will be accepted by Odyssean Capital LLP or by any of their respective directors, officers, employees, members, agents or advisers in relation to the accuracy or completeness of the information contained in this document or any other written or oral communications with the recipient. Any responsibility or liability for any such information is expressly disclaimed. Investments fluctuate in value and may fall as well as rise. Investors may not get back the value of their original investment and past performance is not necessarily a guide to future performance. Investors should also note that changes in rates of exchange may cause the value of investments to go up or down. Odyssean Capital LLP is a limited liability partnership incorporated in England under No OC417961. Authorised and regulated by the Financial Conduct Authority. The list of members is held at the Registered Office: 6 Stratton Street, London, W1J 8LD.
Executive Summary – Q1 2021
NAV growth c.6.6% over the period

•      NAV rose 6.6%1,2 in the period, which was less than the NSCI +AIM ex IC index (“Comparator”) which rose 9.9% 2,3
             OIT NAV broadly in line with Comparator Index excluding Retail, Travel & Leisure
             Net cash averaged 7% over the quarter, ending at c.11%
             Approaching OIT’s third anniversary since IPO, NAV return since inception of 42% vs 20% for comparator index

•      Q1 market performance driven by Retail, Travel and Leisure sectors, which accounted for 11% of the Comparator Index at the
       start of 2021. We do not invest in these sectors
             These consumer sectors delivered 3.2% points (or c.1/3) of the Comparator Index return
             We believe that many of the stocks in these sectors are pricing in CY2022 recovery/material upgrades now

•      Portfolio
             Trading updates have been positive
             One new “toehold” position made during the period
             Profits taken in a number of more highly rated holdings which have doubled over the past two years (point to point)

•      We remain positive on the medium to long term potential from the portfolio companies due to a blend of reasonably priced
       growth, self help potential and prospects for value creation from M&A

•      OIT’s shares ended the period trading at c.7.4% discount to NAV of 139.3p1,2. Discount has narrowed post the end of the
       period

•      Shareholders approved the change in OIT’s investment policies and enhanced ESG investment approach
As at 31st March 2021. Performance measured from COB 1st May 2018 Source: 1 Odyssean Capital 2 Link Asset Services 3Bloomberg. The NSCI + AIM ex Investment Company index is only used for the purposes of calculating
performance fees. The investment strategy is unconstrained and not benchmarked against any particular index. Past performance is no guarantee of future performance and the value of investments can go up and down
                                                                                                                                                                                                                         3
Investment strategy recap – neither growth nor value
Based on 3 pillars: Valuation, Quality and Engagement, with Sector focus
Target Zone Valuation
• Invest at a significant discount to owner’s valuation
• Look for businesses with multiple drivers of equity value
growth (sales; margin; rating; free cashflow; M&A)
Valuation • “Make money”, not beat an index
Quality
• Strict quality overlay to complement value focus
• “Good companies”
• Limit downside
Quality Engagement Engagement
• Seek out “self-help” /transformation situations
• Integrated
• Proactive not reactive
• Tend to engage anyway as a Top 5 shareholder
• We aim to make money (target >15% IRR on every investment) with a favourable risk/reward
• Sector focus (TMT, Healthcare, Industrials, Services)
4Performance update – approaching 3 year track record
NAV up 42% since inception vs comparator index returns of 20%
Performance %
Inception Since
Q1-21 LTM CY20 CY19
to Dec-18 inception
NAV Total Return Per Share1 +6.6% +53.5% +13.1% +22.0% -3.7% +41.7%
Share price return3 0.0% +43.3% +14.2% +17.7% -4.0% +29.0%
NSCI + AIM ex IC Total Return3 +9.9% +71.3% +4.9% +22.2% -15.0% +19.8%
Average cash balance2 7% 8% 9% 17% 65% 24%
Rebased NAV per share and share price 30% NAV per share performance vs comparator Index¹
140 vs comparator index1
25%
120 20%
15%
100
10%
80
5%
60 0%
-5%
OIT NAV NSCI&AIM OIT Share Price
• As at end March 2021, aggregate return on investments (realised and unrealised) of 19.6% IRR2 net of transaction fees
As at 31st March 2021. Performance measured from COB 1/5/18, share performance since inception assumes IPO price of 100p. Source: 1Link Asset Services, Bloomberg, Odyssean Capital; Numis Smaller Companies plus AIM
ex Investment Companies Total Return Index. Rebased to start NAV 2 Link Asset Services, Odyssean Capital 3 Bloomberg. YTD – Year to Date; LTM = Last 12 months. Past performance is no guarantee of future performance
and the value of investments can go up and down
5Performance drivers in Q1 2021
Key stock contributors
Largest positive contributors Flat performers / Largest negative contributors
• A strong set of interim results drove • A broadly positive AGM statement flagged trading
upgrades. Showed record organic growth of remained as expected but shares have retreated from
7.5% and margins of over 21% recent highs on FX concerns (USD exposure)
• Good near-term momentum in the business • Chemring remains a high quality business with strong
and strong mid-term environmental drivers positions in growth markets, unique IP and a
support ongoing performance. Shares are up management team delivering on repositioning the
c.140% since September and now enjoy a business into higher quality revenue areas
full p/e rating
• A positive AGM statement flagged strong
• Vectura delivered FY20 results ahead of initial
performance in Q1, following on from an
expectations and announced a £115m capital return
in-line full year FY20 performance
following receipt of litigation proceeds – despite this
• We see scope for COVID recovery to come shares drifted down from December highs
at RWS and crucially see significantly more
• If executed well, Vectura’s ongoing pivot to a pure
synergies from the combination with SDL
play CDMO has the potential to generate long term
than the c.£15m so far announced. We look
shareholder value. We believe that little of this
to an update on these synergies in the
potential is priced into the shares
coming weeks
• An in-line H1 showed underlying progress • A solid Q1 showed good growth and improving
with revenue growth guidance for FY21 at profitability across all areas of the business – shares
the top end of management’s range drifted down through the period
offsetting mix and FX profit headwinds
• Our key focus remains the expected launch of the
• We continue to be excited by Clinigen’s mix major new product BMK08 later this year. We see
of COVID recovery potential, new product this as a material value driver for the group, which
opportunities and management driven self- alongside a COVID recovery and improving
help, all available at a currently conditions in the shrimp market, has the potential to
undemanding rating drive an inflection in earnings
Source: Odyssean analysis. 6Portfolio
High conviction portfolio
Top portfolio holdings¹
Elementis • Top 10 holdings account for 70% of NAV
RWS
• Position in Clinigen increased through a period on
Clinigen weakness in share price
10.9% 10.6% Flowtech
• Following strong performances, NCC and Volution
9.9% Chemring were sold down during the quarter moving these
18.5%
Vectura investments out of the top 10
9.5%
Benchmark
• Cash balance built during the period with profits
Wilmington taken from investments which have run well/ahead
4.7% 7.3%
of expectations
Spire
4.8%
Euromoney • One new, initial position started during the period
5.0% (outside of the top 10) with scope to grow as
6.5% Other Equity
diligence progresses
6.0% 6.1%
Cash + Other
Source: 1 Odyssean Capital LLP, Link. as at 31st March 2021.
7Portfolio
Focused on our core sectors and core market cap range
Holding by sector 1 Holding by market cap 1
10.9%
10.9% 7.3%
5.5%
Healthcare Sub £100m
26.5%
Industrials £100m-£500m
20.9%
9.7% TMT £500m-£1bn
25.9%
Over £1bn
Business Services
Net cash
Other Equity
23.3% 24.1% Cash + Other
35.0%
• Following movements in the period, healthcare is now the • 63% of invested exposure in core target market cap range of
largest sector in the portfolio £100m-£1bn
• Profits taken from strongly performing TMT and Industrials • Growth in % of NAV in companies over £1bn market cap
positions during the quarter
driven by strong performance in certain names (a couple of
• Net cash balance of c.11% - towards the higher end of which fell just over this threshold at period end)
target range
Source: 1 Odyssean Capital LLP, Link. as at 31st March 2021
8Portfolio
Portfolio has higher proportion of international earnings than the FTSE Small Cap
Revenue exposure of portfolio¹,² Revenue exposure of FTSE Small Cap Index3
(NAV weighted exc. cash) (% sales)
16.0%
22.2%
UK UK
33.2%
US US
12.8%
Europe Other Europe / Other
22.8% 7.3% 63.9%
RoW RoW
21.9%
• Portfolio revenue generation is balanced by geographic area, which we believes spreads political risk
• OIT’s portfolio overweight international revenues and underweight UK vs FTSE Small Cap
• Little change in underlying FX exposure during quarter
Source: 1 Odyssean Capital and Link. as at 31st March 2021. 2 FactSet company filings. 3Liberum/Bloomberg as at December 2020
9Top 10 holdings summary
Niche market leaders. Often with international operations
Holding Activity Market position
Global market leader with highest quality talc and highest quality hectorite clay
Speciality chemicals
US market leader in chromium chemicals
Translation services and software Global market leader
Niche pharma services and products Global market leader in Managed Access Programmes for unlicensed drugs
Fluid power component distribution UK market leader
Global market leader in specialist countermeasures and niche detection technologies
Niche defence products and services
A UK market leader in niche defence-related cyber security
Global market leader in Salmon genetics. Global market leader in specialist
Products and services to aquaculture market
aquaculture nutrition. Global market leader in next generation sea lice treatment
Development and manufacture of inhaled drugs
Global market leader
and devices
Leader in providing data, networking and training across multiple niche, professional
Business Media Services and Products
end markets
Owner and operator of private hospitals in the
UK market leader – clear leader outside of the M25. Many sites are freehold
UK
Market leader with unique data and IP serving niche, predominantly financial services
Business Media Services and Products
markets
Source: Views and opinions of Odyssean Capital
10Our views on growth and self-help potential amongst top 10
Many of top holdings have recovery and self-help potential to augment growth
Long term organic
Holding COVID recovery potential Self-help/engagement opportunities
growth
Material as industrial cycle recovers and Plant footprint optimisation; more higher value add products;
GDP + a little
personal care destocking ends invest in salesforce
Recovery of patent translation (IP services)
Integration of SDL, delivery of synergies and efficiencies.
GDP+ business and delivery of delayed contracts in
Further M&A
other divisions
Return to normality in clinical trials drives CTS
Cashflow to reduce debt; back and mid office system
GDP+ division, backlog of cancer treatments supports
investment. New COO appointed. Reduce complexity
demand for commercial medicine products
End market recovery & market share gain from Integration of past M&A and delivery of synergies. Digital
GDP
smaller competitors strategy
GDP+ Programmes Limited with business not materially impacted
Capex to continue to improve automation and productivity
of Record & cyber by COVID
Recovery in shrimp market to improve Reorganisation largely complete. BMK08 approval and
GDP+
nutrition business Cleantreat commercialisation
Limited with business not materially impacted Cost reduction in Swiss operation. Lyon manufacturing site.
GDP+
by COVID Grow CDMO business. Balance sheet efficiency
Return of face to face business events and Technology investment in sales, CRM and centralising of data
GDP+
training to drive growth. Improve IR on a complex story
Improve predictability. Digital transition/group efficiency
GDP+? Significant due to backlog of procedures
through harmonised practices
Restructuring of Asset Management business, digital
GDP+? Return of face to face business events investment in DMI and pricing divisions. Balance sheet
Source: Views and opinions of Odyssean Capital
utilisation.
11Volution case study
A strong return, ahead of expectations, driven by multiple value drivers
• We initially invested in Volution in August 2018, seeing
multiple drivers of value growth
Volution TSR vs Comparator¹
• Growing markets supported by environmental regulation
450 Initial
purchase • Self-help opportunity to drive margin -> efficiency gains
Aug-18
TSR since 1st purchase • Attractive cash generation track record
400 FAN 100.4%
Comparator 19.4%
• Strong management team delivering successful M&A
• Rating below building materials peers and our view of fair value
350
300 • Since our initial purchase Volution has outperformed our
expectations, delivering on all five drivers of value growth.
250 Investment has delivered a partially realised gain of 1.9x and
35% IRR²
200 Initial purchase Current / FY21e ³
/FY18³
150
Organic growth c.2.4% c.7%+
EBIT margin c.18.0% c.21.0%
100 EPS c.14.5p c.19.4p
FCF yield c.5.6% c.5.5%
FAN -TSR Comparator Index M&A Active Active
PE rating c.12.6x c.19.6x
Source: Factset as at 31st March 2021
Note: 1. Comparator index is NSC+Aim ex Investment Trusts Total Return index. Charts re-based to Volution share price at end of June 2018. Past performance is no guarantee of future performance and the value of investments
can go up and down. 2. Odyssean Capital. 3. Factset consensus at March 2021. 12Technology change can create significant shareholder value
We seek out situations where systems are being upgraded and introduced
Cost reduction Gross margin improvement Sales growth
• Digital sales channel
• Finance and back office • Productivity tools
• Digital delivery of
systems • Pricing transparency
product/service
• Process automation • Allows companies to target
• CRM/Salesforce
margin gain or share gain
Examples
Examples Examples
• Clinigen
• Benchmark • Clinigen
• Euromoney
• Clinigen • NCC
• Flowtech
• Flowtech • SDL
• Spire
• NCC • Spire
• Wilmington
Effective ERP/MI system generating useful information
• Risk management of technology change at corporates is much improved in last decade
• Market leaders can afford to invest in the best systems to capitalise on and maintain their market leadership/superior economics
• Benefits often take 2-3 years to flow through to financial performance -> ideal for long term investors
Source: Odyssean Capital. Schematic reflects the views of Odyssean Capital
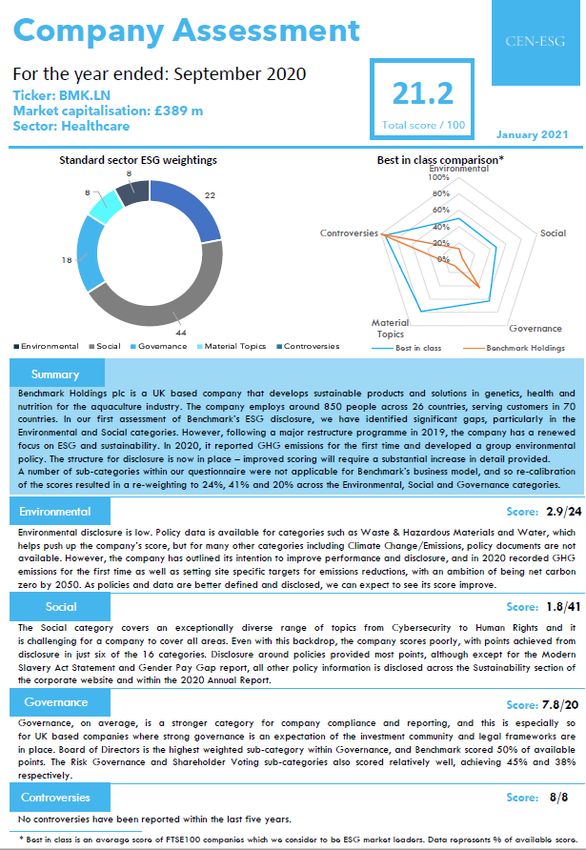
13ESG - Portfolio company voting record over Q1
Comment
Number of meetings 4
Number of resolutions 57
Number voted 57
Voted with management 54
Voted against management 3 - Authority to allot shares >10% of issued share capital where
there is no immediate need to do so
- Issuance of >10% of share capital without pre-emption rights
14ESG – progress on investment policy and engagement
Example portfolio ESG review report
• Shareholders approved changes to the investment policy to include
specific investment restrictions
• ESG related research/due diligence of existing portfolio
Third party ESG Company Assessments completed on 100% of
portfolio companies
Engagement process continues with portfolio companies, with
>90% of portfolio companies having received their reports
Two portfolio companies were existing CEN clients. One additional
portfolio company has signed up with CEN for consulting advice
Follow up calls have been had with a further six portfolio
companies to discuss their reports in detail
• We continue to believe that improved disclosure by our portfolio
companies will drive improved ESG performance over time
15ESG disclosure performance of OIT portfolio
Portfolio company range of 19-37 compared with best in class FTSE 100 of 65
ESG disclosure performance (out of 100) of portfolio companies ordered by market cap
40
35
30
25
20
15
10
5
0
A B C D E F G H I J K L M N O P Q
Company
Source: CEN ESG Advisory; Odyssean Capital. As at 31 March 2021
16Outlook & Data
Outlook
Despite the healthy recovery in the NAV post March 2020 we still see good long-term upside

Overall market conditions
      •      UK market has lagged international peers for some time
      •      Despite this, virus driven market and individual stock volatility is likely to be high in the short-term. This may lead to more
             pricing anomalies, which we hope to exploit

Opportunities & reasons to be positive
      •      UK vaccine success supports economic reopening, with significant pent up savings a sharp economic recovery is possible
      •      Accommodative fiscal and monetary policy likely to continue for now. Financial repression remains the least worst solution?
      •      Borrowing remains cheap for corporates and governments
      •      Portfolio has blend of COVID recovery potential and self help, but we believe is reasonably priced
      •      M&A returning – potential for our portfolio to be an ongoing beneficiary of this

Risks & reasons to be cautious
      •      Uncertain medium & long term changes to economy and consumer buying patterns in a post COVID world
      •      EU’s challenged vaccine programme risks a slower recovery as well as political and economic instability in the Eurozone
      •      Equity markets, especially highly rated growth stocks, are expensive and dependent on both continuing recovery as well as
             monetary policy remaining extremely benign. Continued rises in bond yields (i.e. “risk-free rate”) may lead to a re-pricing of
             equities

As at 31st March 2021
                                                                                                                                               18
Ceteris paribus, there seems more value among full list companies
We avoid highly rated “IHT business asset relief favourites” trading on AIM
Forward NTM p/e multiple by FTSE Index1 FTSE AIM premium to FTSE Small Cap Index1
25x 100%
OIT IPO
80% OIT IPO
20x
60%
15x 40%
20%
10x
0%
5x
-20%
0x -40%
Mid 250 Small Cap AIM All
• Sentiment towards UK Small and Mid Cap equities is transformed compared with a year ago
• Ratings leave little room for disappointment
1As at 1 April 2021. Source Peel Hunt. Only includes positive earning companies
19Retail, Travel & Leisure appear to have driven the market in Q1
Our investment strategy has no exposure to these sectors
Q1 2021 Total Return1 FY 2020 Total Return1
12 14
10 12
3.2 10
8
8
6
13.1
6
4
6.6 6.8 4
2 5.3
2
0 0
NAV TR Comparator NAV TR Comparator
-2 -0.4
Comparator Index ex Retail, Travel & Leisure sectors Retail, Travel & Leisure sectors
• Our investment strategy does not focus on the discretionary consumer sectors of Retail, Travel & Leisure
• These sectors in aggregate were only a marginal tailwind to OIT’s relative performance in FY 2020 but have been a more
material headwind in Q1 2021
• In Q1 2021, the Retail, Travel and Leisure sectors contributed almost 1/3 of the Comparator return, despite accounting
for 11% of the Comparator Index at the beginning of January 2021
As at 31st March 2021. Source: 1Link Asset Services, Numis Securities, Odyssean Capital; Comparator Index - Numis Smaller Companies plus AIM ex Investment Companies Total Return Index
Past performance is no guarantee of future performance and the value of investments can go up and down
20Travel and Leisure sector ratings seem to be full
Pricing in recovery/anticipation of material medium and long term upgrades
Travel and Leisure sector average EV/sales
ratings¹ • The Travel and Leisure sub-sector has been a significant
contributor to market returns in recent months
5.0x
4.0x
4.0x
3.0x 2.6x • Positive sentiment on vaccine roll out and reopening have
2.3x
2.0x
2.0x driven up shares, driving a re-rating of the sector on recovery
multiples
1.0x
0.0x
5 year average to FY1 FY2 FY3 • Shares in this sub-sector now seem to be fully pricing in a
end 2019² recovery/upgrades - ratings based on the third unreported
period (FY3 – commonly 2023) are currently above the
Travel and Leisure sector average EV/EBIT
average seen in the five years pre the pandemic
ratings¹
25.0x 21.5x
20.3x
20.0x • Delivery and upgrades over the next 3 years against market
15.7x
15.0x 12.7x expectations are required to justify ratings -> a lot is now
priced in?
10.0x
5.0x
0.0x
5 year average to FY1 FY2 FY3
end 2019²
As at 8th April 2021. Notes: 1Based on stocks included in Numis Smaller Companies Index Travel & Leisure sub-sector, ratio presented is median for stocks where data is available. All data based on Factset consensus. FY1 = first
unreported year, FY2 = Second unreported year, FY3 = third unreported year. ² Five year average of next twelve months financial performance
21Sectors we focus on
We focus on four key sectors we know well
• We believe the best investment decisions are made from a Odyssean: view of main sectors
base of knowledge and experience
High
Low Sector
B2B focus ROCE/cash
• We focus on sectors where the team has expertise and where cyclicality expertise
margins
we have successfully made money
TMT ◕ ◕ ● ●
• Our core sector focus is driven by our investment approach Services ◕ ● ● ●
− TMT: software managed services and niche electronics
Healthcare ● ◕ ◕ ●
− Services: Higher value-add “white collar” and tech enabled services
− Healthcare: Services, not speculative pharma/biotech
Industrials ◐ ● ◐ ●
− Industrials: Niche, high IP products
Financials ◐ ◐ ● ◐
• Companies with the following characteristics best suit our
investment approach: Consumer ◔ ○ ◐ ◐
Low cyclicality Property ◔ ◐ ◔ ◐
B2B focus
High/improving ROCE/cash margins Resources ○ ◐ ◔ ○
In-house sector expertise
Sectors we focus on
22Corporate Engagement
Goal to augment returns from stock selection
• We use engagement to create, defend or recover value • Operational efficiency • Fixed assets
and to deliver differentiated returns • R&D allocation •
•
IP maximisation
Capex allocation
Asset
• The investment team has more than 15 years experience • Difficult to
Margins /
efficiency utilisation • Focus
engaging with smaller companies •
manage
Difficult to • Objectives
understand
• Team members are well networked and believe that Complexity Poor / no
strategy
persuasion with superior knowledge and understanding
achieves the best results
ENGAGEMENT
• Peers are often open to supporting an engaged Governance
& pay Bad M&A
shareholder with change proposals
• Board static/not
fit for purpose “E&S Investor • Geared, transformational deals
• Historic focus on Governance/financial performance • Misaligned disclosure” relations tend to destroy value
incentives • Lack of integration
• Small bolt-ons less expensive &
less risky
• Increasing focus on Environmental and Social disclosure
• Poor ESG ratings due to lack of • Lack of IR strategy
and performance disclosure • Poor financial disclosure/liquidity
• Enhanced disclosure drives
improvement in E&S performance
23Portfolio construction
Our strategy is more similar to Private Equity than other Public Equity funds
Typical Long Only Odyssean Strategy Typical Private Equity
Number of positions 50-100 Up to 25 10-15
Typical position size 1% 3-8% at cost, max 20% 10%
Typical holding period Variable 3-5 years 3-5 years
Due diligence Light to Medium Medium to High High/Forensic
Typical target ownership 0.5-3% 2-20% Majority/Supermajority
Sectors Own most/All Focus on a few Focus on a few
Control No control Influencing stake Full control
Approach to risk Diversification & tracking error Focus & due diligence Focus & due diligence
Investment mindset Outperform index Absolute return Absolute return
Engagement Negligible Medium/High Medium/High
Typical cash balance 0-5% 8-12% n/a
24Odyssean Investment Trust - key company facts
NAV £123m
Shares in issue 87,982,211
Domicile UK Full listing, London Stock Exchange
Board Fully independent. Owns c.1% of issued share capital. Will use all fees, post tax, to buy shares
Internally managed small scope UK registered AIFM. Portfolio Management delegated to
AIFM
Odyssean Capital
Opportunity for shareholders to rollover or realise all of their investment at NAV less costs, every
7th year post IPO (May 2018)
Discount control/realisation opportunity
50% of profit from takeovers to be used to buy back shares if the average discount exceeds 5%
for 60 days prior to exit
No structural gearing envisaged. Ability to gear up to 10% for short term liquidity purposes. Net
Gearing
cash balances likely to be maintained to enable agile purchases of blocks of stock
Management fee lower of 1.0% of net assets/market capitalisation. Performance fee 10% of NAV
Fees TR outperformance vs (comparator index +1% p.a.) on a rolling three year basis with a high water
mark. 50% of performance fees paid in shares/used to buy shares if at a discount
Comparator index Numis Smaller Companies ex Investment Trusts plus AIM index1
Ticker OIT
ISIN GB00BFFK7H57
As at 4th June 2020. 1This index is only used for the purposes of calculating performance fees. The investment strategy is unconstrained and not benchmarked against any particular index
25
As at 31st March 2021OIT shareholder base
As at 31st March 20211
Shareholder base by investor type Disclosable shareholders
Cazenove Capital
1.9% 1.0%
Harwood Capital
Wealth Manager Brewin Dolphin
8.6% 15.7%
Connected Parties Ian Armitage
8.8% 33.1%
Retail Investors Investec Wealth
15.5%
Institutions Close Asset Mgt
56.8%
Raymond James
22.9% Portfolio Managers
3.1% 8.1%
Hargreaves
Board 3.4% Lansdown
7.6%
3.5% 6.4% Charles Stanley
Other
3.6%
Source: 1 Equiniti as at 31st March 2021, Odyssean Capital LLP
26Contact details
Portfolio Manager Distribution Partner
Odyssean Capital LLP Frostrow Capital LLP
6 Stratton Street 25 Southampton Buildings
London London
W1J 8LD WC2A 1AL
www.odysseancapital.com www.frostrow.com
Stuart Widdowson David Harris
Tel: 07710 031620 Tel: 020 3008 4910
Email: info@odysseancapital.com Email: info@frostrow.com
27You can also read