Embassy Office Parks REIT - 4Q FY2019 Investor Materials May 28, 2019
←
→
Page content transcription
If your browser does not render page correctly, please read the page content below

Embassy Office Parks REIT
4Q FY2019 Investor Materials
May 28, 2019

                               1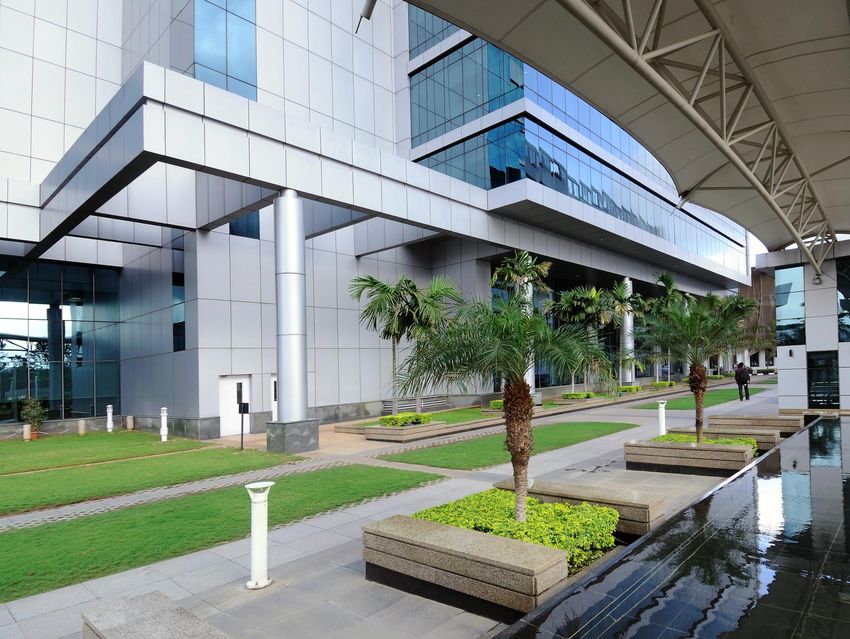
4Q FY2019 Investor Materials

Disclaimer
This presentation is prepared for unitholders and issued by Embassy Office Parks Management Services Private Limited (the “Manager”) in its capacity as the
Manager of the Embassy Office Parks REIT (“Embassy REIT”), for general information purposes only, without regards to the specific objectives, financial situation
or requirements of any particular person. This presentation may not be copied, published, distributed or transmitted, in whole or in part, for any purpose, and should
not be construed as legal, tax, investment or other advice.
This presentation does not constitute a prospectus, placement document, offering circular or offering memorandum and is not an offer or invitation or
recommendation or solicitation or inducement to buy or sell any securities including any securities of: (i) the Embassy Office Parks REIT, its holdcos, SPVs and
investment entities; or (ii) its Sponsors or any of the subsidiaries of the Sponsors, nor shall part, or all, of this presentation form the basis of, or be relied on, in
connection with, any contract or investment decision in relation to any securities.
Unless otherwise stated in this presentation, the information contained herein is based on management information and estimates. The information contained
herein is only current as of its date, has not been independently verified and may be subject to change without notice. Please note that the recipient will not be
updated in the event the information in the presentation becomes stale, and also that past performance is not indicative of future results. The Manager assumes no
responsibility to publicly amend, modify or revise any forward-looking statements, on the basis of any subsequent development, information or events, or otherwise.
The Manager, as such, makes no representation or warranty, express or implied, as to, and does not accept any responsibility or liability with respect to, the
fairness, accuracy, completeness or correctness of the content of this presentation including any information or opinions contained herein. Any opinions expressed
in this presentation or the contents of this presentation are subject to change without notice. Neither the delivery of this presentation nor any further discussions of
the Manager with any of the recipients shall, under any circumstances, create any implication that there has been no change in the affairs of the Embassy Office
Parks REIT since the date of this presentation.
This presentation contains forward-looking statements based on the currently held beliefs, opinions and assumptions of the Manager. Forward-looking statements
involve known and unknown risks, uncertainties and other factors, which may cause the actual results, financial condition, performance, or achievements of the
Embassy Office Parks REIT or industry results, to differ materially from the results, financial condition, performance or achievements expressed or implied by such
forward-looking statements. Given these risks, uncertainties and other factors, recipients of this presentation are cautioned not to place undue reliance on these
forward-looking statements. The Manager disclaims any obligation to update these forward-looking statements to reflect future events or developments. In addition
to statements which are forward looking by reason of context, the words ‘may’, ‘will’, ‘should’, ‘expects’, ‘plans’, ‘intends’, ‘anticipates’, ‘believes’, ‘estimates’,
‘predicts’, ‘potential’ or ‘continue’ and similar expressions identify forward-looking statements.
By attending/reading this presentation the recipient acknowledges that the recipient will be solely responsible for its own assessment of the market and the market
position of the Embassy Office Parks REIT and that the recipient will conduct its own analysis and be solely responsible for forming its own view of the potential
future performance of the business of the Embassy Office Parks REIT. This presentation may not be all inclusive and may not contain all of the information that the
recipient considers material. The distribution of this presentation in certain jurisdictions may be restricted by law. Accordingly, any persons in possession of this
presentation should inform themselves about and observe any such restrictions.
None of the Embassy Office Parks REIT, the Manager, the Sponsors of the Trustee or any of their respective affiliates, advisers or representatives accept any
liability whatsoever for any loss howsoever arising from any information presented or contained in this presentation. Furthermore, no person is authorized to give
any information or make any representation which is not contained in, or is inconsistent with, this presentation. Any such extraneous or inconsistent information or
representation, if given or made, should not be relied upon as having being authorized by or on behalf of the Embassy Office Parks REIT, its holdcos, SPVs and
investment entities or the Manager. Investors are advised to consult their investment advisor before making an investment decision.

THIS PRESENTATION DOES NOT CONSTITUTE OR FORM ANY PART OF ANY OFFER, INVITATION OR RECOMMENDATION TO PURCHASE OR
SUBSCRIBE FOR ANY SECURITIES IN THE UNITED STATES OR ELSEWHERE.

                                                                                                                                                                 2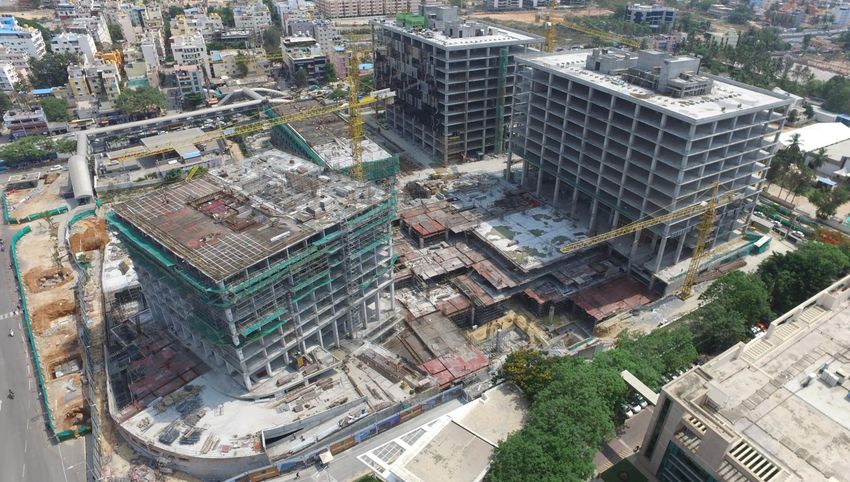
4Q FY2019 Investor Materials

Table of Contents
 I.            Key Highlights               4

 II.           Overview                     9

 III.          Market Outlook               14

 IV.           Commercial Office Update     18

 V.            Development Update           23

 VI.           Hospitality & Other Update   28

 VII.          Financial Update             32

 VIII.         Looking Ahead                36

 IX.           Appendix                     38

                                                 3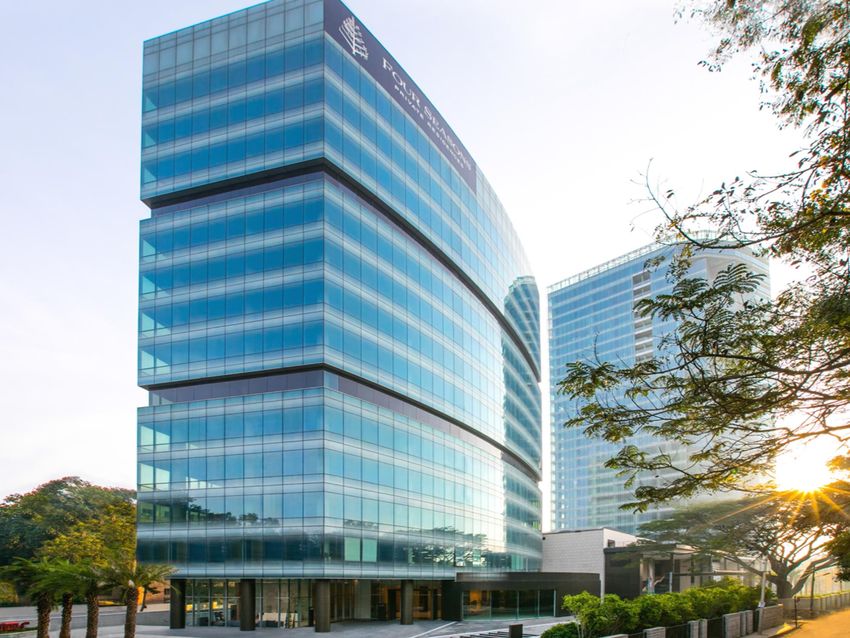
4Q FY2019 Investor Materials

I. Key Highlights

Embassy Manyata, Bengaluru
4Q FY2019 Investor Materials
I. Key Highlights

Who We Are: Quick Facts
  We run a commercial office portfolio that serves as essential corporate infrastructure to multinational
  tenants

          33 msf                                      160+                           94.3%
           Portfolio                                Blue-chip                       Occupancy
                                                     tenants
                                                                                                           Noida (9%)

                11                                    1,096                         100 MW
       Commercial                                  Hotel Keys                       Solar Park
         Offices

                                                                                                 Mumbai (16%)

             31%                                       43%                          7 Years
                                                                                                       Pune (14%)
    Mark-to-Market                              Gross Rents                           WALE
       Upside                                   from Fortune
                                                 500 Clients

                                                                                                                Bengaluru (61%)

 ₹316,124 mn                                 ₹18,771 mn                              < 15%
             GAV(1)                            Revenue from                         Gross Debt
                                                Operations                           to GAV(2)

Notes: City wise split by % of GAV
(1)   As per CBRE March 2019 valuation                                                                                            5
(2)   Factoring ₹37,100 mn issue proceeds utilized for repayment of existing debt
4Q FY2019 Investor Materials
I. Key Highlights
Listing Overview
Listing of Embassy Office Parks REIT was a landmark transaction and first of its kind in India
Key Transaction Highlights
First REIT to list on Indian stock exchanges
Largest REIT in Asia by square footage (33 msf total portfolio area)
Initial Public Offering
₹47,500 mn Strong Sponsor commitment; no sell-down in IPO
Listed Strong endorsement by international and domestic investors
April 1, 2019
Transaction 2.6x subscribed; 3.1x on Non-Institutional portion
Ticker:
NSE: EMBASSY
BSE: 542602 Priced against backdrop of global equity volatility and Indian elections
Key Metrics
Use of issue proceeds of ₹47,500 mn(1):
Issue price per Unit (₹)(1) 300
o Repay Existing Debt – ₹37,100 mn
Market Cap (₹ mn)(2) 231,500
o Acquisition of Embassy One Assets – ₹4,682 mn
Offer price to Day 1 4.9%
o General Corporate Purposes – ₹3,918 mn
Offer price to Week 1 9.5%
o Issue Expenses – ₹1,800 mn
Offer price to Current(3) 16.0%
Notes:
(1) Based on “Final Offer Document” dated March 27, 2019 6
(2) Market Capitalization upon listing on April 1, 2019
(3) Computed as of May 24, 2019
4Q FY2019 Investor Materials
I. Key Highlights
Business Highlights for FY2019
Active asset management has driven strong performance in FY2019
94.3% occupancy on 24.8 msf completed commercial office
1.8 msf of new leasing
Leasing
0.9 msf of renewals
34.9% re-leasing spreads on 1.2 msf area re-leased
Delivered 0.5 msf T3 at Embassy Oxygen, 91.7%(1) pre-leased
Development
2.4 msf under various stages of development across Embassy Manyata and Embassy Oxygen
Four Seasons Hotel launched in May 2019
Hospitality & Others 619 keys Hilton hotels under development at Embassy Manyata with target completion of 3Q FY2022
100 MW Embassy Energy Solar plant stabilized during the year
Refurbished food courts at Embassy Oxygen and Embassy Golflinks
Asset Upgrades /
Refurbishment Flyover and 220 KVA sub-station works at Embassy Manyata and façade upgrade at Embassy 247
underway
Recognition “Commercial Property of the Year” by ET Now to Embassy Manyata
Notes:
(1) Including hard options of 110k sf 7
4Q FY2019 Investor Materials
I. Key Highlights

Financial Highlights for FY 2019
  Revenue from operations for FY2019 rose 16% YoY, NOI & EBITDA margins for FY2019 were at 84%
  and 81% respectively

                            FY2019 (mn) FY2018 (mn)                              Variance %                                                                   Revenue (₹ mn)

                                                                                                                                                                                 18,771
  Revenue
  From       ₹18,771                                   ₹16,118                       +16%
  Operations                                                                                                                                  16,118

                                                                                                                                             FY2018                              FY2019
  NOI                          ₹15,741                 ₹13,539
                                                                                     +16%                                                                          NOI (₹ mn)
  Margin (%)                       84%                     84%                                                                                                                   15,741

                                                                                                                                              13,539

  EBITDA                       ₹15,137                 ₹13,604
                                                                                     +11%
  Margin (%)                       81%                     84%
                                                                                                                                             FY2018                              FY2019
Notes:
(1)    Given Embassy REIT was listed on April 1, 2019; Condensed Combined Financial Statements have been prepared for year ended March 31, 2019 on a voluntary basis                      8
(2)    NDCF, Distribution and Distribution per Unit not provided above as this financials pertains to period prior to the listing of Embassy REIT
(3)    Above results exclude Revenue, NOI and EBITDA from Embassy Golflinks since our stake is 50%. Embassy Golflinks revenue is ₹3,498 mn and EBITDA is ₹3,189 mn for FY 2019
4Q FY2019 Investor Materials

II. Overview

Embassy Techzone, Pune
4Q FY2019 Investor Materials
II. Overview
What We Do: Our Strategy
Maximize distributions and NAV per Unit through organic growth & new acquisitions
4
Prudent Capital
Management
3
First-mover Acquisition Build leverage
Advantage selectively
2
Use strong balance
Deliver on Development 42.8 msf of ROFO
1 sheet to drive accretive
opportunity from
growth through
Embassy Sponsor
Powerhouse Leasing Deliver 7.9 msf on-
disciplined acquisitions
campus development Pan-India acquisitions
Quarterly distributions
potential from 3rd parties
with minimum 90% of
94.3% occupancy Proactive pre-leasing
Capitalize on NDCF(1) to be
across portfolio strategy to de-risk new
fragmented office distributed
development
Experienced on-ground market
Low expenses and fees
teams & hands-on Select infrastructure
upgrade and execute enhancing Unitholders’
approach to lease-up
ancillary projects value
Consistently deliver (hotels, flyovers etc.) to
mark-to-market upside increase barriers to
Best-in-class tenant entry
engagement
Proactive asset management to drive value
Notes:
(1) Net Distributable Cash Flow 104Q FY2019 Investor Materials
II. Overview
Our Markets
Portfolio well positioned in India’s four key office markets
Embassy REIT markets represent 75% of India’s office
absorption
72%
Of India’s Grade A office stock concentrated in
Embassy REIT markets
Others
25%
Bengaluru
32%
32%
Absorption growth since CY2013 for % of absorption for top 7 Indian
Embassy REIT markets cities (1)
Pune
11%
803 bps NCR
Mumbai 16%
Increase in occupancy since CY2013 for 16%
Embassy REIT markets
Source: CBRE Research 2019, Embassy REIT. India’s top 7 cities include Mumbai, NCR, Bengaluru, Pune, Chennai, Hyderabad and Kolkata
Notes: 11
(1) Absorption for period CY2013 to 1Q CY20194Q FY2019 Investor Materials
II. Overview
Our Tenant Base
Global business with a diversified portfolio across established & growth sectors
Industry Diversification (1) 42% of Gross Rents originate from Top 10 Tenants(2)
Others Top 10 % of
9% Technology Sector
Tenants Rentals
49%
Research,
Consulting & IBM Technology 13%
Analytics
9% Cognizant Technology 10%
Cerner Healthcare 3%
Research, Consulting &
PwC 2%
Analytics
NOKIA Telecom 2%
Financial JP Morgan Financial Services 2%
Services
14% NTT Data Technology 2%
Lowe's Retail 2%
McAfee Technology 2%
Healthcare DBS Financial Services 2%
6%
Total 42%
Telecom
5%
Retail
8%
Notes:
(1) Represents industry diversification percentages based on Embassy REIT’s share of gross rentals 12
(2) ATOS (2% of Rentals) is excluded from above table as it vacated in April 2019 from Embassy Techzone4Q FY2019 Investor Materials
II. Overview
Our Portfolio Summary
25 msf Portfolio of Grade A office assets (94% occupied, 7 years WALE and 31% MTM opportunity)
Leasable Area (msf)/Keys/MW WALE (3) Occupancy Rent (₹ psf / mth) GAV (4)
Asset Completed Development Total (yrs) (%) In-place Market (4) MTM (%) ₹ mn % of total
Embassy Manyata 11.0 3.3 14.2 7.6 99.7% 56 80 43.7% 132,813 42%
(1)
Embassy Golflinks 2.7 - 2.7 8.4 94.2% 106 143 34.8% 26,174 8%
Embassy One 0.3 - 0.3 9.8 2.0% 150 153 2.0% 5,972 2%
Bengaluru Sub-total 13.9 3.3 17.2 7.8 96.9% 65 92 40.9% 164,959 52%
Express Towers 0.5 - 0.5 4.9 94.7% 247 275 11.5% 18,849 6%
Embassy 247 1.2 - 1.2 4.1 93.1% 98 103 5.3% 17,323 5%
FIFC 0.4 - 0.4 4.6 54.7% 293 285 (2.6%) 14,957 5%
Mumbai Sub-total 2.0 - 2.0 4.4 86.6% 158 167 6.1% 51,129 16%
Embassy Techzone 2.2 3.3 5.5 6.4 84.9% 45 48 6.0% 20,586 7%
Embassy Quadron 1.9 - 1.9 6.1 91.4% 40 50 24.7% 14,610 5%
Embassy Qubix 1.5 - 1.5 5.6 100.0% 37 48 29.4% 10,253 3%
Pune Sub-total 5.5 3.3 8.8 6.1 91.1% 41 49 18.4% 45,449 14%
Embassy Oxygen 1.9 1.3 3.3 10.3 89.2% 44 54 24.0% 19,938 6%
Embassy Galaxy 1.4 - 1.4 4.0 100.0% 31 44 42.6% 8,478 3%
Noida Sub-total 3.3 1.3 4.6 7.8 93.6% 38 50 30.7% 28,416 9%
Subtotal (Office) 24.8 7.9 32.7 7.0 94.3% 63 83 30.5% 289,954 92%
(2)
Four Seasons at Embassy One 230 Keys - - - - - - - 7,983 3%
(5)
Hilton at Embassy Golflinks 247 Keys - - - 69% - - - 4,824 2%
Hilton at Embassy
- 619 Keys - - - - - - 2,581 1%
Manyata (5 & 3 star)
Embassy Energy 100MW - - - - - - - 10,782 3%
Subtotal (Infrastructure Assets) 477 Keys / 100MW 619 Keys 1096 Keys / 100MW 26,170 8%
24.8 msf / 477 Keys 32.7 msf / 1096
Total 7.9 msf / 619 Keys 316,124 100%
/ 100MW Keys / 100MW
Notes:
(1) Details included in the above table are for a 100% stake in Embassy Golflinks, except GAV which reflects only our 50% economic interest
(2) Launched in May 2019
(3) Weighted against Gross Rentals assuming tenants exercise their renewal options after the end of the initial commitment period 13
(4) As per CBRE March 2019 valuation (Embassy Golflinks which is based on 50% economic interest)
(5) Average for FY20194Q FY2019 Investor Materials III. Market Outlook Embassy One, Bengaluru
4Q FY2019 Investor Materials
III. Market Outlook
India – The Global Technology Innovation Hub
India continues to attract global corporations for large services operations due to availability of
abundant talent and cost savings; thereby leading to strong office demand
Indian IT-BPM Landscape – Foundation of Global Technology Space Occupied by Technology Sector (msf)(3)
Services $177 bn
• Information Technology • Engineering R&D (6.1% growth)
331
• BPM • Digital
Revenue
Software $136 bn
• Systems • Cybersecurity (8.3% growth)
• Enterprise • Fintech /Edtech Exports
Indian eCommerce ₹2.9 tn
• Social Shopping • Intelligence (7.9% growth)
• Voice Commerce • Digital Payments
Domestic
37
Technologies 4.14 mn
• Cloud / Robotics • Blockchain (4.3% growth)
CY2000 CY2019F
• Intelligent Automation • Reality AR/VR
Employees
Global Capability Centres (GCC) are increasingly leveraging India for shared services specific to IT, F&A, HR & procurement
With over 1,250 GCC, demand from GCC across six major Indian cities is estimated at c.30-35 msf between CY2019-21
Embassy REIT caters to this growing GCC demand
Source:
(1) Nasscom IT-BPM Sector in India 2019 (Decoding Digital) 15
(2) Colliers International Information Technology Office Services May 2019 Report (‘India – Reinventing the World’s Tech Disclosure’)
(3) CBRE Research 2019, Embassy REIT4Q FY2019 Investor Materials
III. Market Outlook
Our Markets: Commercial Office Fundamentals
Strong demand-supply fundamentals resulting in robust demand and low vacancy across our markets
Area (msf)
48 30%
25%
19.2% 34.7
32 20%
18.6% 31.7
30.4 29.6 29.3
26.9 14.5% 27.5 24.5 27.3
26.4 15%
15.5%
22.5 14.2% 13.9% 13.5%
21.9 21.8 22.1
16 10%
5%
0 0%
CY2014 CY2015 CY2016 CY2017 CY2018 CY2019F CY2020F
Supply Absorption Vacancy
Source: CBRE Research 2019, Embassy REIT
164Q FY2019 Investor Materials
III. Market Outlook
Our Markets: Bengaluru Luxury and Upscale Hospitality Performance
Strong demand led by business travellers for the luxury and upper upscale segment; occupancy
levels have increased steadily since 2014, ADRs are stabilizing
Amount (₹)
12,000 80%
68%
8,000 66%
64%
66%
58% 60% 60%
4,000
0 40%
FY2014 FY2015 FY2016 FY2017 FY2018 FY2019
ADRs RevPARs Occupancy
Source: CBRE Research 2019, Embassy REIT
174Q FY2019 Investor Materials
IV. Commercial Office
Update
FIFC, Mumbai4Q FY2019 Investor Materials
IV. Commercial Office Update
Continued Leasing Momentum
Leased 1.8 msf in FY2019, of this 1.2 msf re-leased at 34.9% re-leasing spread
Particulars FY2016 FY2017 FY2018 FY2019 Average
Total Completed Area msf 22.5 23.1 24.2 24.8
Occupancy % 93.4% 94.7% 93.5% 94.3% 94.0%
Vacancy Lease-up msf 2.1 1.9 1.3 1.8 1.8
Re-Leasing msf 0.3 1.1 0.5 1.2 0.8
Re-Leasing Spread % 26.6% 60.7% 35.3% 34.9% 42.2%
New Leasing to Existing Tenant % 71.0% 50.0% 69.0% 59.0% 61.8%
Renewals msf 2.3 1.6 2.9 0.9 1.9
1.8 msf average new leases signed 42.2% Average re-leasing spread
between FY2016-2019 between FY2016-2019
2.1 60.7%
1.9 1.8
35.3% 34.9%
26.6%
1.3
FY2016 FY2017 FY2018 FY2019 FY2016 FY2017 FY2018 FY2019
Area
Area (msf) Re-Leased
0.3 1.1 0.5 1.2
194Q FY2019 Investor Materials
IV. Commercial Office Update
Occupancy and Rent Growth Outperformance
High quality assets with robust infrastructure and amenities backed by active asset management has
resulted in outperformance vis-à-vis the market
Portfolio occupancy higher by 950 bps vis-à-vis market Portfolio CAGR at 6.6% vis-à-vis 3.9% of the market
Occupancy (%)(1) Rent (₹ psf/month, Indexed Rents 2014 = 100)
100% 140
135
CAGR:
6.6%
130
95%
125
270 bps
120
90% 950 bps
CAGR:
115 3.9%
110
85%
105
100
80% 95
2014 2015 2016 2017 2018 1Q 2019 2014 2015 2016 2017 2018 1Q 2019
Embassy REIT Markets Embassy REIT Portfolio
Source:
(1) Occupancy & Rents for REIT portfolio is as of the financial year whereas REIT market data is as of calendar year of the respective years 204Q FY2019 Investor Materials
IV. Commercial Office Update
Embedded Mark-to-Market Growth Potential
Renewed 0.9 msf at higher than in-place rents, opportunity to re-lease additional 6.2 msf at market
levels in next 4 years
23% of rentals expiring between FY2020–23 Current market rents are 31% above in-place rents
Area Expiring (msf) Rent (₹ psf/month) 83
3.2
63
1.4
0.9 0.8
0.8
FY 2019 FY 2020 FY 2021 FY 2022 FY 2023
Mark-to-Market
34% 57% 59% 51%
Opportunity
(Rents Expiring %) 4.2% 3.7% 5.8% 9.1% In-place Rents Market Rents
Note: Market Rents as per CBRE Research 2019, Embassy REIT
214Q FY2019 Investor Materials
IV. Commercial Office Update
Leasing Highlights for 4Q FY2019
430k sf new leases signed in 4Q FY2019 with existing tenant expansion accounting for 64% of space
take-up
4Q FY2019 Highlights Key Leases Signed
Tenant Asset City Area ('000 sf)
Total leases signed (‘000 sf) 430
Link Intime Embassy 247 Mumbai 98
Accelya Kale Embassy 247 Mumbai 89
Re-leasing Spread (%) 16.0%
Volkswagen IT Embassy Techzone Pune 24
Qualitest Embassy Manayata Bengaluru 23
Existing Tenant Expansion (%) 64.0%
Parinam Law Express Towers Mumbai 11
Various Various Various 185
Portfolio Occupancy (as at March 31, 2019) 94.3% Total 430
Leases Signed in 4Q FY2019:
224Q FY2019 Investor Materials V. Development Update Embassy Golflinks, Bengaluru
4Q FY2019 Investor Materials
V. Development Update
Development Pipeline
2.4 msf on-campus new build pipeline under various stages of development
Development Track Record (msf) & Pipeline(1) Development Status as of May 28, 2019
Completed in Nov’18
Embassy Oxygen
Received Occupancy Certificate
(Tower 3, 0.5 msf)
91.7%(2) Pre-Leased
Embassy Manyata Structure Completed, Façade and
Front Parcel MEP underway
3.3
(NXT, 0.8 msf) Targeting 2Q FY2021 completion
3.6 msf & 0.5 msf Structure completed, Façade and MEP
added in Embassy Manyata & Embassy Oxygen work underway
Embassy Oxygen respectively 0.6 (Tower 2, 0.6 msf)
0.7 Targeting 1Q FY2021 completion
Hilton hotels at Embassy Manyata –
1.8 619 keys, targeting 3Q FY2022
1.4 1.5
1.3 completion
0.9
0.5 M3 Block (Embassy Manyata) – 1 msf,
Others
FY 2014 FY 2016 FY 2018 FY 2019 FY 2021 Post FY
under excavation & pre-construction
2021 Hudson Block (Embassy Techzone) –
Embassy Manyata Embassy Oxygen Embassy Techzone 0.3 msf, under excavation & pre-
construction
Notes:
(1) Excludes 619 hotel keys across Hilton & Hilton Garden Inn at Embassy Manyata 24
(2) Including hard options of 110k sf.4Q FY2019 Investor Materials
V. Development Update
Embassy Manyata (Front Parcel)
Front Parcel at Embassy Manyata (0.8 msf commercial, 58k sf retail and 619 keys hotel) currently
under development, targeting completion of commercial in 2Q FY2021 and hotels in 3Q FY2022
NXT Tower 1
399k sf
NXT Tower 2
(382k sf)
Hilton Garden Inn
353 keys
Hilton Hotel Retail & Convention
266 keys Center
58k sf
Note: May 2019 picture
254Q FY2019 Investor Materials
V. Development Update
Embassy Oxygen
0.5 msf Tower 3 delivered in November 2018 on schedule and is currently 92%(1) leased. 0.6 msf Tower
2 currently under development, targeting completion in 1Q FY2021
Embassy Oxygen (Tower 3 – 0.5 msf) Embassy Oxygen (Tower 2 – 0.6 msf)(2)
Notes:
(1) Including hard options of 110k sf 26
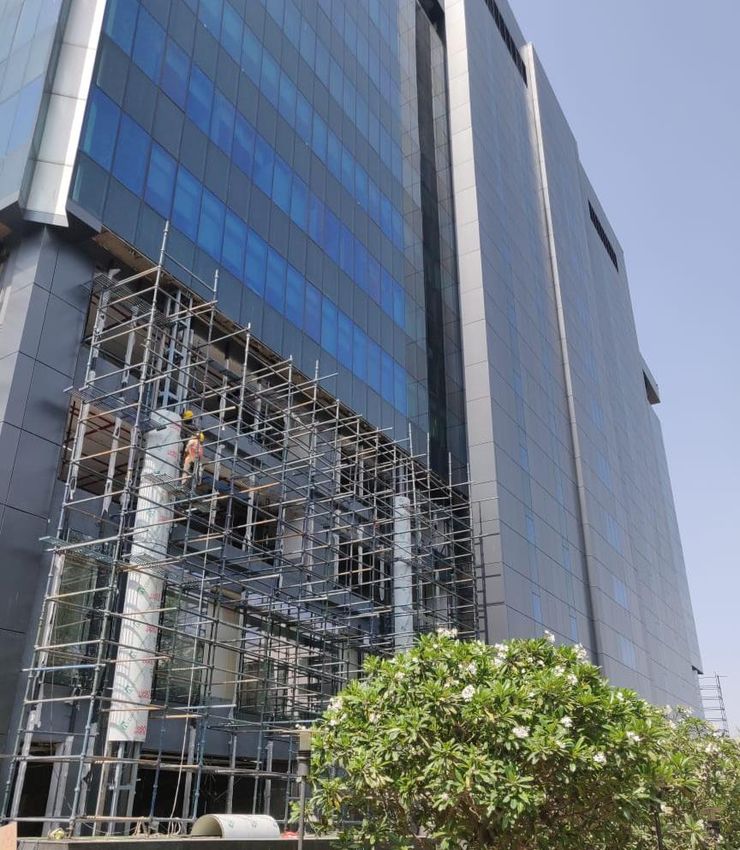
(2) May 2019 picture4Q FY2019 Investor Materials
V. Development Update
Existing Asset Upgrades
Select infrastructure, upgrade and ancillary projects underway to further enhance competitiveness
Embassy 247 – Facade work Embassy Manyata – 220KV Substation
(WIP, targeting 2Q FY2020 completion) (WIP, targeting 2Q FY2020 commissioning)
Embassy Oxygen – Food Court (Completed)
Note: May 2019 pictures
274Q FY2019 Investor Materials
VI. Hospitality &
Other Updates
Hilton at Embassy Golflinks, Bengaluru4Q FY2019 Investor Materials
VI. Hospitality & Other Updates
Hospitality – Hilton and Four Seasons
With recent launch of Four Seasons, 477 hotel keys are now operational and additional 619 keys under
development
Hilton at Four Seasons at Hilton & Hilton Garden Inn at
Embassy Golflinks Embassy One Embassy Manyata
Status: Fully Operational Status: Fully Operational Status: Under Construction
Keys: 247 Keys: 230 Keys: 619
Format: 5-star Format: 5-star o Hilton: 266 keys
Occupancy(1): 69% Launched in May 2019 o Hilton Garden Inn: 353 keys
ARR(1): ₹9,378 Format:
RevPAR(1): ₹6,501 o Hilton: 5-star
o Hilton Garden Inn: 3-star
Expected Completion: 3Q FY2022
Notes:
(1) Average for FY2019 294Q FY2019 Investor Materials
VI. Hospitality & Other Updates
Hospitality: Four Seasons Hotel Launch Update
Known for its world class hospitality, Four Seasons at Embassy One commenced operations in May
2019
Reception Lobby Pool
Dining Area Sample Room
Note: May 2019 pictures
304Q FY2019 Investor Materials
VI. Hospitality & Other Updates
Sustainability Initiatives
Our focus on energy sustainability and environment conservation differentiates us from our competition
100 MW Solar Plant
100MW Solar Plant (215 mn units capacity p.a.(1)) supplying
green power to our Bengaluru & other assets
Sustainable
Energy Upto 176K MT yearly offset CO2(2)
Many LEED Platinum / Gold rated assets
Awards and Certifications
2 British Safety Council Sword of Honour winning parks (2017)
Environment, for select assets
Health and Safety
Environmental, Health and Safety Certifications such as ISO /
OHSAS for select assets
Cycling Event
Create a sense of community by organizing cultural, lifestyle
Community and corporate social responsibility (CSR) events
Engagement
Undertaken environment friendly green initiatives such as
employee transportation facilities
Notes:
(1) Actual generation in FY2019 was 175 mn units given plant was being stabilized 31
(2) Indicative based on “CO2 baseline database for the Indian power sector June 2018” and assuming 215 mn units generation p.a.4Q FY2019 Investor Materials VII. Financial Update Embassy Manyata, Bengaluru
4Q FY2019 Investor Materials
VII. Financial Update

Revenue Contribution by Segment & Geography
 Commercial office segment contributed 88% of Revenue from Operations for FY2019

                                                                           Revenue       % of                           ₹ 18,771 mn
                     Asset                                  City
                                                                         FY2019 (₹ mn)   Total    Revenue from Operations (March 31, 2019) (1)

Embassy Manyata                                       Bengaluru              8,142       43%
                                                                                                               Others
Express Towers                                          Mumbai               1,462       8%                     7%

Embassy Quadron                                            Pune              1,445       8%      Hospitality
                                                                                                    5%
Embassy Energy                                        Bengaluru              1,386       7%
                                                                                                                          Contribution
Embassy Oxygen                                            Noida              1,211       6%                               by Segment
Embassy 247                                             Mumbai               1,037       6%                                              Commercial
                                                                                                                                           Office
Embassy Techzone                                           Pune              1,050       6%                                                88%

Embassy Qubix                                              Pune               867        5%
Embassy Galaxy                                            Noida               861        5%             NCR (Noida)
                                                                                                           11%
Hilton at Embassy Golflinks                           Bengaluru               848        5%
FIFC                                                    Mumbai                463        2%
                                                                                                     Pune
Revenue From Operations                                                     18,771       100%        18%
                                                                                                                          Contribution
Portfolio Investment                (2)                                                                                  by Geography
                                                                                                                                          Bengaluru
Embassy Golflinks                                    Bengaluru               3,498                                                          55%

                                                                                                      Mumbai
                                                                                                       16%

Notes:
(1)    Revenue From Operations does not include contribution from GLSP                                                                          33
(2)    Figure for 100% of GLSP. Embassy REIT owns a 50% stake in GLSP
4Q FY2019 Investor Materials VII. Financial Update Fortress Balance Sheet Post utilization of IPO Proceeds, our conservative Balance Sheet provides significant flexibility for growth NAV per Unit (₹) Particulars 31 March 2019 (₹ mn) Gross Asset Value (GAV)(1) 313,529 Add: Other Assets 61,913 Less: Other Liabilities (17,364) Total Enterprise Value (TEV) 358,078 Less: Total Debt (79,110) Net Asset Value (NAV) 278,967 Number of Units(2) 771,665,343 NAV per Unit ₹ 362 Leverage Particulars 31 March 2019 (₹ mn) Total Debt 79,110 Available cash surplus (49,061) Net Debt(3) 30,050 Net Debt to TEV(4) 9.72% Net Debt to EBITDA 1.99x Notes: (1) Basis CBRE Valuation for Mar’19, except for GLSP. Fair value of equity investment in GLSP has been done based on equity valuation method.. 34 (2) Represents units to be issued in exchange of equity interests held in SPV’s (3) Available cash surplus excludes proceeds towards general corporate purposes (₹3,450 mn) and issue expenses (₹1,800 mn) (4) For Computation of Net Debt to TEV, available cash surplus of ₹49,061 mn has been excluded from TEV
4Q FY2019 Investor Materials
VII. Financial Update
Post IPO Debt Update
Successfully priced and allotted ₹30,000 mn NCDs, to repay existing debt and for general corporate
purposes
Listed NCD Issuance post IPO
₹30,000 mn ₹30,000 mn NCDs priced and allotted on May 3, 2019
Listed NCD Issuance
YTM of 9.4% maturing in June 2022, to be paid as premium on
redemption
Utilized to repay debt and for general corporate purposes
AAA / Stable
CRISIL Rating Financing Strategy
Ample headroom for acquisitions
Majority unitholder approval required if debt exceeds 25% of
asset value
9.4% Regulatory cap at 49% of asset value
YTM
Construction debt to fund on-going capex needs
Distribution Policy
< 15% Minimum 90% of net distributable cash flows to be distributed
Total Debt to GAV(1)(2)
Distributions to be made once every quarter in the fiscal
Notes:
(1) As per CBRE March 2019 valuation 35
(2) Factoring ₹37,100 mn issue proceeds utilized for repayment of existing debt4Q FY2019 Investor Materials VIII. Looking Ahead Embassy Oxygen, Noida
4Q FY2019 Investor Materials
VIII. Looking Ahead

Key Growth Drivers
  Growth Levers and near term priorities in FY2020 in-line with historic delivery

                                                                          Achieved           Near term priority
                                                                           FY2019                  FY2020

                                                                     Four Seasons Hotel
                                                                                               Stabilize Four
                                                    Hotel              launched and
                                                                                               Seasons Hotel
                                                                         operational
                                                Stabilization

                                                                     Delivered 0.5 msf at   Deliver 1.4 msf across
                                                Development
                                                                      Embassy Oxygen,        Embassy Oxygen &
                                                                                             Embassy Manyata;
                                                                     91.7% Pre-Leased(1)    Proactive Pre-Leasing

                                            Re-Leasing to Market     Re-Leased 1.2 msf,
                                                                                            Re-Lease 0.8 msf, at
                                                                     30+ leases at 34.9%
                                                                                               34.2% spread
                                                                           spread

                                           Contractual Escalations   Achieved 10-15%         Contracted 10-15%
                                                                     escalation on c.4.5     escalation on c.5.5
                                                                      msf, 45+ tenants        msf, 45+ tenants

                                                                      Leased 1.8 msf,         Lease-up 1.4 msf
                                             Vacancy Lease-up                               across Embassy One,
                                                                      94% Occupancy            FIFC and others

Notes:
(1)    Including hard options of 110k sf                                                                     37
4Q FY2019 Investor Materials IX. Appendix Embassy Galaxy, Noida
4Q FY2019 Investor Materials
IX. Appendix

Bengaluru Office Market
 Bengaluru office market is forecasted to continue to lead India’s office market growth

                                           Supply                                                 Absorption
                                            (msf)                                                   (msf)
                                                           13.4                                                 13.3
                   12.7                                           12.5                                                    12.4
                                                    11.9                          12.0     11.9                                  11.6
     10.7                                                                 11.2
                                                                                                      9.3
                                  7.9        7.7

  CY2014 CY2015 CY2016 CY2017 CY2018 CY2019F CY2020F                     CY2014 CY2015 CY2016 CY2017 CY2018 CY2019F CY2020F

                                        Vacancy                                               Market Rents
                                 (% of completed stock)                                       (₹ psf / month)

                                                                                                                        80.7     80.8
    11.1%                                                                                                    76.0
                  10.4%
                                                                                              68.7
                                                                                    61.3
                                 6.6%
                                            5.1%                           53.8
                                                           4.3%   4.7%
                                                    3.7%

  CY2014 CY2015 CY2016 CY2017 CY2018 CY2019F CY2020F                     CY2014   CY2015     CY2016         CY2017     CY2018 1Q CY2019
Source: CBRE Research 2019, Embassy REIT
                                                                                                                                  39
4Q FY2019 Investor Materials
IX. Appendix
Mumbai Office Market
Supply is forecasted to moderate over next 2 years and domestic growth is likely to drive office
absorption
Supply Absorption
(msf) (msf)
8.0
7.2
7.5 7.1
6.7 6.7
5.4 5.9
5.2 5.4
4.3 4.2 4.4
4.0
CY2014 CY2015 CY2016 CY2017 CY2018 CY2019F CY2020F CY2014 CY2015 CY2016 CY2017 CY2018 CY2019F CY2020F
Vacancy Market Rents
(% of completed stock) (₹ psf / month)
136.8 135.1 135.5
134.4 134.6
23.3% 133.6
21.8% 22.5%
20.9% 20.2% 20.9%
19.5%
CY2014 CY2015 CY2016 CY2017 CY2018 CY2019F CY2020F CY2014 CY2015 CY2016 CY2017 CY2018 1Q CY2019
Source: CBRE Research 2019, Embassy REIT
404Q FY2019 Investor Materials
IX. Appendix
Pune Office Market
Pune office market forecasted to witness sub-5% vacancy
Supply Absorption
(msf) (msf)
5.1 5.2
4.4
4.1
3.6 3.6
3.5 3.2 3.3 3.5 3.2
2.7
2.2 2.3
CY2014 CY2015 CY2016 CY2017 CY2018 CY2019F CY2020F CY2014 CY2015 CY2016 CY2017 CY2018 CY2019F CY2020F
Vacancy Market Rents
(% of completed stock) (₹ psf / month)
85.1 85.3
12.8% 80.7
75.8
9.5% 68.4
65.6
6.8%
5.4%
4.4% 4.7% 4.2%
CY2014 CY2015 CY2016 CY2017 CY2018 CY2019F CY2020F CY2014 CY2015 CY2016 CY2017 CY2018 1Q CY2019
Source: CBRE Research 2019, Embassy REIT
414Q FY2019 Investor Materials
IX. Appendix
NCR Office Market
Despite the high vacancy (primarily in Grade B assets), NCR has witnessed a 4.7% rent CAGR since
2014
Supply Absorption
(msf) (msf)
10.2 9.5
8.1
6.8 7.0
6.5 6.2
5.3 5.6 5.3
4.6
4.3 4.2
2.8
CY2014 CY2015 CY2016 CY2017 CY2018 CY2019F CY2020F CY2014 CY2015 CY2016 CY2017 CY2018 CY2019F CY2020F
Vacancy Market Rents
(% of completed stock) (₹ psf / month)
82.2 82.5
31.0% 79.0 79.0
28.0% 68.0 71.0
26.0%
23.8% 23.9% 24.1% 24.0%
CY2014 CY2015 CY2016 CY2017 CY2018 CY2019F CY2020F CY2014 CY2015 CY2016 CY2017 CY2018 1Q CY2019
Source: CBRE Research 2019, Embassy REIT
424Q FY2019 Investor Materials
IX. Appendix
Notes to Financials for FY2019
Revenue from Operation (Up 16% YoY to ₹18,771 mn)
Realization of all contractual lease escalations
Full year impact of leases signed in FY2018
Vacant area lease-up in FIFC, Embassy 247 & others
Revenue from lease-up of 1.4 msf newly constructed blocks at Embassy Manyata (0.9 msf) and Embassy Oxygen (0.5 msf)
Stabilization of 100 MW Embassy Energy Solar plant
Net Operating Income (Up 16% YoY to ₹15,741 mn)
Increase due to higher revenue
Partly offset by:
o one-off property tax payment at Embassy Manyata
o one-off power & fuel expenses at Embassy Manyata until commissioning of 220KVA sub-station
o marginally higher maintenance expenses at Embassy 247, Embassy Oxygen and others
EBITDA (Up 11% YoY to ₹15,137 mn)
Increase due to growth in Net Operating Income
Partly offset by:
o one-off marketing expenses relating to public issue
o one-off repairs and maintenance expenses at Embassy Quadron, Embassy 247 and others
o one-off loss on settlement of liability through issue of equity instrument at Hilton at Embassy Golflinks
434Q FY2019 Investor Materials
IX. Appendix
REIT structure
Blackstone Embassy
Sponsor Groups Sponsor Entity
Public
Unitholders
Management
Trustee Embassy Services
REIT Manager
(Axis Acts on Behalf of (EOPMSPL)
Trustee) Unitholder
100%
Embassy Office Parks Private Limited
(Embassy Techzone)
36% 80% 50%(1)
100% 100% 100% 100% 100% 100% 100% 64% 20% 100%
Indian
Quadron Qubix Oxygen Golflinks
Express Earnest Vikhroli Galaxy Manyata Embassy Umbel
Business Business Business Software
Newspapers Towers Corporate Square Promoters Energy Properties
Park Park Park Park
(Mumbai) Private Park Private Private Private Private
Private Private Private Private
Private Limited Private Limited Limited Limited Limited
Limited Limited Limited Limited
Limited Limited
Embassy
Quadron, Hilton at
Express Embassy Embassy Embassy Embassy Embassy Embassy Embassy
Embassy FIFC Embassy
Towers Qubix 247 Park Galaxy Oxygen Manyata Energy GolfLinks
One & Four Golflinks
Seasons
Notes:
(1) Balance 50% owned by JV partner 444Q FY2019 Investor Materials
IX. Appendix
Key Terms & Definitions
Notes: 27. MW – Mega-Watt
► All figures in this presentation are as of March 31, 2019 unless specified otherwise 28. Mumbai: Refers to MMR – Mumbai Metropolitan Region
► All figures corresponding to year denoted with “FY” are as of or for the one-year period ending (as may be 29. NAV – Net Asset Value
relevant) 31st March of the respective year. Similarly, all figures corresponding to year denoted with “CY” are as 30. NCD – Non-Convertible Debentures
of or for the one-year period ending (as may be relevant) 31st December of the respective year 31. NXT – Manyata front parcel office
32. NDCF refers to Net Distributable Cash Flows
► Some of the figures in this Presentation have been rounded-off to the nearest decimal for the ease of presentation
33. Net Debt – Total borrowings (-) minus bank balances, cash and cash equivalents
► All details included in the presentation considers 100% stake in GLSP. However, we own 50% economic interest 34. NOI: Net Operating Income calculated by subtracting Direct Operating expenses from Revenue from operations
in GLSP which owns Embassy Golflinks. Accordingly, its revenues are not consolidated into our revenue from
35. NSE – National Stock Exchange
operations. Also, Market Value or GAV reflects only our 50% economic interest in GLSP.
36. OC – Occupancy certificate
► Any reference to long-term leases or WALE (weighted average lease expiry) assumes successive renewals by 37. Occupancy / % Occupied / % Leased: Occupancy is defined as the ratio of the Occupied Area and the
tenants at their option Completed Area
38. Portfolio – Together, the Portfolio Assets and the Portfolio Investment
► Key Terms and Definitions:
39. Proposed Development Area – The Leasable Area of a property for which the master plan for development has
1. Base Rentals – Rental income contracted from the leasing of Completed Area; does not include fit-out been obtained, internal development plans are yet to be finalized and applications for requisite approvals
and car parking income required under the law for commencement of construction are yet to be received
2. bn – Billions 40. psf – Per square feet
3. BPS – Basis points 41. REIT – Real Estate Investment Trust
4. BSE – Bombay Stock Exchange 42. REIT Regulations – Securities and Exchange Board of India (Real Estate Investment Trusts) Regulations, 2014
5. CAGR – Compounded Annual Growth Rate 43. Rents: Refers to Gross Rentals unless specified otherwise. Gross Rentals are defined as the sum of Base
Rentals, fit-out and car parking income from Occupied Area for the month of March 2019
6. CBRE - CBRE South Asia Private Limited
44. RevPAR - Revenue Per Available Room (RevPAR) is a hotel industry financial metric calculated by multiplying
7. Completed Area – the Leasable Area of a property for which occupancy certificate has been received the Average Daily Rate by the percentage occupancy
8. EBITDA - Earnings before interest, tax, depreciation and amortization 45. ROFO – Right of First Offera
9. Embassy Group: refers to the Embassy Sponsor or its subsidiaries or limited liability partnerships 46. SF – Square feet
10. Embassy REIT refers to Embassy Office Parks REIT 47. Sponsor(s) – Embassy Property Developments Private Limited and BRE/ Mauritius Investments
11. EOPMSPL – Embassy Office Parks Management Services Private Limited 48. SPV – Special purpose vehicles, as defined in Regulation 2(l)(zs) of the REIT Regulations, in this case being,
12. FY - Period of 12 months ended March 31 of that particular year, unless otherwise stated MPPL, UPPL, EEPL, IENMPL, VCPPL, ETPL, QBPL, QBPPL, OBPPL and GSPL
13. GAV – Gross Asset Value 49. TEV – Total Enterprise Value
14. GLSP - Golflinks Software Park Private Limited 50. tn – Trillions
15. HVAC – Heat ventilated air conditioning 51. Units – An undivided beneficial interest in the Embassy REIT, and such units together represent the entire
beneficial interest in the Embassy REIT
16. Holdco – Refers to Embassy Office Parks Private Limited
52. U/C – Under construction
17. IPO – Initial Public Offering of units of Embassy Office Parks REIT
53. Under Construction Area - The Leasable Area of a property for which the master plan for development has
18. Investment Entity – Refers to Golflinks Software Park Private Limited
been obtained, internal development plans have been finalized and applications for requisite approvals required
19. Leasable Area – Total square footage that can be occupied by a tenant for the purpose of determining a under the law for commencement of construction have been applied, construction has commenced, and
tenant’s rental obligations. Leasable Area is the sum of Completed Area, Under Construction Area and occupancy certificate is yet to be received
Proposed Development Area
54. WALE – Weighted Average Lease Expiry
20. Manager – Embassy Office Parks Management Services Private Limited
55. WIP – Work-in-progress
21. MAT – Minimum Alternate Tax
56. Years: Refers to fiscal years unless specified otherwise
22. MEP – Mechanical, Electrical & Plumbing
57. YOY – Year on year
23. mn – Millions
58. YTM – Yield to Maturity
24. MNC – Multinational Corporations
25. msf – Million square feet
26. MTM – Mark to Market
454Q FY2019 Investor Materials Thank You Investor Relations Contact: Ritwik Bhattacharjee ir@embassyofficeparks.com P: +9180 3322 2222 F: +9180 3322 2223 www.embassyofficeparks.com Embassy Golflinks, Bengaluru
You can also read