Investor/Analyst Presentation - Roadshow: H1 2018 - Group Interim Report - Voltabox
←
→
Page content transcription
If your browser does not render page correctly, please read the page content below
Investor/Analyst Presentation
Roadshow: H1 2018 – Group Interim Report
Executive Summary: Highlights H1/2018

↗ € 18.1 million                                                        ↗ 144 employees
  Revenues (previous year: € 10.6 m)                                               (June 30, 2017: 78)

                                      On the way to a new level

↗ € 1.7 million                                                              ↗ € 0.1 million
    EBITDA (previous year: € 0.2 m)                                           EBIT (previous year: € -0.7 m)

H1 2018 – Group Interim Report               Investor/Analyst Presentation                                     2
Agenda Introduction of Voltabox Business Overview Financials
Corporate Development
Mother company paragon founded by Klaus Dieter Frers
1988 (as private ownership)
1994 Certification as automotive Tier 1 for electronics
IPO of paragon AG (now paragon GmbH & Co. KGaA) at
2000 Frankfurt Stock Exchange (now: Prime Standard)
Market entry into Lithium-Ion Batteries:
2011 E-Mobility launched as a new business segment of paragon AG
Foundation of Voltabox as legal entities in Germany and the US
2014 (100% subsidiaries of paragon AG)
Voltabox IPO in Frankfurt after change of legal form into a stock
2017 corporation with Voltabox of Texas, Inc. as a 100% subsidiary
Acquisitions of Concurrent Design, Inc. and of Navitas Systems,
2018 LLC. marking key milestones in M&A growth strategy
Rearrangement of intralogistics partner agreement to occupy a
leading market position / Start of direct sales in the intralogistics
market
H1 2018 – Group Interim Report Investor/Analyst Presentation 4
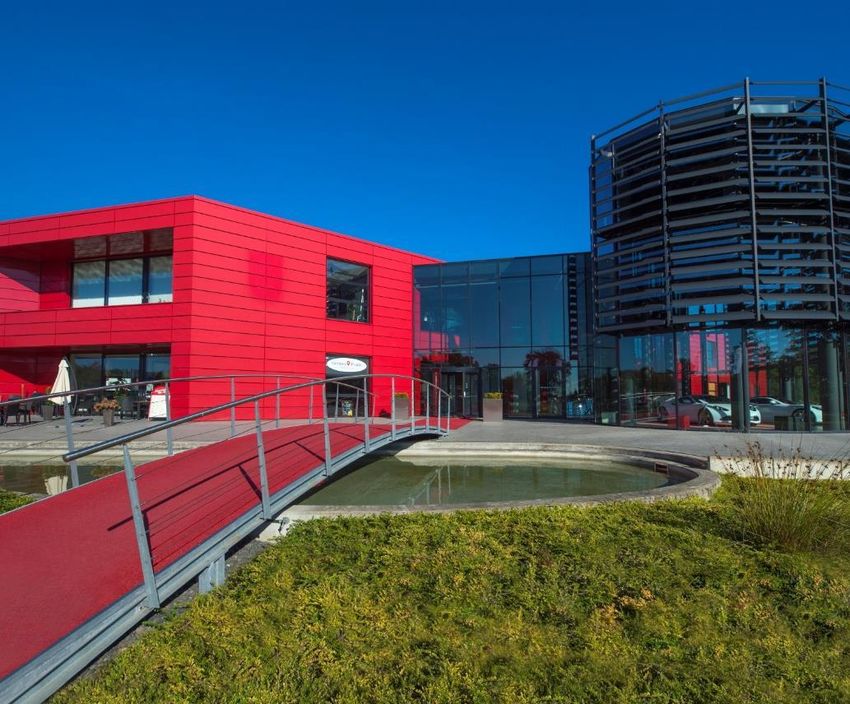
Location Overview 128 FTE AG 4 FTE
Headquarters Development Center
With 169 FTE*,
technology hubs Delbrück Aachen
and state-of-the-art
production facilities,
Voltabox is well Vo l t a b o x o f N o r t h A m e r i c a , I n c .
85 FTE***
positioned to grow
0 FTE**
its business on a
Soon-to-be: Voltabox of Michigan, Inc.
global scale. Kunshan Co., Ltd.
Ann Arbor, MI (USA)
41 FTE
of Texas, Inc. 62 FTE in Research & Development (37%) Kunshan (China)**
- excl. Navitas employees -
* Full time equivalents (FTE) incl. 25 temporary
employees in Delbrück, as of June 30, 2018.
Administration Production Research & Development ** In the course of formation.
*** Acquisition is subject to approval by the
Austin, TX (USA) American CIFUS authority.
H1 2018 – Group Interim Report Investor/Analyst Presentation 5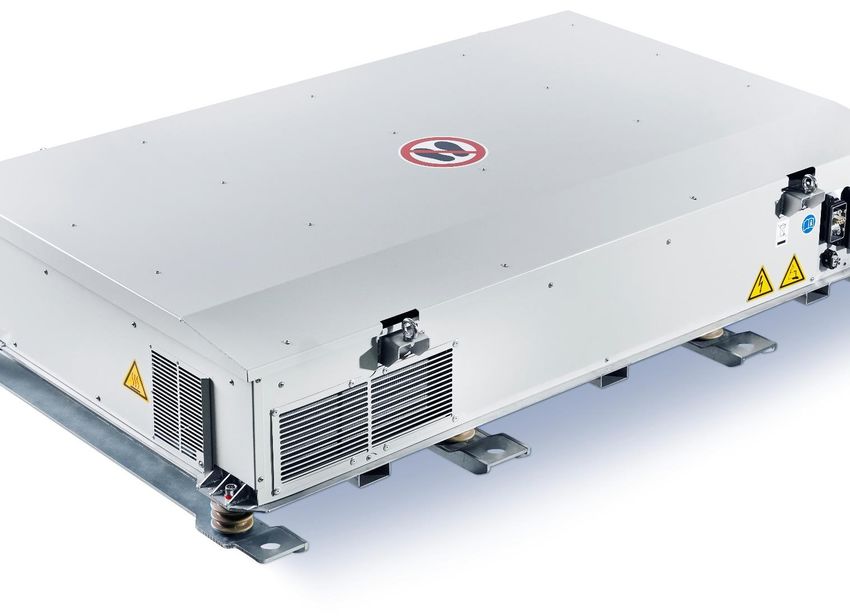
Management Team
Management Board Supervisory Board
Jürgen Pampel, CEO Andres Klasing, CFO Klaus D. Frers, Chairman Prof. Dr. Martin Winter, Hermann Börnemeier
(Deputy Chairman)
Former Head of Electromobility Joined Voltabox in 2017 Founder / majority owner & CEO Professor at the Institute of Shareholding director of Treu-
business unit at paragon Former Head of Accounting & of Automotive Tier 1 paragon Physical Chemistry at the Union Treuhandgesellschaft mbH,
Various leadership positions at Controlling at paragon since 2016 GmbH & Co. KGaA University of Münster a tax consultancy
paragon since 2004 Various finance positions for Former CEO of Voltabox One of the most renowned Long-term advisor to the parent
Design Engineering graduate Bertelsmann group Received numerous awards for German scientists in the energy- company paragon GmbH & Co.
entrepreneurial activities storage field with a focus on KGaA
Business administration (VWA) /
Lithium-Ion batteries
Engineer (FH) graduate Leadership positions at AEG-
Telefunken and Nixdorf Computer
Mechanical Engineering graduate
H1 2018 – Group Interim Report Investor/Analyst Presentation 6
Agenda Introduction of Voltabox Business Overview Financials

E-Mobility Pure Play
Structural representation of a battery system E-Mobility Value Chain
Base Battery Battery Battery Recycling
Components Cells Modules System
Electric
Vehicle
Drivetrain
components
Separator Cylindrical cells Module cases with Robust housing with The sweet
integrated integrated fixing points
Anode Prismatical cells Battery spot of
• Cooling Devices Master ECU
Cathode Pouch cells system E-Mobility
• BMS Slave Circuit Data interfaces
Electrolyte
Board Power switchers
Cell Housing in different Li-Ion
chemistries • Sensors DC/DC converters
Insulation Strips Cell
• LFP • Wiring Loom Compensators
• NMC • Lids Fuses / Resistors
• LTO • Sealings Climate systems
Raw and
• Rupture Discs (Chargers, cable
processed materials
• (NCA)
rewinds)
in various low and high
voltage versions
H1 2018 – Group Interim Report Investor/Analyst Presentation 8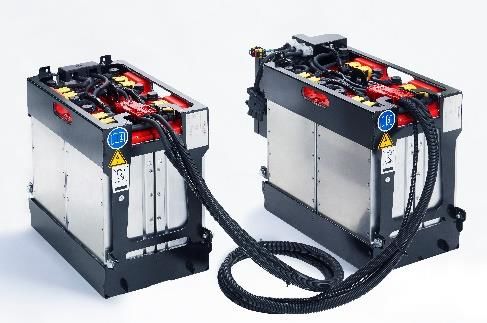
Li-Ion vs. Lead-Acid Technology
Li-Ion Technology Lead-Acidtechnology
Lead-Acid Technology
Up to 240 Wh/kg Energy density 40 Wh/kg
Up to 95% Charging efficiency Up to 70%
Additional advantages:
No memory effect Up to 30,000 cycles
Cycle life 1,200
at 80% DOD
(opportunity charging)
Very low self-discharge
No maintenance Up to 80% in 6 min
Fast charging 50% in 3 hrs.
Full functionality at low (10C)
temperatures
Optimum control and Gassing &
Zero emissions Emissions
(remote) monitoring water loss
H1 2018 – Group Interim Report Investor/Analyst Presentation 9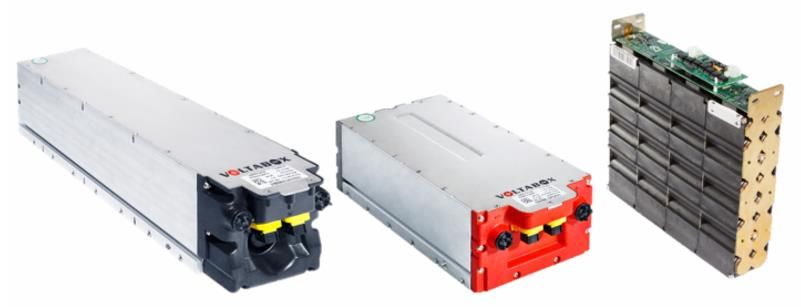
Li-Ion-Battery Technology Overview
Available Li-Ion Cell Chemistry Li-Ion Cell Chemistry Types used by Voltabox
Li-Ion chemistries are replacing the leading battery technologies Lithium Iron Phosphate (LFP)
of the past like Nickel-Metal Hydride, Nickel Cadmium and Lead- Nominal cell voltage: 3.2 V to 3.3 V
No risk of thermal runaway (in case of an accident)
Acid
High cycle stability of up to 4,000 cycles at 80% DoD
Future technological developments are also carefully tracked and Large operating temperature range -20/+ 55 °c
evaluated by Voltabox High energy density (125 Wh/kg and 292 Wh/l)
New lithium based technologies like Li-Air, Li-Sulfur and Lithium Using only a small portion of rare earths
Solid State cells are expected to achieve market readiness around
2023 Nickel Manganese Cobalt (NMC)
Nominal cell voltage: 3.6 V to 3.7 V
Cell Supplier Base High cycle stability of at least 6,000 cycles at 80% DoD
Great operating temperature range of -30/+ 60 °C
High energy density (136 - 230 Wh/kg and at least 309 Wh/l)
Lithium Titanium Oxide (LTO)
Nominal cell voltage: 2.3 V
Highest cycle stability of up to 30,000 cycles at 80% DoD
High level of safety thanks to LTO anode
Great operating temperature range of -30/+ 55 °C
Energy density of 96 Wh/kg or 202 Wh/l
Great SoC range useable with the highest performances
H1 2018 – Group Interim Report Investor/Analyst Presentation 10Agnostic Approach to Cell Types
Cylindrical Prismatic Pouch
A prismatical design indicate a flat battery
Rather than rigid metallic casing, conductive
A spirally wound design (jelly-roll). design. The stacks can be wound (as shown
foil-tabs are welded to the electrodes and
Designated by size, e.g. 26650 cylindrical in the photo) or stacked (with alternating
seal the battery fully. The tacks inside can be
battery (Diameter: 26mm, length: 65.2 mm; cathode/separator/anode structure). The
wound or stacked. Swelling and gassing
code for cylindrical shape: 0) stacks are usually inserted into rigid casing to
could be a concern for pouch cells
form prismatic
Cell Package Impedance Thermal Tabbing Cell Cost Battery Cost
Cylindrical Poor Poor Minimal Medium High
Prismatic (Wound) Poor Poor Minimal Medium Medium
Prismatic (Stacked) Good Poor High High Medium
Pouch (Wound) Poor Good Minimal Medium High
Pouch (Stacked) Good Good High High High
Source: IDTechEx
H1 2018 – Group Interim Report Investor/Analyst Presentation 11Modular Development & Production Approach*
NMC 24V standard NMC 24V air-cooled NMC 24V water-cooled NMC 48V standard NMC 48V air-cooled NMC 48V water-cooled
NMC 103V water-cooled NMC 36V standard NMC 40V standard NMC 40V water-cooled LTO 48V standard LTO 83V standard
LTO 83V long LFP 24V standard NMC 48V Pouch 3x8 LFP round cell module 4x9 LFP round cell module
* Excerpt from product portfolio.
H1 2018 – Group Interim Report Investor/Analyst Presentation 12Li-Ion Battery System Supplier for Industrial Applications
Many years of experience in
Power-Switches
development and production of
Master ECU / BMS
electronic components
(via parent company paragon GmbH & Co. Data-Interfaces
KGaA)
Exceptional integration power Robust Housing
(experience in automotive interfaces) DC/DC Converters
Mindset focus on applications Climate System
(authentic added value solutions)
Superior realization processes
(short time-to-market with modular kit)
Compensators /
Insulators
H1 2018 – Group Interim Report Investor/Analyst Presentation 13Market Penetration by Voltabox
Q2 2014: First major US-contract for battery systems in trolleybuses
Q2 2016: Exclusive strategic partnership with leading mining equipment provider
Q4 2016: Expansion of intralogistics market with batteries for Automated Guided Vehicles
Q3 2017: First selected mass market entry with starter batteries for motorbikes
Q4 2017: First strategic partnership in the area of agriculture and construction
Q1 2018: Acquisition of the engineering services provider Concurrent Design
Q2 2018: Strategically important rearrangement of intralogistics partner agreement
Q2 2018: Takeover of Navitas systems and entry into production of customized battery cells
Today: Significant future growth prospects backed by strong 60-month order backlog of € 740 million* weighted 100
percent * As of June 30, 2018
H1 2018 – Group Interim Report Investor/Analyst Presentation 14Market Dynamics
Global battery market value in USD bn. Li-Ion
Overall usage of batteries will increase 12
> 50%
due to E-mobility mega trend
Ongoing substitution of lead acid CAGR
10
batteries resp. diesel generators by 23%
lithium-ion batteries in occupied
submarkets 8
11% global market growth expected
for battery systems in current Voltabox 6
end markets in 2018 Li-Ion
< 5%
Intralogistics submarket expected to
4
show fastest adoption of Li-Ion
Source: IdTechEx (2017)
technology due to TCO advantages
Market penetration of Li-Ion expected 2
CAGR
to exceed 50% of new sales by 2023 in 38%
intralogistics
0
2018 2019 2020 2021 2022 2023
Intralogistics* Other VBX end markets**
* Partly Lead-Acid and Li-Ion.
** HEV/PHEV Buses over 5 meters, mining vehicles, agriculture & construction, motorcycles.
H1 2018 – Group Interim Report Investor/Analyst Presentation 15New Agreement for Targeted Market Leadership
In June 2018 Voltabox rearranged the strategically important agreement with Triathlon for a close partnership in order to supply
the market with innovative and technologically advanced Li-Ion batteries.
Early implementation of a differentiation strategy with three essential
Ensuring a fast market penetration at Voltabox‘ own pace in both
manufacturing and sales players: Voltabox, Triathlon, Navitas
Europe and the USA in order to occupy a leading market position
Creating competitive advantages via
transfer of technology know-how
Creating market entry barriers for competitors by
securing access to exclusive system components
Time and cost advantages compared to
own development of system components
Additional access to the (shared) margins from
the end customer business on the system level
H1 2018 – Group Interim Report Investor/Analyst Presentation 16Roadmap for Electrifying the Komatsu Fleet
2018 2019 2020 2021 2022
BH 18/20 Current series production
BH 18/20 (MSHA*) Validation Series production (e)
BH 30 Validation Series production (e)
BH 10 (MSHA*) Validation Series production (e)
Shuttle car Validation Series production (e)
Jumbo Face Drill Validation Series production (e)
14t LHD (Big Bertha) Validation Series production (e)
4t LHD Validation Series production (e)
Image sources: Komatsu Mining
7t LHD Validation Series production (e)
10t LHD Validation Series production (e)
20t Truck Validation Series production (e)
* Mine Safety and Health Administration
H1 2018 – Group Interim Report Investor/Analyst Presentation 17Voltabox Growing Into a New Dimension
New facilities, Tripling of production area (esp. in USA) and space expansion for
R&D as well as administrative functions
more sites Foundation of Voltabox Kunshan Co., Ltd., Kunshan, China (3,400m2)
Increase of resources R&D staff to increase to a total of 70 employees in FY 2018
and brilliant minds Further setting up of the R&D site in Aachen
Expanding product portfolio into selected mass markets
Innovative products,
Entering into new market segments (i.e. airport ramp, rail,
new markets pedelecs/E-Bikes)
Working on the integration of acquired companies (esp. Navitas
Pushing organic growth
Systems) and on further precisely fitting M&A opportunities, e.g. to
by M&A accelerate market penetration
H1 2018 – Group Interim Report Investor/Analyst Presentation 18Multiple Growth Paths
Expansion of product portfolio along
the value chain - full system provider
Vertical Expansion
Voltapower* – Voltaforce* – Voltamotion**
Expansion of end markets
DC-DC Onboard
converter charger
Master Slave BMS
BMS
Agricultural Construction Garbage Auxiliary Slave BMS Electric
battery Electronics machine
Vehicles Vehicles Trucks Slave BMS
…
Core segment Inverter
Further market
Ground support Rail Performance penetration
equipment Motorcars*
New end markets
Horizontal Expansion
* Performance Motorcars Starter Batteries
Expanding into further selected
attractive mass markets
Today
Pedelecs / Cleaning Medical use
E-Bikes machines
H1 2018 – Group Interim Report Investor/Analyst Presentation 19USPs of Voltabox
System Provider Expertise in
Modularity &
Complete portfolio for Automotive
electrification of vehicles Scalability
Electronics
Customized Application High degree of
Battery Cells Specialist Automatization
H1 2018 – Group Interim Report Investor/Analyst Presentation 2060-Months Order Backlog (Q2 2018 – Q2 2023)
Total 60-months order backlog 60-months order backlog with
amounts to more than € 1bn*. 100% weighting as of H1/2018
Thereof approx. 74% signed orders
Voltamotion
and framework agreements Voltaforce
1%
(weighted with 100%) 8%
Estimated order backlog is weighted
according to the expected lifetime and
the probability of occurrence
Serves as base for planning
Evaluation system in place since
inception in 2011
Voltapower
91% * As of Jun. 30, 2018
H1 2018 – Group Interim Report Investor/Analyst Presentation 21Agenda Introduction of Voltabox Business Overview Financials
Key Figures for the Group from H1 Report 2018
Strong Financial Background Dynamic Growth in all areas
Equity ratio of 91.5 % (equity: € 154.9 million) Group revenue increased 71 % to € 18.1 million
Liquid funds of € 74.2 million FTE up 45.5 % to 144 (excl. 25 temporary
Balance Sheet Total: € 169.2 million employees)
Profitability on track Successful Execution of Growth Strategy
Entry into direct sales activities in Intralogistics
EBITDA increased 758 % to € 1.7 million Auspicious Takeover of Navitas Systems for € 37
EBIT margin at 0.6 % million incl. excellent market access in the US
Investments of € 3.5 million as expected
H1 2018 – Group Interim Report Investor/Analyst Presentation 23Top Line Growth with Increasing Profitability
25 + 59 %
21.564
+ 71 %
20
18.112
15
13.569 + 70 %
10.594 10.673
10
6.278
5 n.a. - 64 % + 77 % + 26 %
-0.747 0.116 -0.258 -0.352 -1.005 -0.236 -0.630 -0.464
0
Revenue Total operating Gross profit EBIT Financial result EBT Group result
performance
-5
H2 2017 H2 2018
H1 2018 – Group Interim Report Investor/Analyst Presentation 24Cash Flow Statement
Large increase in trade receivables owing to very good business development in the Voltapower Free
segment and sales financing support for main Voltabox partner (limited to 2018)
Cashflow:
Other non-cash expenses increased due to currency effects € -28.1m
(Previous year:
Significant decrease in trade payables and other liabilities of € 7,798m € 1.9m)
Slightly increased amortization of noncurrent fixed assets
€ -24.6m € -3.5m € -0.3m
(Previous year: € 4.4m) (Previous year: € -2.5m) (Previous year: € -0.5m)
Cash flow from Cash flow from Cash flow from
operating activities* investment activities* financing activities*
* FY 2017
H1 2018 – Group Interim Report Investor/Analyst Presentation 25New R&D Capabilities: Takeover of Concurrent
Concurrent Design is an engineering services provider located in
Austin, Texas with proven and long-standing expertise in R&D
More than 20 highly skilled
employees,
mostly engineers, software developers &
project managers
Expertise from more than 1,700
successfully completed projects
Multiple boost of Concurrent Design was the first acquisition for Voltabox in
this field since its successful IPO. The whole team has been
velocity for Voltabox integrated into the structures of Voltabox of Texas and is
by additional resources now mainly working on projects for Komatsu.
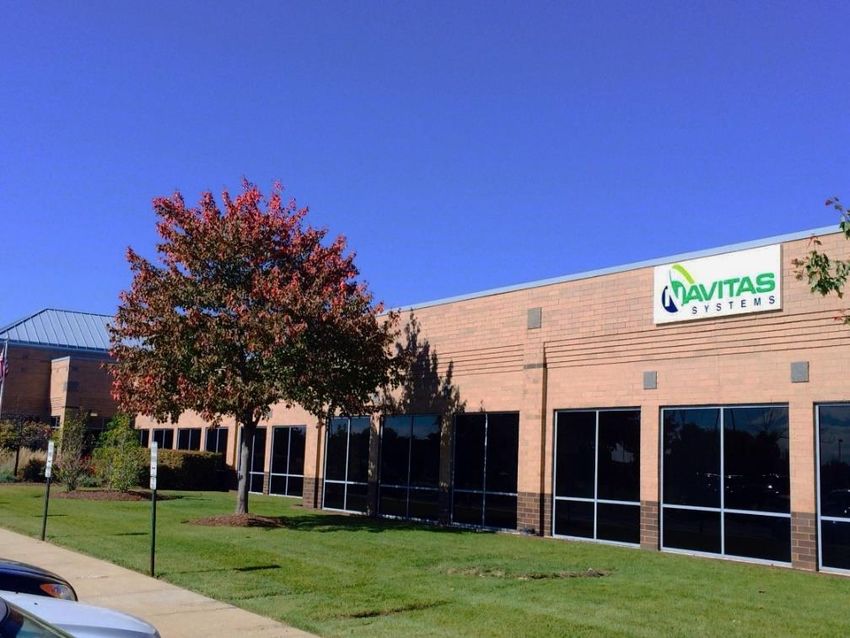
H1 2018 – Group Interim Report Investor/Analyst Presentation 26On Way to Market Leadership: Acquisition of Navitas
Profitability broadly similar to Voltabox Voltabox took over Navitas Systems for €40m in order to accelerate
Expected revenues of around €25m in 2018 market penetration in the market segments of particularly rapid growth.
With the acquisition, Voltabox Navitas has established a
have come a great deal closer market-leading position in
to the goal of becoming the the region with its
global market leader “Starlifter” batteries.
in the field of
battery systems for intralogistics. Navitas employs a
total of 85 people - including
Navitas opens up new applications and thus
top experts with
completely new prospects in-depth cell know-how
with an A123 background.
in the North American market.
H1 2018 – Group Interim Report Investor/Analyst Presentation 27Performance of Voltabox Share (VBX)
150%
140%
130%
120%
110%
100%
90%
80%
70%
60%
Voltabox AG TecDAX SDAX DAX CXKH
H1 2018 – Group Interim Report Investor/Analyst Presentation 28Updated Forecast 2018
↗ € 65-70 m
Revenues 2018 (e)*
↗ ca. 7 %
* In the course of the acquisition of Navitas System – expected
initial consolidation in Q3 2018
EBIT margin 2018 (e)**
**Considering € 2m add. expenses from rearrangement of
intralogistics partner agreement
H1 2018 – Group Interim Report Investor/Analyst Presentation 29Forecast and Analyst Consensus
Financial performance
indicators of Voltabox AG
2017 2018
[in € million / as indicated] Forecast Results Forecast (old) Forecast (new)
Group revenue 25 27* Approx. 60 Approx. 65-70**
EBIT margin Slightly positive 2.1% Approx. 10% Approx. 7%***
Analyst estimates 2017 2018
Group revenue 25.5 58.2
EBIT margin 0.8% 10.1%
* Thereof around € 2 million with parent company paragon AG (now paragon GmbH & Co. KGaA)
** In the course of the acquisition of Navitas System – expected initial consolidation in Q3 2018
***Considering € 2m add. expenses from rearrangement of intralogistics partner agreement
H1 2018 – Group Interim Report Investor/Analyst Presentation 30Voltabox on tour – Trade fairs and exhibitions
May 7-9, 2019,
Stuttgart
Oct. 3-7, 2018, Cologne
May 15-17, 2018, Hannover Hall 6.1, Jan. 8-11, 2019,
Nov. 21-22, 2018,
Booth No. B-075 Las Vegas
Solingen
May 2018 May 2019
July 5, 2018, Aachen
Sep. 20-27, Feb. 19-21, 2019,
2018, Hannover Nov. 20, 2018, Stuttgart
Hall 13, Essen
Booth No. E10
Sep. 11-13, 2018,
Novi, MI
H1 2018 – Group Interim Report Investor/Analyst Presentation 31Financial Calendar Jan. 11/12, Oddo Forum, Lyon Feb. 1, Bankhaus Lampe German Corporate Conference, London Feb. 21/22, 12. Oddo-BHF German Corporate Conference, Frankfurt am Main Mar. 13, Annual report 2017 Apr. 18-20, Bankhaus Lampe Deutschlandkonferenz, Baden-Baden May 8, Interim release as of March 31 – 3 months May 9, Annual general meeting, Delbrück May 16, Berenberg Investor Forum at The Battery Show, Hannover Jun. 7, quirin Champions 2018, Frankfurt am Main Jun 21/22, Berenberg Pan-European Discovery Conference Aug. 21, Interim release as of June 30 – 6 months Sep. 3/4, Equity Forum Herbstkonferenz, Frankfurt am Main Oct. 25 Berenberg Discovery USA Konferenz, New York Nov. 13, Interim release as of September 30 – 9 months Nov. 26-28, Deutsches Eigenkapitalforum 2018, Frankfurt am Main H1 2018 – Group Interim Report Investor/Analyst Presentation 32
Financials -
                                  Appendix
H1 2018 – Group Interim Report      Investor/Analyst Presentation   33
H1/18: Revenues & EBIT Margin development
70
20,0%
60
10,0%
50 0,0%
-10,0%
40
-20,0%
30
-30,0%
20
-40,0%
10
-50,0%
0 -60,0%
Q3 2016 Q4 2016 FY 2016 Q1 2017 Q2 2017 Q3 2017 Q4 2017 FY 2017 Q1 2018 Q2 2018 Q3 2018 Q4 2018 FY 2018e
Revenues in €m 2,349 7,631 14,493 4,124 6,47 5,727 10,952 27,273 5,056 13,056 65
EBIT margin -51,4% -12,1% -25,4% -28,0% 6,3% -17,6% 21,3% 2,1% -15,2% 6,8% 7,0%
H1 2018 – Group Interim Report Investor/Analyst Presentation 34H1/18: Key Factors Profitability Development
↑ Economies of scale ↓ Material input
due to automation
↑ Own work capitalized ↓ Upfront personnel expenses
due to operative growth
2,0% ↓ Depreciations
0,0%
H1 / 2018
-2,0%
0,6%
H1 / 2017
-4,0% -7,1%
-6,0%
-8,0%
EBIT margin
H1 2018 – Group Interim Report Investor/Analyst Presentation 35H1/18: Significant Changes of Group‘s Assets
Increase in noncurrent assets
16.481 19.432
3.187
by € 6.4m
8.125 5.818 Intangible Assets up € 3.0m owing
3.337 8.634 own work capitalized
4.206
3.660
5.326 Increased Goodwill as a consequence
22.069 of the Concurrent Design acquisition
Intangible assets
33.723
10.413
0.256
Goodwill Decrease in current assets by
Property, plant and equipment € 7.9m
9.930
Deferred taxes Increase in Trade Receivables about
8.455 € 11.7m due to sales supporting
Inventories activities in intralogistics
Trade receivables Other assets up € 8.2m due to the
capitalization of the one-time
Receivables from related parties
investment subsidy for capacity
102.679 74.242 Other assets expansion granted by Voltabox due to
the revised cooperation agreement
Liquid funds with the partner Triathlon
Liquid funds went down about €
28.4m mainly through operating
expenses in connection with the
dynamic growth strategy
Dec. 31, 2017 Jun. 30, 2018
H1 2018 – Group Interim Report Investor/Analyst Presentation 36H1/18: Significant Changes of Equity and Liabilities
Equity remained nearly
4.108 13.800
unchanged at €
154.895m
Noncurrent provisions
9.692 Profit/loss carried forward and liabilities slightly
Group result increased to
Currency translation differences € 8.818m
3.532 Noncurrent loans
3.413 Current provisions and
Deferred income taxes
4.840
liabilities decreased
Trade payables
5.391
about € 1.9m to € 5.507m
Liabilities to related parties
3.591
Liabilities to related
Other current liabilities parties went down about €
3.496
1.813 0.9m
0.925
1.255 0.600 Other current liabilities
-1.019 -0.650
-0.464 reduced about € 0.7m
Dec. 31, 2017 Jun. 30, 2018
H1 2018 – Group Interim Report Investor/Analyst Presentation 37H1/18: Investing in Further Growth
Own work capitalized in €m (IAS 38)
CAPEX breakdown: € 10.9 3
0.216
million in Germany and € Voltamotion 0.293
Investment Plan 2018
0.034
2.5 million in the US 2
0.501
Voltaforce
2.211
Building USA Intangible
Assets
Capitalized development 1
1.499
Voltapower
Voltabox of Texas,
Voltabox AG
costs expected to increase PPE* Inc.
€ 2.5m € 5.7m
by 6.6% 0
H1 2017 H1 2018
Investments year-to-date at Cash payments for Voltabox AG
€ 5.2m
€ 3.5m (thereof € 2.8m investments ytd (in €m)
Intangible Assets)
13.4
Investment volume
Own work capitalized planned for 2018
mainly in the Voltapower i.a. prismatic line (outstanding
payment), pouch line, technology/e-
segment – increased R&D in Intangible Assets machines, charger/inverter, property
2.8 deposit, measuring devices etc.
the Voltmation segment Investments (ytd)
0.7
PPE*
*Property, Plant and Equipment
H1 2018 – Group Interim Report Investor/Analyst Presentation 38FY17: Highlights
Strong Financial Position Dynamic Top Line Growth
Equity ratio of 90.8 % (equity:
Group revenue increased 88.2 % to € 27.3
€ 154,990 million)
million
Liquid funds of € 102.7 million
Increasing Profitability Set for Future Growth
Launch of a new R&D site in Aachen
EBITDA increased 240,9 % to € 3 million
€ 5.2 million internal R&D
EBIT margin at 2.1 %
(R&D ratio 19.0 %)
H1 2018 – Group Interim Report Investor/Analyst Presentation 39FY17: Top Line Growth with Increasing Profitability
Selected parameters from the consolidated
income statement of Voltabox AG
H1 2018 – Group Interim Report Investor/Analyst Presentation 40FY17: Net Assets and Financial Position
Assets* Equity and Liabilities*
Noncurrent assets € 31.1m Equity € 155.0m
Current assets € 139.6m Noncurrent provisions
and liabilities € 8.4m
Current provisions and
liabilities € 7.4m
Voltabox invested in the Balance Sheet Total Capital reserve increased to
further expansion of (Accounting date: Dec. 31, 2017) € 126.4m
business activities Significant reduction of
Development work Assets + noncurrent provisions and
capitalized: € 5.2m equity and liabilities € 170.8m liabilities
Sufficient liquid funds of
€ 102.7m due to the IPO (2016: € 39.0m)
* As of Dec.. 31, 2017
H1 2018 – Group Interim Report Investor/Analyst Presentation 41FY17: Investments as a Key Factor
FY 2017 FY 2016
€ 5.3m
Cash payments for investments in
€ 4.9m
intangible assets
€ 1.0m
€ 1.3m Investments of the Group in property,
plant and equipment
€ 16.2m
€ 12.7m
Intangible assets (IAS 38)*
* Capitalized development expenses
H1 2018 – Group Interim Report Investor/Analyst Presentation 42Disclaimer This presentation is given to you in strict confidence. By attending the presentation, you agree that no part of this presentation or disclaimer may be disclosed, distributed or reproduced to any third party without the consent of Voltabox AG (“Voltabox”). This presentation is being provided for the sole purpose of providing the recipients with background information about Voltabox‘s business. This presentation, including the information contained in this disclaimer, does not constitute an offer, invitation or recommendation to subscribe for or purchase any security and neither the presentation, disclaimer nor anything contained in them forms the basis of any contract or commitment. This presentation does not purport to summarize all information that an investor should consider when making an investment decision. It should be read in conjunction with Voltabox’s other continuous disclosure announcements. Before making an investment decision you should consider whether it is suitable for you in light of your own investment profile and objectives and financial circumstances and the merits and risk involved. No representation, express or implied, is made as to the fairness, accuracy, completeness or correctness of information, opinions and conclusions contained in this presentation, including the accuracy, likelihood of achievement or reasonableness of any forecasts, prospects, returns or statements in relation to future matters contained in the presentation (“forward-looking statements”). Such forward-looking statements are by their nature subject to significant uncertainties and contingencies and are based on a number of estimates and assumptions that are subject to change (and in many cases are outside the control of Voltabox and its Directors) which may cause the actual results or performance of Voltabox to be materially different from any future results or performance expressed or implied by such forward-looking statements. Forward looking statements are provided as a general guide only and should not be relied upon as an indication or guarantee of future performance. To the maximum extent permitted by law, neither Voltabox nor its related corporations, directors, employees or agents, nor any other person, accepts any liability, including, without limitation, any liability arising from fault or negligence, for any loss arising from the use of this presentation or its contents or otherwise arising in connection with it. You represent and confirm by attending and/or retaining this presentation, that you accept the above conditions. H1 2018 – Group Interim Report Investor/Analyst Presentation 43
Company Contact
Voltabox AG
Investor Relations
Dr. Kai Holtmann
Artegastraße 1
D-33129 Delbrück
Phone: +49 (0) 5250 9930-964
E-Mail: investor@voltabox.ag

H1 2018 – Group Interim Report   Investor/Analyst Presentation   44
You can also read