Sustainable use of Earth's natural resources - Q1 2017 IR presentation - Outotec

Page created by Elaine Erickson
 
CONTINUE READING
Sustainable use of Earth's natural resources - Q1 2017 IR presentation - Outotec
Sustainable use of
Earth’s natural resources
      IR presentation
         Q1 2017
Sustainable use of Earth's natural resources - Q1 2017 IR presentation - Outotec
Safety performance
                                                                              Outotec global safety statistic                                • Lost Time Incidents per million
                                                                                     12-months running average
                                                                                                                                               working hours (LTIR) includes
                                                           14
                                                                                                                                               Outotec employees and
                                                           12
                                                                                                                 Lost Time Incident            contractors working under
                                  Rate per million hours

                                                           10                                                    Total Recordable Incident     Outotec supervision.
                                                           8                                                                                 • Since 2015, Outotec has had
                                                           6
                                                                                                                                               less working hours than in
                                                                                                                                               2013-14 when there where
                                                           4
                                                                                                                                               large projects with
                                                           2                                                                                   extraordinary safety
                                                           0                                                                                   performance compared to
                                                                                                                                               global peers.

                           2                                    Q1 2017   OUTOTEC IR presentation
© Outotec – All rights reserved
Sustainable use of Earth's natural resources - Q1 2017 IR presentation - Outotec
Outotec at a glance
                                                                  Business overview                                                             Financial performance
                                                                                                                EUR million                             Sales                     Operating profit margin                     %
                               • Outotec is a global leader in minerals and metals processing                       2400
                                                                                                                                                                                  2,087
                                                                                                                                                                                                                             12

                                                                                                                                                                                                                             10
                                 technology, deliveries to more than 80 countries                                    2000
                                                                                                                                                                                           1,912
                                                                                                                                                                                                                             8
                               • Outotec designs and delivers tailored solutions for minerals and                    1600
                                                                                                                                                1,218
                                                                                                                                                                          1,386                    1,403
                                                                                                                                                                                                            1,201
                                                                                                                                                                                                                             6

                                 metals processing, water treatment, and waste-to-energy                             1200               1,000
                                                                                                                                                          878
                                                                                                                                                                  970
                                                                                                                                                                                                                    1,058    4
                                                                                                                               740                                                                                           2
                                                                                                                      800
                               • Delivers solutions which minimize the plant’s lifetime cost by                                                                                                                              0
                                 maximising recovery and utilizing less energy and water.                             400
                                                                                                                                                                                                                             -2

                                                                                                                        0                                                                                                    -4
                               • HQ in Finland, some 4,200 employees (2016) in 34 countries                                   2006 *)   2007    2008      2009    2010    2011     2012    2013    2014     2015    2016
                                                                                                                     *) Combined basis                            2010 onwards aEBIT, excl. restructuring and acquisition-related
                                                                                                                                                                  costs as well as purchase price allocation amortizations.

                                                                      Key figures                                                               Geographic coverage
                                                                                            FY 2016   FY 2015
                                  Net Sales, EUR million                                      1,058     1,201
                                  Share of services in sales, %                                 42        43
                                  Gross Margin, %                                               22        28
                                  Adjusted EBIT, % (excl. one-time items)                        -2        5
                                  Gearing, %                                                     -1       10
                                  Equity ratio, %                                               40        31
                                  Balance sheet total, EUR million                                                                                      Outotec R&D, sales and service centers
                                                                                              1,427     1,531                                           Outotec manufacturing/assembly

                           3           Q1 2017                    OUTOTEC IR presentation
© Outotec – All rights reserved
Sustainable use of Earth's natural resources - Q1 2017 IR presentation - Outotec
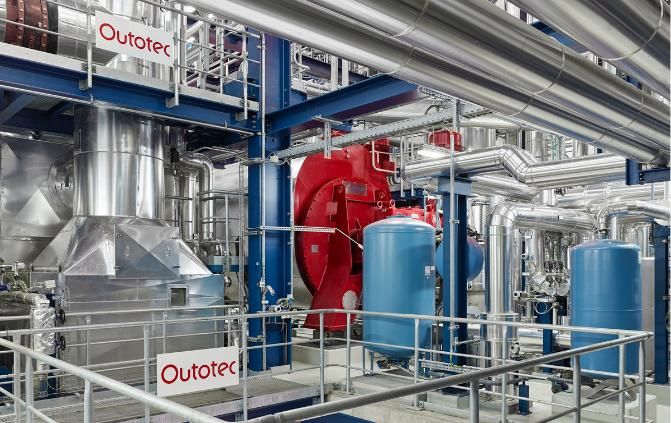
A century of accumulated expertise 1/2

                           4      Q1 2017    OUTOTEC
                                            OUTOTEC IRIRpresentation
                                                          presentation
© Outotec – All rights reserved
Sustainable use of Earth's natural resources - Q1 2017 IR presentation - Outotec
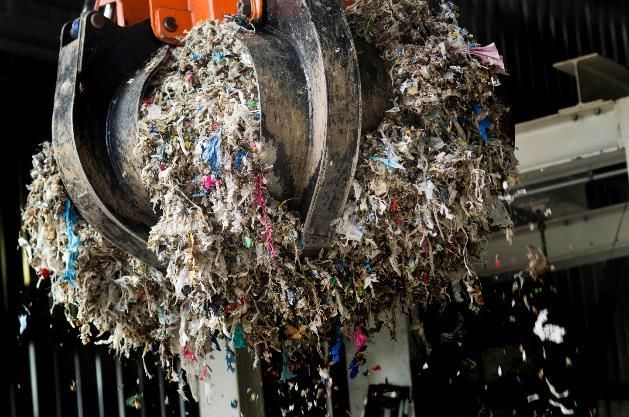
A century of accumulated expertise 2/2

                           5      Q1 2017   OUTOTEC IR presentation
© Outotec – All rights reserved
Sustainable use of Earth's natural resources - Q1 2017 IR presentation - Outotec
Minerals Processing segment’s offering
                                        A complete portfolio of leading process solutions and services with full plant delivery capability
                                      Grinding           Flotation            Thickening             Filtering           Analyzers          Automation          Tailings management      Services

                                                                                                                                                      Water
                                                                                                                                                   Technology
                                    1,100 grinding      10,000 flotation     1,800 thickeners     3,500 filters        Full analyser       Unique                   Full process        Prop equipment
                                    mills delivered,    units delivered      delivered, global    delivered, most      portfolio, lowest   combination of           and equipment       and total
                                    strong in S/M       since 1960s,big      project              efficient            min detection       automation &             portfolio,          process
                                    size mills and      cell technology      execution            concentrate          limits, only Xray   analysers,               effluent            knowhow,
                                    process             references,          capability,          filtering, proven    used                important for risk       treatment and       global service
                                    technology          automation           feedwell design      performance                              management               backfill plants     network

                                                             Competition fragmented, a number of players competing in part of the portfolio
                                  FLSmidth, CITIC,     FLSmidth, Metso,    FLSmidth, Tenova-     Aqseptence-          Thermo Fisher,       APC: Metso,             FLSmidth, Golder,   Customers own
                                  Metso,               BGRIMM, Tenova,     Delcor, WesTech       Diemme, Metso,       BGRIMM, Blue Cube    Woodgrove, SGS          GR Engineering,     maintenance,
                                  ThyssenKrupp         Woodgrove                                 Andritz, FLSmidth                         Minerals                AMC                 Major tech.
                                                                                                                                                                                       suppliers, Local
                                                                                                                                           DCS: Major DCS
                                                                                                                                                                                       companies
                                                                                                                                           suppliers

                           6           Q1 2017                OUTOTEC IR presentation
© Outotec – All rights reserved
Sustainable use of Earth's natural resources - Q1 2017 IR presentation - Outotec
Metals, Energy & Water segment’s offering
                                                             Industry-leading technologies, process solutions and services
                                   Alumina,                                                   Sulfuric acid/Off-                                Energy
                                                 Ferrous metals          Ferroalloys                                 Base metals (Cu, Ni,                           Water                Services
                                  Aluminum                                                     gas/Roasting           Zn, Au, Ag, PGM)

                    Alumina calciner,           Sintering, Pelletizing,    Smelting,          Sulfuric acid plant,   Smelting, Converting, Waste-to-energy,    Industrial water  Advisory, maintenance,
                   Green anode plants,             Direct Smelting      Preheating, Steel          Roasting           Leaching, SX/EW, Sludge incineration, treatment, municipal  operations & remote
                       Rod Shop                                           Belt Sintering                                electrorefining   Oil shale processing  water systems      services, upgrades

                          Strong in CFB         Over 60% of the           Strong in Ferro       650 acid plants       Strong in Cu           Versatile waste-     Effluent              Shutdown
                          Aluminium             world’s pellets are       Chrome, 20            and 270 non-          smelting, anode        to-energy            treatment plants,     services, best
                          Calcination and       made with                 pelletizing and       ferrous roasting      casting, SX and Zn     solution, over       backfill plants,      suited to provide
                          HOT Tube              Outotec’s                 sinter plants and     plants                leaching, strong in    250 materials        water recycling       services for own
                          Digestion             travelling grate          9 smelters for                              Ni smelting and        used                                       technologies
                                                technology                ferroalloys                                 EW

                                                         Competition fragmented, a number of players competing in part of the portfolio
                        Fives, FLSmidth,        Kobelco, Metso,         SMS Siemag,             GEA Bischoff,        Glencore               Valmet, Andritz,    Veolia, GE Water,     FLSmidth, Metso,
                        Metso,                  Primetals, Jemeco       Tenova, Jemeco          MECS                 Technology, Tenova     Babcock&Wilcox      Suez                  major tech suppliers,
                        Aqseptence-                                                                                                                                                   locals and customers
                        Diemme

                           7          Q1 2017               OUTOTEC IR presentation
© Outotec – All rights reserved
Sustainable use of Earth's natural resources - Q1 2017 IR presentation - Outotec
Long-term customer relationships with the industry’s top
                           companies
                                                                      Selected reference customers of Outotec

                                                                                                             Local mining and metallurgical
                                            Major global mining companies     Intermediate sized companies
                                                                                                             companies in emerging regions

                                             In history, top ten customers have accounted for some 35% of sales.

                           8      Q1 2017           OUTOTEC IR presentation
© Outotec – All rights reserved
Sustainable use of Earth's natural resources - Q1 2017 IR presentation - Outotec
Offering industry’s most sustainable processing technologies

                        Our handprint is bigger than our footprint
                        Thousands of tons of CO2-equivalent
                                                                                    5,870
                                                                                                                      The90th
                                                                                                                         most
                                                                                                                      sustainable
                                                                    5,469                         Environmental
                                  5,400                                                                             company in the
                                                                                                   Goods and
                                                                                                                     world (2017)
                                                                                                 Services equals
                                                  5,067
                                                                                                  to90%       of
                                                                                                 orders (2014-16)

                                          45              35                 34             26

                                    2013             2014               2015          2016
                                               Handprint: Greenhouse gas emissions avoided
                                               through use of Outotec’s technologies
                                               Footprint: Outotec’s greenhouse gas emissions

                           9         Q1 2017              OUTOTEC IR presentation
© Outotec – All rights reserved
Sustainable use of Earth's natural resources - Q1 2017 IR presentation - Outotec
Metals demand is forecasted to grow 2-4%
                                                                                                     SUPPLY                             DEMAND
                                         Share of Outotec sales by                                     2016F              2016F             CAGR%         Increase,
                                               end product                                         Production, Mt     Consumption, Mt      2015-25E          Kt/a
                                                                                      Aluminium         57,8               57,6              2,7 %          1692
                                                                                       Copper           22,5               22,3              1,8 %           419
                                                                                         Zinc           14,0               14,5              2,4 %           367
                                                                                        Nickel          2,0                1,9               1,4 %            29
                                          Copper             28%

                                              Iron           11%

                                            Nickel            5%
                                       Aluminium
                                                             11%
                                             Zinc
                                                              2%
                                  Precious Metals
                                                             12%

                        Energy and environmental
                                       solutions*            12%

                                       Ferroalloys            3%
                                       Other Metals                 0%

                                           Others            16%

                                                              2016
                                       * Incl. water, sulfuric acid and off-gas

                                                                                                   Source: Wood Mackenzie, Morgan Stanley, Outotec analysis
                           10       Q1 2017                              OUTOTEC IR presentation
© Outotec – All rights reserved
Deep downcycle expected to turn into a decent growth

                                            Total Capex per type, MUSD                        +8%
                                                                                -51%
                                            150 000

                                            140 000

                                            130 000

                                            120 000

                                            110 000

                                            100 000
                                                                                                                           Project visibility gap
                                             90 000

                                             80 000

                                             70 000

                                             60 000

                                             50 000
                                                                                                                Including greenfield
                                                                                                                and brownfield expansion
                                             40 000

                                             30 000                                                               30 000

                                             20 000

                                             10 000                                                             Sustaining capex
                                                 0

                                                       2010 2011 2012 2013 2014 2015 2016 2017 2018 2019 2020
                                                                                                                 Source: Woodmac, June 2016
                           11     Q1 2017             OUTOTEC IR presentation
© Outotec – All rights reserved
Maintenance Capex to remain flat, expansion Capex
                           expected to grow esp. in copper, gold, zinc and nickel
                            Sustaining capex                                                                    Expansion capex
                            per metal                                                                           per metal                                                      +14%
                                                                                   0%
                                                                -25%
                                  40 000                                                                          110 000                               -63%
                                                                                                                  105 000
                                                                                                                  100 000
                                  35 000                                                                           95 000
                                                                                                                   90 000
                                                                                                    Lead           85 000
                                  30 000
                                                                                                    Alumina        80 000
                                                                                                                                                                                    Project visibility gap
                                                                                                                   75 000
                                                                                                    Aluminium
                                  25 000                                                                           70 000
                                                                                                    Zinc
                                                                                                                   65 000
                                                                                                    Nickel         60 000
                                  20 000                                                            Iron Ore       55 000                                                                                 Lead
                                                                                                                   50 000                                                                                 Alumina
                                                                                                                   45 000
                                                                                                                                                                                                          Zinc
                                  15 000                                                                           40 000
                                                                                                                                                                                                          Nickel
                                                                                                    Gold           35 000
                                                                                                                   30 000
                                                                                                                                                                                                          Aluminium
                                  10 000
                                                                                                                   25 000                                                                                 Iron Ore
                                                                                                                   20 000                                                                                 Gold
                                   5 000                                                                           15 000
                                                                                                    Copper         10 000                                                                                 Copper
                                                                                                                    5 000
                                      0                                                                                0
                                           2010 2011 2012 2013 2014 2015 2016 2017 2018 2019 2020                           2010   2011   2012   2013   2014   2015   2016   2017    2018   2019   2020

                                                                                                                                                                  Source: Woodmac, June 2016
                           12              Q1 2017                   OUTOTEC IR presentation
© Outotec – All rights reserved
Mining and metals production country ranking – Cu, Zn, Ni

                           13     Q1 2017   OUTOTEC IR presentation
© Outotec – All rights reserved
Mining and metals production country ranking – Al, Au, Fe

                           14     Q1 2017   OUTOTEC IR presentation
© Outotec – All rights reserved
Long-term financial targets - Road map to 2020

                                                                                                                     Best                             aEBIT*
                                                                                    R&D,
                                  Current                                                                            cost                Efficiency   10%
                                  aEBIT*              Services                      Design-to-
                                                                                                                     country                          2020
                                                                                    cost
                                                                                                                     sourcing
                                                    Annual average
                                                    service sales growth
                                                    5-15% (incl. M&A)

                                                    Gearing at max 50%

                        * Excluding    restructuring and acquisition-related costs as well as purchase price allocation amortizations.

                           15        Q1 2017                  OUTOTEC IR presentation
© Outotec – All rights reserved
Service sales target

                                                    Average growth 5-15%
                                                             (June 7, 2016)

                                                                                                             Split in services, 2016
                                                    Grow performance services
                                                                                            O&M (incl. spare parts)                     Spare parts
                                                                                            Shutdown services
                                                 Grow spare & wear parts business
                                                                                                                        42% of
                                                                                            Modernizations              sales*

                                            Strengthen service capabilities and intensity

                                                                                                    Technical services

                    Customers need services that improve productivity and reduce opex
                                                                                                                * Target: 40%+ over the cycle

                           16     Q1 2017            OUTOTEC IR presentation
© Outotec – All rights reserved
Q1 2017 financial information

                    17            Q1 2017   OUTOTEC IR presentation
© Outotec – All rights reserved
Q1 in a nutshell
                                                                                                            Low level of
                                                                                                              advance
                                                                                                           payments and
                                                                                                            mature order
                                                                                                          backlog impacted
                                             Improved order                               Fixed cost         cash flow
                                                  intake:                                savings and
                                               equipment,                                higher sales
                                            plant and service                             improved
                                            orders increased                              profitability
                                                                             Good
                                                                        performance in
                                                                              MP

                                                  MEW’s
                                            profitability weak,
                                              cost savings
                                                 continue

                           18     Q1 2017     OUTOTEC IR presentation
© Outotec – All rights reserved
Improved order intake, markets in EMEA and Americas most
                    active
                                     Americas 35 (29) %                                       EMEA 53 (46) %                                 APAC 12 (25) %

                                     Filtration plant to copper                                Aluminium technology to
                                     concentrator expansion in Peru                            Bahrain N/D
                                     >15 M€
                                                                                                                         EUR million

                        COPPER                                                    Aluminium                              400

                                                                                                                         300
                                                                                                                                                    115       Service orders
                                     Zinc plant technology to Mexico
                                     Approx. 24 M€                                                                       200

                                                                                                                                                              Capex orders
                                                                                                                                       102
                            ZINC                                                                                         100                        203

                                                                                                                                       68
                                                                                   MP           MEW
                                                                                  order         order                      0
                                                                                                                                  Q1/2016         Q1/2017

                           19      Q1 2017              OUTOTEC IR presentation
© Outotec – All rights reserved
Seasonality in MP orders, MEW showing signs of recovery

                        MEUR                         Minerals Processing                                           MEUR                   Metals, Energy & Water
                       1100                                                                                        1700

                       1000                                                                                        1500

                          900                                                                                      1300

                          800                                                                                      1100

                          700                                                                                      900

                          600                                                                                      700

                          500                                                                                      500

                          400                                                                                      300

                                  Order intake 6 months rolling, annualized   Sales 6 months rolling, annualized          Order intake 6 months rolling, annualized   Sales 6 months rolling, annualized

                           20      Q1 2017                    OUTOTEC IR presentation
© Outotec – All rights reserved
Spare part orders increased, fewer shutdown service
                           contracts
                              • Service orders increased 13%                                                 Services
                                                                      650
                              • Sales declined 13% due to             600
                                                                      550
                                fewer shutdown service                500
                                                                      450
                                contracts in MEW                      400
                                                                      350
                              • Services represent 37 (48)% of
                                sales                                       Order intake 6 months rolling, annualized         Sales 6 months rolling, annualized

                                                                                              Split in service order intake

                                                                                       Recurring services         Shut-downs and modernizations

                           21     Q1 2017   OUTOTEC IR presentation
© Outotec – All rights reserved
Improved order intake YoY, book to bill rate above one

                                            EUR million
                                            2 400

                       Roughly              2 200
                   EUR 680 million          2 000                                                                                                                                                                                                                                                                                                                                                                                                                         EUR 1,051
                  to be delivered in        1 800                                                                                                                                                                                                                                                                                                                                                                                                                  million, some
                        2017
                                            1 600                                                                                                                                                                                                                                                                                                                                                                                                                 21% services
                                            1 400
                                            1 200
                                            1 000
                                                                                                                                                                                                                                                                         803
                                             800                                                                                                                                                                                                                                                        736

                                             600                                        493
                                                                                                                                                                                                                                                               532
                                                                                                                                     475                                                                                                                                                                      452 471 491
                                                                                                      418                                                                                                   419                                                                               425                                                                   426                                                          395
                                                              371                                                384                                                                                                   350                                                                                                                      366                                                                                                                                   318
                                             400                                                                           299
                                                                                                                                                                                                                                   357 344
                                                                                                                                                                                                                                                                                   327
                                                                                                                                                                                                                                                                                                                                                                                        380
                                                                                                                                                                                                                                                                                                                                                                                                             322                           268 267                        281 274 283
                                                    240                 235                                                                     260                                                                              269                                                                                                                      230                                     266                  260
                                                                                                                                                                                        202                                                                                                                                                                                   210
                                             200                                  168                                                                       139
                                                                                                                                                          120   106                        111
                                                                                                                                                                                                                                                                                                                                                                                                                                                                170

                                               0
                                                    Q2/2006
                                                              Q3/2006
                                                                        Q4/2006
                                                                                  Q1/2007
                                                                                            Q2/2007
                                                                                                       Q3/2007
                                                                                                                 Q4/2007
                                                                                                                           Q1/2008
                                                                                                                                      Q2/2008
                                                                                                                                                Q3/2008
                                                                                                                                                          Q4/2008
                                                                                                                                                                    Q1/2009
                                                                                                                                                                              Q2/2009
                                                                                                                                                                                        Q3/2009
                                                                                                                                                                                                  Q4/2009
                                                                                                                                                                                                             Q1/2010
                                                                                                                                                                                                                       Q2/2010
                                                                                                                                                                                                                                 Q3/2010
                                                                                                                                                                                                                                           Q4/2010
                                                                                                                                                                                                                                                     Q1/2011
                                                                                                                                                                                                                                                               Q2/2011
                                                                                                                                                                                                                                                                         Q3/2011
                                                                                                                                                                                                                                                                                    Q4/2011
                                                                                                                                                                                                                                                                                              Q1/2012
                                                                                                                                                                                                                                                                                                        Q2/2012
                                                                                                                                                                                                                                                                                                                  Q3/2012
                                                                                                                                                                                                                                                                                                                            Q4/2012
                                                                                                                                                                                                                                                                                                                                      Q1/2013
                                                                                                                                                                                                                                                                                                                                                Q2/2013
                                                                                                                                                                                                                                                                                                                                                          Q3/2013
                                                                                                                                                                                                                                                                                                                                                                    Q4/2013
                                                                                                                                                                                                                                                                                                                                                                              Q1/2014
                                                                                                                                                                                                                                                                                                                                                                                        Q2/2014
                                                                                                                                                                                                                                                                                                                                                                                                   Q3/2014
                                                                                                                                                                                                                                                                                                                                                                                                             Q4/2014
                                                                                                                                                                                                                                                                                                                                                                                                                       Q1/2015
                                                                                                                                                                                                                                                                                                                                                                                                                                 Q2/2015
                                                                                                                                                                                                                                                                                                                                                                                                                                            Q3/2015
                                                                                                                                                                                                                                                                                                                                                                                                                                                      Q4/2015
                                                                                                                                                                                                                                                                                                                                                                                                                                                                Q1/2016
                                                                                                                                                                                                                                                                                                                                                                                                                                                                          Q2/2016
                                                                                                                                                                                                                                                                                                                                                                                                                                                                                    Q3/2016
                                                                                                                                                                                                                                                                                                                                                                                                                                                                                              Q4/2016
                                                                                                                                                                                                                                                                                                                                                                                                                                                                                                        Q1/2017
                                                     Order backlog at the end of the period                                                                                                                                                    Share of unannounced orders                                                                                                                         Order intake by quarter

                           22     Q1 2017       OUTOTEC IR presentation
© Outotec – All rights reserved
Sales reflecting increased equipment orders in 2016
                                                                                                                                           In
                                                                                                               Q1     Q1   Change,
                                  EUR million                                                                2017   2016
                                                                                                                                   comparable
                                                                                                                                % currencies
                                  Sales                                                                      268    240      12%         7%
                                  Service sales                                                               99    114     -13%       -18%
                                  Share of services in sales, %                                               37     48
                                  Gross margin, %                                                             23     24
                                                         *
                                  Adjusted EBIT                                                                1     -5
                                                         *
                                  Adjusted EBIT , %                                                            0     -2
                                  - Restructuring and acquisition-related costs                               -0     -6
                                  - PPA amortization                                                          -2     -2
                                  EBIT                                                                        -1    -12
                                  EBIT, %                                                                     -0     -5
                                  Result for the period                                                       -3    -12
                                  Unrealized and realized gains related to valuation
                                  of FX forward agreements                                                     2      1
                              * Excl.   restructuring and acquisition-related costs and PPA amortizations.

                           23           Q1 2017                                 OUTOTEC IR presentation
© Outotec – All rights reserved
Minerals Processing - further improved performance

                     • Equipment orders increased, order
                       intake up 40%
                     • Sales increased 36%
                     • Profitability improved

                        Minerals Processing                                  Q1        Q1 Change,    In comp      Sales and adjusted EBIT development, quarter
                        EUR million                                        2017      2016      % currency, %      350                                            20%
                                                                                                                                       Sales        aEBIT*, %    18%
                                                                                                                  300
                        Order intake                                         146        104             40   35                                                  16%
                                                                                                                  250                                            14%
                        Sales                                                153        113             36   31   200                                            12%
                                                                                                                                                                 10%
                        Service sales                                         68         64             6    -0   150                                            8%
                                               *)                                                                 100                                            6%
                        Adjusted EBIT                                          11          5                                                                     4%
                                                                                                                  50
                        Adjusted EBIT*), %                                      7          4                                                                     2%
                                                                                                                   0                                             0%
                        Unrealized and realized

                                                                                                                        Q1/2012
                                                                                                                        Q2/2012
                                                                                                                        Q3/2012
                                                                                                                        Q4/2012
                                                                                                                        Q1/2013
                                                                                                                        Q2/2013
                                                                                                                        Q3/2013
                                                                                                                        Q4/2013
                                                                                                                        Q1/2014
                                                                                                                        Q2/2014
                                                                                                                        Q3/2014
                                                                                                                        Q4/2014
                                                                                                                        Q1/2015
                                                                                                                        Q2/2015
                                                                                                                        Q3/2015
                                                                                                                        Q4/2015
                                                                                                                        Q1/2016
                                                                                                                        Q2/2016
                                                                                                                        Q3/2016
                                                                                                                        Q4/2016
                                                                                                                        Q1/2017
                        gains/losses related to valuation
                        of FX forward agreements                               -0          2
                          *   Excl. restructuring and acquisition-related costs and PPA amortizations

                           24        Q1 2017                  OUTOTEC IR presentation
© Outotec – All rights reserved
Metals, Energy & Water – order intake improved but result
                           still negative
                           • 161% increase in order intake
                           • Sales declined 10% due to low opening
                             order backlog
                           • Profitability weak, savings actions
                             continue
                             Metals, Energy & Water                            Q1         Q1 Change,    In comp    Sales and adjusted EBIT development, quarter
                             EUR million                                     2017       2016      % currency, %    400                                            20%
                                                                                                                                      Sales       aEBIT*, %
                             Order intake                                      172         66         161    160   350
                                                                                                                                                                  10%
                                                                                                                   300
                             Sales                                             114        127          -10   -12                                                  0%
                                                                                                                   250
                             Service sales                                       30        50          -39   -40   200                                            -10%
                             Adjusted EBIT        *)                                                               150
                                                                                 -9         -9                                                                    -20%
                                                                                                                   100
                             Adjusted EBIT*), %                                  -8         -7                      50
                                                                                                                                                                  -30%

                             Unrealized and realized                                                                0                                             -40%

                                                                                                                         Q1/2012
                                                                                                                         Q2/2012
                                                                                                                         Q3/2012
                                                                                                                         Q4/2012
                                                                                                                         Q1/2013
                                                                                                                         Q2/2013
                                                                                                                         Q3/2013
                                                                                                                         Q4/2013
                                                                                                                         Q1/2014
                                                                                                                         Q2/2014
                                                                                                                         Q3/2014
                                                                                                                         Q4/2014
                                                                                                                         Q1/2015
                                                                                                                         Q2/2015
                                                                                                                         Q3/2015
                                                                                                                         Q4/2015
                                                                                                                         Q1/2016
                                                                                                                         Q2/2016
                                                                                                                         Q3/2016
                                                                                                                         Q4/2016
                                                                                                                         Q1/2017
                             gains/losses related to valuation
                             of FX forward agreements                             3         -1
                              *   Excl. restructuring and acquisition-related costs and PPA amortizations

                           25          Q1 2017                  OUTOTEC IR presentation
© Outotec – All rights reserved
Mature order backlog, timing, and low level of advance
                           payments impacted cash flow
                                                                                                       Q1     Q1
                              EUR million
                                                                                                     2017   2016
                              Result for the period                                                    -3    -12
                              Adjustments
                              - Depreciation & amortization                                            10     10
                              - Other adjustments                                                       3      7
                              Change in working capital                                               -42    -37
                              Interest                                                                 -1      0
                              Taxes                                                                    -2     -2
                              NET CASH FROM OPERATING ACTIVITIES                                      -34   -34
                              NET CASH USED IN INVESTING ACTIVITIES (incl. Capex and acquisitions)     -4    -3
                              Repayments & borrowings of non-current debt                              -0   -60
                              Hybrid bond                                                               -   150
                              Interest paid on hybrid bond                                            -11     -
                              Other financing activities                                               11    -0
                              NET CASH FROM FINANCING ACTIVITIES                                      -1     90
                              NET CHANGE IN CASH AND CASH EQUIVALENTS                                -39     53
                              Foreign exchange rate effect on cash and cash equivalents                2     -2
                              Cash and cash equivalents at March 31                                  195    352
                           26     Q1 2017         OUTOTEC IR presentation
© Outotec – All rights reserved
Liquidity and equity remained solid
                                                                                                                                             Q1                   Q1
                                                                                                                                           2017                 2016

                             Net interest-bearing debt*, EUR million                                                                         44                 -69
                             Gearing*, %                                                                                                       9                -13
                             Equity-to-assets ratio*, %                                                                                      39                  41
                             Return on investment, %, LTM                                                                                     -8                  -2
                             Return on equity, %, LTM                                                                                       -12                   -6
                             Working capital at the end of the period, EUR million                                                           18                 -58
                             Advances received                                                                                              178                 229
                             Equity, EUR million                                                                                            490                 538
                             Balance sheet total, EUR million                                                                            1,422              1,556
                                  * If
                                    the hybrid bond were treated as a liability the net interest-bearing debt EUR 194.1 million, gearing 57.1% and equity-to-
                                  assets ratio would be 27.4% (March 31, 2016: EUR 80.5 million, 20.7% and 29.3% respectively).

                           27            Q1 2017          OUTOTEC IR presentation
© Outotec – All rights reserved
Market outlook

                                                      MP opportunities in
                                                           process
                                                                                                  Timing of large
                                                       improvements,
                                                                                                  orders remains
                                                      smaller equipment
                                                                                                 difficult to foresee
                                                        deliveries and
                                                           services          Gold and copper
                                                                              projects most
                                                                             active, improved
                                                                              activity also in
                                                                            other base metals
                                                                                  projects
                                                       MEW technology
                                                       portfolio provides
                                                       opportunities in a
                                                        number of end
                                                            markets

                           28     Q1 2017   OUTOTEC IR presentation
© Outotec – All rights reserved
Reiterated guidance: The guidance for 2017 is based on
                           the current order backlog and market outlook, as well as
                           achieved cost savings

                                     Expected sales
                                                                                                            From backlog                     From new orders
                                        in 2017                              Q1 sales
                                  ~ EUR 1,050 – 1,150              =       EUR 268 million          +         ~EUR 680
                                                                                                            million, or 65%
                                                                                                                                      +      ~EUR 100 – 200
                                                                                                                                                 million
                                         million

                                                                                  Adjusted EBIT*
                                                                       is expected to be approximately 3-5%
                             * Excluding   restructuring and acquisition-related costs as well as purchase price allocation amortizations.

                           29      Q1 2017              OUTOTEC IR presentation
© Outotec – All rights reserved
Our focus areas for 2017 - towards profitable growth!

                                                                                  • Continue to win orders in a competitive
                                                                                    market

                                                                                  • Continue cost savings to reach stability in
                                                                         Growth     the Metals, Energy & Water

                                                                                  • Strong focus on service business, new
                                                                                    Services business unit since April 1

                                                                                  • Improve competitiveness of products
                                                Profitability

                                                                                  • Strengthen customer centricity

                                  Stability                                       • Strategy work

                           30         Q1 2017        OUTOTEC IR presentation
© Outotec – All rights reserved
Interest bearing loans and hybrid bond, repayment profile
                                            MEUR
                                                   400

                                                   350

                                                   300

                                                   250                         Hybrid bond
                                                                               EIB R&D loan
                                                   200
                                                                               NIB R&D loan
                                                   150                         Senior unsecured bond
                                                                               Other IB debt
                                                   100

                                                   50

                                                    0
                                                         Q4/16
                                                         Q1/17
                                                         Q2/17
                                                         Q3/17
                                                         Q4/17
                                                         Q1/18
                                                         Q2/18
                                                         Q3/18
                                                         Q4/18
                                                         Q1/19
                                                         Q2/19
                                                         Q3/19
                                                         Q4/19
                                                         Q1/20
                                                         Q2/20
                                                         Q3/20
                                                         Q4/20
                                                         Q1/21
                           31     Q1 2017            OUTOTEC IR presentation
© Outotec – All rights reserved
Mature backlog ties up capital
                   EUR million                                                                                                                                      %
                              300                                                                                                                                   1,60

                                                                                                                                                                    1,40
                              200
                                                                                                                                                                    1,20
                              100
                                                                                                                                                                    1,00

                                  0                                                                                                                                 0,80

                                                                                                                                                                    0,60
                            -100
                                                                                                                                                                    0,40
                            -200
                                                                                                                                                                    0,20

                            -300                                                                                                                                    0,00
                                         Dec 2009    Dec 2010         Dec 2011     Dec 2012   Dec 2013      Dec 2014      Dec 2015    Dec 2016       Mar 2017

                                                    Working Capital                 CAPEX                Free cash flow              Book-to-bill (Order intake / Sales)

                           32         Q1 2017            OUTOTEC IR presentation
© Outotec – All rights reserved
POC and cash flow profile example
                                                Timing of large project completions affects quarterly earnings

                                             MEUR
                                             120
                                                       0%                                                                                                                                  100%

                                                         Percentage of Completion, %
                                                                                                                                                                                                          Timing of large project
                                             100                                                                                                                                                          completions, and
                                                                                                                             Total order backlog                                                          possible release of
                                                                                                                              structure in 2015                                                           provisions, affects
                                                                                                                                                                                                          quarterly earnings.
                                              80

                                                                                                            Total order backlog
                                              60                                                             structure in 2012

                                                      Advance
                                              40      payment
                                                      ~10-30%

                                              20

                                               0
                                            Month    1 2 3 4 5 6 7 8 9 10 11 12 13 14 15 16 17 18 19 20 21 22 23 24 25 26 27
                                                                                            POC            Cumulative cashflow
                                                                                                                                         NOTE: The figures are illustrative and vary project by project

                           33     Q1 2017              OUTOTEC IR presentation
© Outotec – All rights reserved
Equity to assets ratio, gearing and liquidity at healthy
                           levels
                                                                                                   Equity to assets ratio          Gearing
                                            50,0                                                                                                                                        20,0

                                            45,0                                                                                                                                        0,0

                                            40,0
                                                                                                                                                                                        - 20,0

                                            35,0
                                                                                                                                                                                        - 40,0
                                            30,0
                                                                                                                                                                                        - 60,0
                                            25,0
                                                                                                                                                                                        - 80,0
                                            20,0

                                                                                                                                                                                        - 100,0
                                            15,0

                                                                                                                                                                                        - 120,0
                                            10,0

                                             5,0                                                                                                                                        - 140,0

                                             0,0                                                                                                                                        - 160,0
                                                   Dec 2006    Dec 2007   Dec 2008   Dec 2009   Dec 2010   Dec 2011   Dec 2012   Dec 2013   Dec 2014   Dec 2015   Dec 2016   Mar 2017

                  Cash at hand                       171          291        318        258       280        403        359        324        282        301        233        195

                           34     Q1 2017                     OUTOTEC IR presentation
© Outotec – All rights reserved
Customer solutions

                    35            Q1 2017   OUTOTEC IR presentation
© Outotec – All rights reserved
Laiva Gold mine in Finland
                           Customer case, ore sorting

                                                              Customer challenge
                                                              • Mine is closed because of low head
                                                                grade ore
                                                              • Study completed around Outotec ore
                                                                sorting solution considering reopening
                                                                the mine

                           Outotec solution
                           • Outotec sensor-based ore
                             sorting solution removing                                                   Study indicates that the Outotec ore sorting solution
                             waste rock and improving the                                                enables reopening the mine:
                             head grade.                                                                   “The economic assessment for the Laiva Gold Mine
                           • When waste rock is removed                                                    indicated the potential for restarting the site, which
                             there is less ore feed to the                                                 can be operated on a long-term basis at a broad
                             crushing and grinding circuit,                                                range of commodity prices. Base-case net present
                             reducing energy and water                                                     value of €77 million, producing 529,000 troy ounces
                             consumption                                                                   of gold over a seven-year mine life.”

                           36     Q1 2017                 OUTOTEC IR presentation
© Outotec – All rights reserved
Reducing mill downtime at a gold mine
                           Customer case, comminution

                        Customer challenge
                        • Excessive grinding mill downtime during the year                                                               Customer benefits
                          leading to decreased yearly production                                                                         •  50% less downtime due to mill
                        • Unplanned mill downtime due to liner failure                                                                      maintenance
                        • Inadequate tooling                                                                                             •  In total a reduction of 170 hours
                        • Limited reline shutdown planning                                                                                  of reline incurred downtime
                        • Coordination between different maintenance                                                                     •  Safer, less labor intensive relines
                          vendors                                                                                                        •  Circa 12-14 million USD in
                        • In total of over 340 hours downtime                                                                               additional production revenue
                          due to mill maintenance

                                                           Outotec solution
                                                           •  Pre shutdown planning
                                                           •  Liner redesign – to reduce the number of pieces
                                                           •  Tooling improvements – liner handler, skid steers & hand tooling
                                                           •  Changes to liner fixtures & fittings
                                                           •  Continuous Improvement Program
                                                           •  Optimizing liner life time through Outotec patented MillMapper™ software

                           37     Q1 2017             OUTOTEC IR presentation
© Outotec – All rights reserved
HIGmillTM fine grinding for FQM Kevitsa
                           Customer case, comminution

                     Customer challenges                              Outotec solution
                     • Fine valuable minerals                         • Mineral analysis showed very fine grind < 20 micron required for
                       and difficult to recover                         copper & nickel liberation
                     • 12% copper not                                 • Outotec conducted laboratory HIGmill fine grinding and mineral
                       recovered in copper                              recovery (flotation) tests
                       circuit due to poor                            • HIGmill chosen as most energy efficient and smallest footprint
                       liberation                                       technology on market today which would improve mineral recovery
                     • If liberation poor,                              and grade
                       copper-nickel                                  • Installation & commissioning only 2 weeks in Feb 2015
                       separation insufficient                        • Outotec provided ramp-up and operation support
                     • Existing plant in arctic
                       circle with limited
                       footprints                                     Customer benefits
                                                                      • HIGmill improved overall plant performance
                                                                      • Copper loss to nickel circuit improved from 12% to 8%
                                                                      • Overall copper recovery increased by up to 1.5%
                                                                          • 1.5% increase represents around $1million increase in final
                                                                            copper value, after smelting and refining to produce LME grade
                                                                            copper
                                                                      • Improved concentrate grades
                                                                          • Less nickel in final copper concentrate
                                                                          • Less copper in final nickel concentrate
                                                                      • Installed & commissioned without effecting production
                                                                      • HIGmill allowed coarser primary grind and hence higher plant
                                                                        throughput
                                                                      • More metal out of same ton of ore < 2 year payback
                           38     Q1 2017         OUTOTEC IR presentation
© Outotec – All rights reserved
Turn-key flotation retrofit with fast turnaround
                           Customer case, flotation
                           Customer challenge
                           • Poor flotation performance in terms of copper and gold recovery                   Customer benefits
                           • Flotation circuit had poor availability                                           • Greater stability and control of flotation cells
                           • Substantial maintenance requirements                                              • Significantly decreased energy consumption
                           • Limited time available for shutdown                                                 with Outotec cells (40%)
                                                                                                               • Minimized production losses during
                                                                                                                 installation and commissioning
                                                                                                               • Increased flotation circuit availability, leading
                                                                                                                 to increased production
                                                                                                               • Improved recovery of coarse particles

                           Outotec solution
                           • In-depth metallurgical assessment identified large improvement potential in the
                             flotation plant
                           • Retrofit of 10 x 160 m 3 flotation cells
                           • A full turn-key delivery
                           • Advanced operator training with Outotec´s Virtual Experience training

                           39     Q1 2017               OUTOTEC IR presentation
© Outotec – All rights reserved
Digitalization creating new growth and opportunities -
                           managing water balance and quality at mine sites

                                                           Solution: Intelligent digital solution for monitoring and managing data
                                                                        on the mine site’s water balance and quality.

                                                                                                        Alternative             Mitigation
                                                                                                           water                 of risks
                                                                                                         sources

                                                                                                                                             License
                                                                                                                       Stable                   to
                                                                                              Access
                                                                                                                      process                operate
                                                                                             to water
                                  Online        Digital        Modeling &   Predictability
                                  monitoring    platform       simulation   & reliability

                                                             Value: Sustainable balance of water supply and consumption,
                                                               while stabilizing production and reducing business risks.

                           40         Q1 2017                 OUTOTEC IR presentation
© Outotec – All rights reserved
Holistic process water management reduces
                           operational risks, OPEX and effluents

                                                                                                                * Example of 20 Mt/a Cu concentrator water balance
                                                                                                                in Chilean climate using paste tailings, price of raw
                                                                                                                water 4 USD / m3.

                                                                With higher closure rate
                                                                • Reducing raw water need
                                                                • Reducing process variations to improve yield
                                                                • Process water doesn’t need to be potable water grade
                                                                • At full closure basically no effluents
                                                                • Less socio-political risk related to fresh water

                           41     Q1 2017   OUTOTEC IR presentation
© Outotec – All rights reserved
Holistic tailings management can bring significant cost
                           savings and reduces safety risks

                           • Holistic tailings management covers both
                             surface and underground operations.         Footprint
                                                                         = 100%
                                                                          OPEX       Footprint
                           • Paste and dry stacking technologies                      = 72%
                                                                         = 100%                  Footprint
                             combined with closed water loops are                     OPEX
                                                                                                  = 53%
                                                                                      = 75%                  Footprint
                             the best available technologies for                                  OPEX
                                                                                                              = 12%
                                                                                                  = 58%
                             conserving water within the concentrator                                         OPEX
                                                                                                              = 37%
                             environment.
                           • The short and long term risks can be
                             significantly reduced by reducing the         WET       THICKENED    PASTE        DRY
                                                                         TAILINGS     TAILINGS               STACKING
                             amount of water in the surface tailings                                                      PASTE
                                                                                                                         BACKFILL
                             storage facility.

                           42     Q1 2017      OUTOTEC IR presentation
© Outotec – All rights reserved
Codelco Ministro Hales 1/2
                           Customer case, full solution

                                          •Codelco and Outotec          Customer challenges
                                           start working together
                                           on solving the               • Ore with very high content of impurities, primarily
                                  1991     challenges                     arsenic causing challenge in processing
                                                                        • Commercial terms for the concentrate not
                                                                          favourable for selling
                                          •Investment decision
                                           made
                                  2010

                                          •Commissioning
                                                                                                                                Outotec solution
                                           completed                                                                            • Several studies and test campaigns over the years to identify
                                  2014
                                                                                                                                  best metallurgical solution
                                                                                                                                • Complete, integrated process which is based on patented
                                                                                                                                  Outotec solutions and technologies and proven Outotec
                                          •Official inauguration                                                                  proprietary equipment
                                  2016
                                                                                                                                • Arsenic levels of the concentrate lowered without loosing sulphur
                                                                                                                                • Sustainable water and effluent treatment in challenging
                                                                                                                                  environment

                           43        Q1 2017                   OUTOTEC IR presentation
© Outotec – All rights reserved
Codelco Ministro Hales 2/2
                           Customer case, full solution
                                  Outotec delivers a complete, integrated solution from a broad portfolio of patented and
                                  proprietary solutions, and a long history of process technology

                                  Partial roasting
                                  • Patented Outotec solution which
                                    removes over 90% of the arsenic in
                                    the ore concentrate
                                  • Exceeding 605,000 tpa concentrate
                                    (110%)

                                  Gas Cleaning
                                  • Outotec’s proprietary gas cleaning            Effluent Treatment
                                    and sulfuric acid production                  • Outotec’s proprietary effluent treatment technology cleans the process
                                    technology eliminates over 99.9% of             effluents and recirculates clean water back to the process.
                                    the gaseous emission of the facility.

                           44         Q1 2017           OUTOTEC IR presentation
© Outotec – All rights reserved
Norilsk Nickel, Nadezhda Flash Smelting Furnace No.1
                           modernization
                           Customer case, modernization

                                                                      Customer challenge
                                                                      • Changing raw material base requires dealing with low-heat value
                                                                        and more complex concentrates
                                                                      • Very tight implementation schedule
                                                                      • Supplier responsible for providing Russian Safety Approvals
                                                                        which is normally out of scope

                                                                      Outotec solution
                                                                      • Higher capacity feeder and concentrate burner and new furnace
                                                                        cooling elements and cooling monitoring system based on Outotec
                                                                        proprietary technologies
                                                                      • Pre-planning and experienced personnel
                                                                      • Extensive performance guarantees combined with a long-term service
                                                                        contract
                                                                      • Using internal and external resources to obtain Russian Safety
                                                                        Approvals
                                                                      • Short implementation and down time and fast ramp up after start up

                           45     Q1 2017   OUTOTEC IR presentation
© Outotec – All rights reserved
Pelletizing Segregation Solution
                           Customer case, profitability improvement

                            Customer challenge                                      Outotec solution
                            Customer had a profitability challenge in an iron-ore   • Assess to identify improvement potential
                            pelletizing plant in Brazil                                   • Plant Performance Assessment
                                                                                          • CFD Study
                                                                                          • Pot Grate Tests
                                                                                    • Design a tailored solution
                                                                                          • 3D area scanning
                                  Productivity                                            • Double Deck Roller Screen basic design
                                                  Product                                 • Shutdown planning
                                                  Quality                           • Deliver a holistic, safe & efficient implementation
                                                                                          • Detail design for modernization
                                                                                          • Retrofit new Outotec Double Deck Roller Screen
                                        Fuel                                              • Shutdown execution
                                     Consumption                                    • Verify & support performance results
                                                                                          • Segregation verification test
                                                                                          • Energy efficiency test

                                                                                          Delivered Value*
                                                                                                 10.5% fuel savings
                                                                                                 Improved productivity
                                                                                                 2,8 M€ annual OPEX savings*
                                                                                                 6 month payback*
                                                                                        *Value Assumptions: Natural Gas: € 0.37/Nm3, Antracite: € 0.12/kg
                                                                                        Only estimates based on pot grate tests.
                           46       Q1 2017               OUTOTEC IR presentation
© Outotec – All rights reserved
ERZ Zürich, sludge incineration plant
                           Customer case, waste to energy
                                                                               Customer challenge
                                                                               • Sustainable solution required to treat sewage sludge from the entire canton of Zürich,
                                                                                 Switzerland covering over 70 waste water treatment plants!
                                                                               • March 2013 – public must approve such an investment in a referendum. 96% vote in favor,
                                                                                 project goes ahead
                                                                               • Summer 2015 – commissioning complete and plant goes into operation. October 2015 –
                                                                                 official inauguration.
                                                                               • Limitations for sewage sludge disposal in landfill and as fertilizer
                                                                               • High transport and logistics costs for sludge containing > 70% water
                                                                               • Strict emissions limits with plant location in the heart of Zürich

                              Outotec solution
                              • Self-sustaining thermal treatment of sewage sludge without additional fuel.
                                  • Thermal incineration of sewage sludge using Outotec fluidized bed technology
                                  • Thermal dryer using heat from the process.
                              • State-of-the-art flue gas cleaning system
                              • Phosphorus recovery possible from ash

                           47      Q1 2017               OUTOTEC IR presentation
© Outotec – All rights reserved
UK moving to a new renewable energy subsidy scheme

                                  Ending of the previous subsidy
                                  scheme resulted in record high
                                  order intake for Outotec Waste              6 plants &
                                  to Energy solutions for Advanced         4 O&M (12-years)
                                  staged gasification using
                                  renewable fuels

                                                                                1 plant,
                              New subsidy scheme continued to              next CFD auction
                              be good for Outotec Waste to
                              Energy technologies
                                                                             expected late
                                                                                 2016

                           48          Q1 2017              OUTOTEC IR presentation
© Outotec – All rights reserved
Levenseat Renewable ltd
                           Customer case, waste to energy

                                                        Customer challenge                      Outotec solution
                                                        • UK is exporting high amounts of RDF   • Waste to Energy plant in UK
                                                          to be incinerated in Europe           • Gasification of waste is an environmentally friendly way of
                                                        • High landfill cost in the UK            efficiently converting waste to energy
                                                                                                • Reliable and tested solution based on the Outotec Fluidized
                                                                                                  bed technology with over 100 references
                                                                                                • 2015 Contract signing, 2017 expected start up

                           49     Q1 2017   OUTOTEC IR presentation
© Outotec – All rights reserved
Performance services

                                                                                                       Improved equipment         Improved
                                                   Improved health and           Decreased                                                                 Improved capital
                                                                                                          and process           environmental
                                                         safety                 operating cost                                                                efficiency
                                                                                                            efficiency            efficiency

                                  Our solutions
                                     target to
                                     address
                                    customer
                                   challenges
                                  and improve
                                       their
                                  performance
                                  and efficiency

                     Service offering
                     building blocks
                                                      Advisory         Maintenance        Operations         Remote         Spare and           Training
                                                                                                                                                                  Upgrades
                                                      Services          Services           Services          Services       Wear Parts          Services

                           50         Q1 2017         OUTOTEC IR presentation
© Outotec – All rights reserved
Shareholder information, April 30
                                                                                                   % of shares
                                                                                         Shares     and votes    Change +/-   Change %

                             1      Solidium Oy                                       27,265,232        14.89            0           0
                             2      Varma Mutual Pension Insurance Company            12,778,363         6.98            0           0
                             3      Ilmarinen Mutual Pension Insurance Company        11,234,530         6.14            0           0
                             4      Tamares Nordic Investments B.V.                   10,192,356         5.57            0           0
                             5      The State Pension Fund                             4,000,000         2.18            0           0
                             6      Keva                                               2,425,120         1.32            0           0
                             7      Outotec Oyj                                        1,804,401         0.99            0           0
                             8      Nordea Nordic Small Cap Fund                       1,747,612         0.95      688,311       64.98
                             9      Holding Manutas Oy                                 1,600,000         0.87            0           0
                             10     Sijoitusrahasto Aktia Capital                      1,000,751         0.55            0           0
                             11     Mandatum Life Insurance Company Limited              898,993         0.49            0           0
                             12     Danske Invest Finnish Institutional Equity Fund      760,000         0.42      125,000       19.69
                             13     Etera Mutual Pension Insurance Company               717,000         0.39            0           0
                             14     Security Trading Oy                                  625,000         0.34            0           0
                             15     Etola Erkki                                          600,000         0.33            0           0
                             16     Kaleva Mutual Insurance Company                      550,000         0.30            0           0
                             17     OP Life Assurance Company Ltd                        414,143         0.23      -10,000       -2.36
                             18     Danske Invest Finnish Equity Fund                    390,000         0.21       80,000       25.81
                             19     Danske Invest Finland Opportunities                  338,302         0.18       30,000        9.73
                             20     Veikko Laine Oy                                      330,000         0.18

                           51     Q1 2017            OUTOTEC IR presentation
© Outotec – All rights reserved
Balance sheet reflects a stable financial position
                                   Net debt & Gearing                                                        Equity ratio

                                  Net debt MEUR
                                                                                         Gearing, %           %
                                  100                                                                 40     50

                                   50                                                                 20     45

                                    0                                                                 0      40

                                   -50                                                                -20    35

                                  -100                                                                -40    30

                                  -150                                                                -60    25

                                  -200                                                                -80    20

                                  -250                                                                -100   15

                                  -300                                                                -120   10

                                  -350                                                                -140   5

                                  -400                                                                -160   0
                                         2006 2007 2008 2009 2010 2011 2012 2013 2014 2015 2016                   2006 2007 2008 2009 2010 2011 2012 2013 2014 2015 2016

                                                      Net debt, actual         Gearing

                           53       Q1 2017              OUTOTEC IR presentation
© Outotec – All rights reserved
You can also read