Submarine mud volcanoes as a source of chromophoric dissolved organic matter to the deep waters of the Gulf of Cádiz - Nature
←
→
Page content transcription
If your browser does not render page correctly, please read the page content below
www.nature.com/scientificreports
OPEN Submarine mud volcanoes
as a source of chromophoric
dissolved organic matter
to the deep waters of the Gulf
of Cádiz
Valentina Amaral1,2*, Cristina Romera‑Castillo3 & Jesús Forja1
Seafloor structures related to the emission of different fluids, such as submarine mud volcanoes
(MVs), have been recently reported to largely contribute with dissolved organic matter (DOM) into the
oceans. Submarine MVs are common structures in the Gulf of Cádiz. However, little is known about
the biogeochemical processes that occur in these peculiar environments, especially those involving
DOM. Here, we report DOM characterization in the sediment pore water of three MVs of the Gulf of
Cádiz. Estimated benthic fluxes of dissolved organic carbon (DOC) and chromophoric DOM (CDOM)
were higher than in other marine sediments with an average of 0.11 ± 0.04 mmol m−2 d−1 for DOC and
ranging between 0.11 and 2.86 m−1 L m−2 d−1, for CDOM. Protein-like components represented ~ 70%
of the total fluorescent DOM (FDOM). We found that deep fluids migration from MVs (cold seeps)
and anaerobic production via sulfate-reducing bacteria represent a source of DOC and FDOM to the
overlying water column. Our results also indicate that fluorescent components can have many diverse
sources not captured by common classifications. Overall, MVs act as a source of DOC, CDOM, and
FDOM to the deep waters of the Gulf of Cádiz, providing energy to the microbial communities living
there.
Dissolved organic matter (DOM) is one of the Earth’s major carbon reservoirs and the largest ocean pool
of reduced carbon (662 Pg C)1. The fraction of DOM that absorbs light, referred to as chromophoric DOM
(CDOM), and its fluorescent sub-fraction (FDOM) are ubiquitous constituents of the ocean DOM pool, affecting
the optical properties of the water c olumn2,3. The major sources of marine DOM are photosynthesis from the
ocean surface and terrestrial inputs, however, marine sediments are also considered to be an important source
of DOM to the overlying seawater (~ 350 Tg C y−1)4, comparable to that estimated for rivers (~ 250 Tg C y−1)5.
Marine sediments are also a source of CDOM, but there is comparatively little information about the benthic
flux of CDOM and the nature of these compounds6. Recent studies suggest that seafloor features related to
large emissions of different fluids can act as sources of DOM and CDOM into the oceans7–9 therefore, having a
significant influence on the chemistry of the o ceans10.
Seafloor fluids can derive from microbiological and geological processes and they are classified in hydro-
thermal (40 °C up to 400 °C) and cold seeps (< 60 °C). Hydrothermal vents have been described as sinks of
DOC, removing 1.4 ± 0.7 × 10⁴ tons C yr−1 from the deep-ocean11,12. However, they have been also found to act
as a source of CDOM to the seawater9. Cold seeps comprise brines, methane and other hydrocarbons and are
mainly controlled by t ectonics13, but there is little information regarding the behavior of DOM from these fluids.
Submarine cold seepage could result in a variety of seafloor structures such as mud volcanoes (MVs).
Submarine MVs are broadly distributed on Earth continental shelves, insular slopes and abyssal parts of
inland seas ( 103–105)14. MVs are cone-shaped structures built up by mud breccia containing gases (mainly
methane), saline water, mud, and, occasionally, oil rising from deep pressurized sources through controlled
conduits15,16. They can be associated with the presence of chemosynthetic biological communities17,18. A recent
study in the South China Sea suggests that MVs are an important source of DOC to the deep waters through
1
Departamento de Química‑Física, INMAR, Universidad de Cádiz, Puerto Real, España. 2Ecología Funcional de
Sistemas Acuáticos, Centro Universitario Regional Este, Universidad de La República, Rocha, Uruguay. 3Instituto
de Ciencias del Mar-CSIC, Barcelona, España. *email: vamaral@cure.edu.uy
Scientific Reports | (2021) 11:3200 | https://doi.org/10.1038/s41598-021-82632-3 1
Vol.:(0123456789)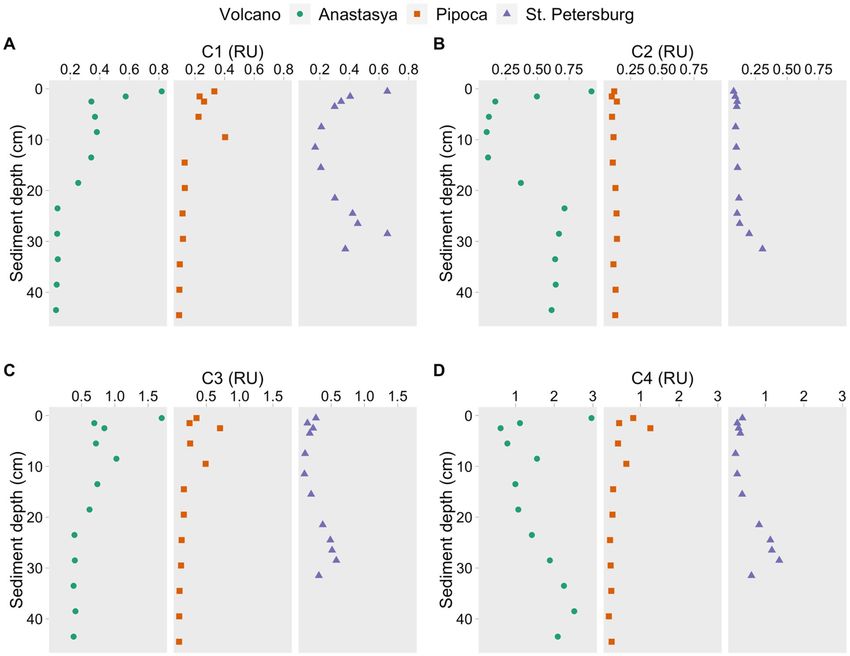
www.nature.com/scientificreports/
Figure 1. Map of the Gulf of Cádiz showing the location of the mud volcanoes.
benthic fluxes, and these could represent up to 24% of the total annual flux from the largest river that drains
into this s ea19. Moreover, Retelleti et al.20 also measured a high concentration of DOC and FDOM in pore water
from MVs (1–6 mM and 0.01–0.06 RU, respectively). The authors found that fluid migrating from deep sedi-
ments through MVs could be an important source of altered FDOM to the overlying water column, with a total
fluorescence of up to eight times higher than sediments without MVs. They suggest that these structures may
play a significant role in providing FDOM to the ocean. However, as far as we know, no studies have estimated
benthic fluxes of CDOM and FDOM from MVs yet, and their role in the deep ocean is poorly understood.
The Gulf of Cádiz is a tectonically active area where large fields of submarine MVs, associated with tectonic
compression due to the convergence of the African and the Eurasian p lates21, have been recently d
iscovered17,22,23.
Its geological features, the geochemistry and emission of fluids, and the benthic fauna associated with these fluids
have been widely studied16,17,24,25. However, no studies have focused on the dynamic and diffusive benthic flux
of DOM from these MVs.
This work aims to quantify and characterize DOM in the pore water of three MVs located in the Gulf of Cádiz
(Fig. 1), and to determine the possible sources of the different fractions of DOM. To do so, we measured DOC
concentration and DOM optical properties (absorbance and fluorescence). We also estimated diffusive benthic
fluxes of DOC, CDOM, and FDOM across the sediment–water interface at these MVs to better understand their
effect on the concentration and distribution of DOM into the deep water of the Gulf of Cádiz.
Results
Sediment pore water profiles of DOM and proxy of MVs fluids. Differences between cruises in pore
water samples were considered to be due to spatial heterogeneity previously described in MVs16. During Decem-
ber 2016, it was not possible to sample St. Petersburg (PT) due to weather conditions. Overall, similar values
between cruises were observed in Pipoca (PI) and Anastasya (AN) (p > 0.05). Only DOC concentration and BIX
values were higher in AN during June (p < 0.05). Thus, for simplicity, only the pore water profiles of June will be
presented, and those from December can be found in the Supplementary material (Fig. S1 and S2).
DOC concentration in pore water ranged from 0.63 to 4.08 mmol L−1, with higher values in PT (Table 1,
p < 0.001) and increasing with depth in the three MVs (Fig. 2A). The absorption coefficient a254 ranged between
9.58 and 36.25 m−1, with higher values in AN (Fig. 2B, p < 0.001) while a350 showed similar variations between
MVs (Fig. 2C, 0.48–3.91 m−1, p > 0.05). Although the spectral slope S275-295 showed similar values between MVs
(Fig. 2D, p > 0.05), ranging from 0.020 to 0.062 nm−1, AN and PI exhibited an opposite trend when compared to
PT. Thus, S 275-295 decreased with depth in AN and PI while in PT, it increased. Average values of S275-295 showed
that most of the DOM in the MVs was of relatively low molecular weight (Table 1).
Parallel factor analysis (PARAFAC) of pore water samples from the three MV resulted in a four-fluorescent-
components model (Fig. S3). The components were compared with previous studies in the OpenFluor database
with a Tucker Congruence Coefficient (TCC) > 0.97 (Table S2)26. Component 1 (C1) and 2 (C2) were previously
described as humic-like components of terrestrial and marine/microbial origin, respectively. Component 3 (C3)
and component 4 (C4) were referred to as protein-like components, accounting for 68% ± 17% of the total FDOM.
C4 resembles the amino acid tyrosine, and C3 is less common than other components. Amaral et al.27 found a
similar component to our C3 in the water column of the Gulf of Cádiz (labeled as C5) and they suggested it could
be a mixture of polycyclic aromatic hydrocarbon (PAH) and protein-like substances.
Humic-like C1 showed similar values between MVs (Table 1, Fig. 3A, p > 0.05). The rest of the fluorescent
components showed the highest intensities and variability in AN, with average values two and three-fold times
Scientific Reports | (2021) 11:3200 | https://doi.org/10.1038/s41598-021-82632-3 2
Vol:.(1234567890)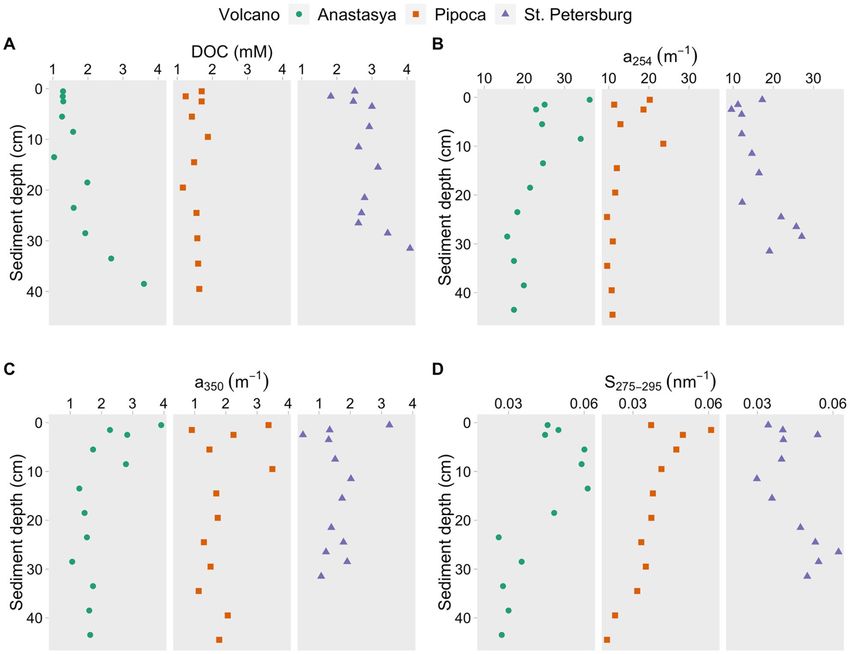
www.nature.com/scientificreports/
Anastasya Pipoca St. Petersburg
1.44 ± 0.67 1.50 ± 0.43 2.85 ± 0.56
DOC
(0.63–3.59) (0.74–2.43) (1.83–4.08)
24.36 ± 5.02 14.17 ± 3.59 16.63 ± 5.79
a254
(15.71–36.25) (9.59–23.59) (9.58–27.10)
1.93 ± 0.63 1.67 ± 0.66 1.59 ± 0.67
a350
(1.06–3.91) (0.91–3.49) (0.48–3.25)
0.045 ± 0.012 0.038 ± 0.009 0.045 ± 0.010
S275-295
(0.021–0.061) (0.020–0.061) (0.030–0.062)
0.25 ± 0.17 0.18 ± 0.08 0.37 ± 0.016
C1
(0.09–0.82) (0.09–0.40) (0.17–0.66)
0.36 ± 0.24 0.14 ± 0.02 0.13 ± 0.06
C2
(0.10–0.93) (0.10–0.18) (0.08–0.31)
0.55 ± 0.31 0.21 ± 0.14 0.29 ± 0.16
C3
(0.32–1.70) (0.09- 0.70) (0.10–0.58)
1.58 ± 1.03 0.39 ± 0.25 0.62 ± 0.41
C4
(0.51–4.07) (0.18–1.25) (0.23–1.36)
0.59 ± 0.12 0.74 ± 0.04 0.78 ± 0.07
HIX
(0.35–0.75) (0.61–0.80) (0.70–0.80)
1.19 ± 0.59 0.80 ± 0.07 0.80 ± 0.11
BIX
(0.75–3.42) (0.65–0.90) (0.57–0.98)
Table 1. Pore water average ± standard deviation values of dissolved organic carbon (DOC, mmol L−1),
absorption coefficient a254 and a350 (m−1), the spectral slope S275-295 (nm−1), fluorescent components (C1 to
C4, RU), humification (HIX) and freshness (BIX) indexes during June and December 2016 in Anastasya and
Pipoca and during June 2016 in St. Petersburg. Interval variations are shown in brackets.
Figure 2. Pore water profiles of dissolved organic carbon (A: DOC), absorption coefficients at 254 nm (B) and
350 nm (C) and the spectral slope S275-295 (D) in the three mud volcanoes.
Scientific Reports | (2021) 11:3200 | https://doi.org/10.1038/s41598-021-82632-3 3
Vol.:(0123456789)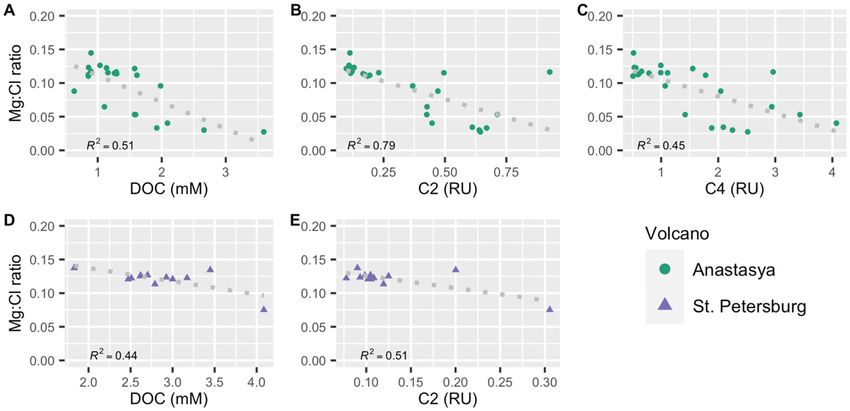
www.nature.com/scientificreports/
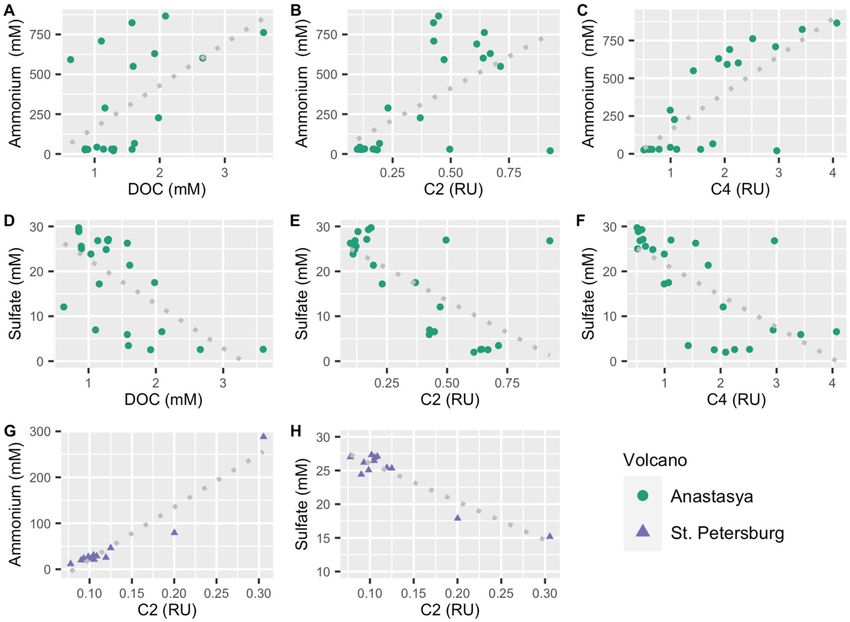
Figure 3. Pore water profiles of the PARAFAC fluorescent components (A: C1, B: C2, C: C3 and D: C4) in the
three mud volcanoes.
higher than in the other MVs (p < 0.001). In PI and PT, C2 and C3 had similar constant vertical distribution
with a slightly increase of C2 below 30 cm in PT (Fig. 3B,C). C4 also increased downward in PT while in PI, it
remained relatively constant with depth (Fig. 3D). In AN, maximum values of C2, C3, and C4 were found in
the first 0.5 cm, which sharply decreased until 2.5 cm, and below 13 cm C2 and C4 increased again downward
while C3 remained relatively constant.
Only AN exhibited a linear relationship between total fluorescence (C1 + C2 + C3 + C4) and DOC, with a
y-intercept of 0.49 mmol L−1 (p < 0.01, n = 22), which is the colorless fraction of DOM. Since the average DOC
concentration in AN was 1.44 mmol L−1, we estimated that 66% of the DOC pool in the pore water of this mud
volcano is composed of fluorescent material.
The humification and freshness indexes (HIX and BIX) showed an opposite pattern (Fig. S6) with the lowest
HIX values and highest BIX values in AN (Table 1, p < 0.001). In PI and PT, BIX values were lower than 1, while
in AN, the average value was > 1.
Linear relationships between C1 with C2 and C4 revealed differences in their dynamics depending on the mud
volcano (Table S3). C1 was negatively related with C2 and C4 in AN ( R2 = 0.71 and 0.53, p < 0.01), but positively
in PI (R2 = 0.71 and 0.82, p < 0.01) and PT ( R2 = 0.60 and 0.62, p < 0.01), while it was positively related with C3 in
the three MV ( R2 = 0.71 and 0.53, p < 0.01). The other fluorescent components only exhibited significant linear
relationships in PI and PT. Thus, the protein-like C3 and C4 showed a strong positive relationship between them
and to a lesser exert with C2. a254 showed a positive relationship with all fluorescent components in PI and PT, but
only with C1 and C3 in AN (R2 > 0.21, p < 0.01). No significant relationships were observed with a350 (p > 0.01).
Chloride (Cl) and magnesium (Mg) were measured in pore water samples and are described elsewhere (Jimé-
nez-López et al. submitted). Here, the Mg:Cl ratio was considered as a mixing indicator of seawater and MVs
fluids (Fig. 4). The smaller the ratio, the higher it will be the fraction of MVs fluid in the pore water s amples22.
Similar values were observed in the uppermost samples from the three MVs (0.5 cm, 0.11 ± 0.01), which mainly
correspond to the hemipelagic sediments. The Mg:Cl ratio decreased with depth in AN, reaching values of 0.03,
even smaller than those observed in other active M Vs22. Conversely, in PI and PT, the ratio remains relatively
constant, except for the last depth in PT where it decreases to 0.07 (31 cm). Similar trends and values were
observed between sampling periods (p > 0.05).
Scientific Reports | (2021) 11:3200 | https://doi.org/10.1038/s41598-021-82632-3 4
Vol:.(1234567890)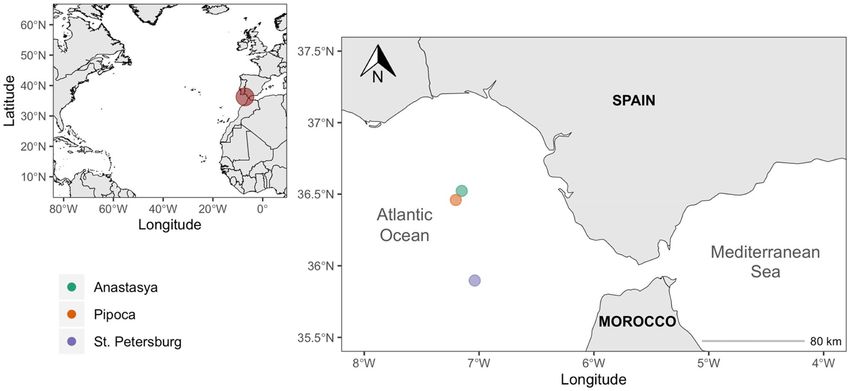
www.nature.com/scientificreports/
Figure 4. Pore water profiles of the Mg:Cl ratio in the three mud volcanoes.
Seawater profiles of DOM in the water column above the MVs. The concentration of DOC, a254,
and a350 were one and two orders of magnitude lower than those observed in pore water, ranging between 0.04
to 0.14 mmol L−1, 0.88 to 2.03 m−1, and 0.01 to 0.4 m−1, respectively (Fig. S4, p < 0.05). The spectral index S275-295
ranged between 0.018 and 0.045 nm−1, with an average value of 0.028 ± 0.007 nm−1, lower than those observed
in pore water samples (0.043 ± 0.01 nm−1).
For the water column samples, the PARAFAC model validated three largely described components in aquatic
systems, a humic-like and two protein-like components. The TCC between the fluorescent components in the
water column and pore water was < 0.95, implying that the components compared cannot be considered equal28.
Therefore, to compare the FDOM between both datasets, we applied the pick picking technique in the EEMs
from the water column29 using the same Ex/Em wavelengths of the PARAFAC components identified in the
pore water samples. Fluorescence intensity was tenfold higher in pore water than in the water column. C1 fol-
lowed the same trends in the three sites (p > 0.05), increasing with depth (Fig. S5) with a strong relationship with
temperature and salinity (R2 = 0.87, p < 0.01). In the water column, C2 and C3 were higher in AN than the other
sites (p < 0.05), increasing sharply with depth, associated with the thermocline and the peak of Chl a 27, while in
PI and PT, they remained relatively constants. C4 exhibited an irregular profile in the three sites (p > 0.05), and
an increase of C2, C3, and C4 was observed in the summit of AN and PT (Fig. S5).
Estimated diffusive benthic fluxes of DOC, CDOM, and FDOM. All variables showed positive
benthic flux toward the water column (Table 2). The estimated benthic fluxes of DOC varied between 0.07–
0.18 mmol m−2 d−1, being highest in PT. The estimated benthic fluxes of CDOM, as a254 and a350, ranged from
1.15 to 2.86 and from 0.11 to 0.31 ( m−1 L m−2 d−1), respectively, with higher values in AN. The humic-like C1
showed similar fluxes between MVs ranging from 0.02 to 0.05 (RU L m−2 d−1), while C2 ranged between 0.008
and 0.070 (RU L m−2 d−1) with the highest value in AN. Protein-like C4 showed the highest fluxes among the
fluorescent components ranging from 0.02 to 0.240 RU L m−2 d−1, with the highest value also in AN.
Discussion
The fluorescent components found in the pore water model have been described for several aquatic environ-
ments (Table S2). Our results support the hypothesis that similar components may have different sources6,30. In
the water column above the MVs, C1 and C2 showed the usual positive relationship between humic-like com-
ponents from similar sources ( R2 = 0.85, p < 0.001, n = 37), and mixing processes explained their distribution, in
agreement with previous studies in this zone27. The same occurs with the protein-like components, where C3
and C4 were positively related (R2 = 0.60, p < 0.001, n = 37), and probably associated with biological activity27.
Conversely, different behaviors were observed in pore water samples from the MVs. In AN, humic-like C1 and
C2 were negatively related (R2 = 0.71, p < 0.001, n = 58), and no relationship was observed between protein-like
C3 and C4, indicating differences in their sources and sinks. On the other hand, all fluorescent components in
PI and PT, showed a positive relationship among them (R2 > 0.50, p < 0.001, Table S3). Therefore, the processes
that produce and remove FDOM also differ between MVs.
One possible source could be the production of thermogenic DOM together with the production of meth-
ane. More than 2.4% of DOM compounds in the ocean are thermogenic7, and a previous work suggests that the
FDOM coming from the deep sediments of MVs fluids was mainly t hermogenic20. According to the authors, the
lower DOC-normalized fluorescence in the MVs, compared to those found in a reference site (without MVs), may
be due to the thermal quenching of the fluorophores. Based on stable carbon isotope composition of dissolved
methane in the column water above the MVs studied here, Sierra et al.31 found that methane emissions in AN
and PT are of thermogenic origin, while in PI, it seems to be of biogeochemical origin. Unfortunately, we did
not measure DOM composition of other pore water sediments in the zone to use as a reference site, and similar
Scientific Reports | (2021) 11:3200 | https://doi.org/10.1038/s41598-021-82632-3 5
Vol.:(0123456789)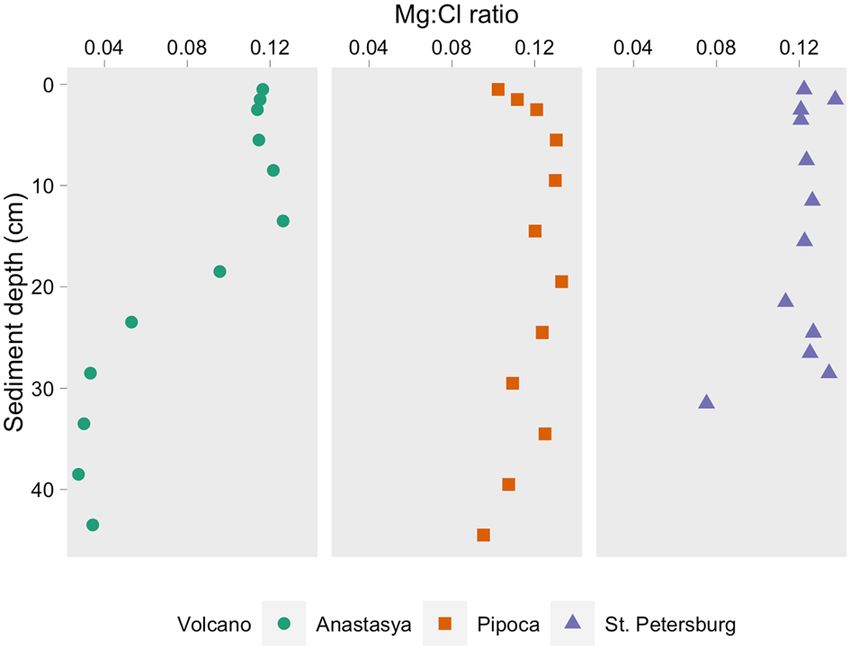
www.nature.com/scientificreports/
Variable Studies Range WD (m)
Anastasya 0.07–0.1 457
Pipoca 0.08–0.13 503
St. Petersburg 0.18 860
MVs from China Seaa 0.03–0.52 367–668
DOC Weddell Seab 0.1–0.54 316–494
(mmol m−2 d−1) European marginsc 0.05–0.16 180–4800
N Atlantic Oceand 0.08 300–1000
Arabian Seae 0.060–0.22 > 3000
NE Atlantic Oceane 0.05–0.12 > 4000
Estuarinef 0.96–1.10 12–15
Anastasya 2.12–2.86
a254
Pipoca 1.50–1.54
(m−1 L)(m−2 d−1)
St. Petersburg 1.15
Anastasya 0.15–0.31
a350 Pipoca 0.11–0.26
(m−1 L)(m−2 d−1) St. Petersburg 0.22
Arctic Oceang − 0.03–0.18 100–2240
Anastasya 0.03–0.05
Pipoca 0.02
C1
St. Petersburg 0.04
(RU L)(m−2 d−1)
Arctic Oceang 0–0.07 100–2240
Estuarinef 0.08–3.41 12–15
Anastasya 0.02–0.07
Pipoca 0.01
C2
St. Petersburg 0.008
(RU L)(m−2 d−1)
Arctic Oceang 0.02–0.06 100–2240
Estuarinef 0.08–3.97 12–15
Anastasya 0.02–0.13
C3 Pipoca 0.003
(RU L)(m−2 d−1) St. Petersburg 0.01
Estuarinef 0.19–6.09 12–15
Anastasya 0.05–0.24
Pipoca 0.05–0.07
C4
St. Petersburg 0.03
(RU L)(m−2 d−1)
Arctic Oceang − 0.04–0.03 100–2240
Estuarinef 0.19–6.09 12–15
Table 2. Estimated diffusive benthic fluxes of DOC, CDOM, and FDOM in the three MVs. Fluxes from
other regions are also displayed (WD: water column depth). a Hung et al.19; bHulth et al.58; cOtto and Balzer59;
d
Alperin et al.60; eLhajnar et al.61; fBurdige et al.35*; gChen et al.36. Positive fluxes are out of the MVs. *1
RU = 64 μg QS.
values of DOC-normalized fluorescence were observed between AN, PT and PI. Thus, a thermogenic origin of
FDOM in this work cannot be confirmed.
However, the differences in the DOM sources between MVs could be related to differences in their activity
stage, hence, with the intensity of the fluids moving upward from the deeper sediments. MVs alternate between
massive mudflow extrusion and dormant/sleeping periods17. According to Mazzini et al.18, most of the MVs are
currently in the latter, generally characterized by gas and water seepage of variable intensity. The Mg:Cl ratio
indicated a higher fraction of MVs fluid in AN than in the other MVs (Fig. 4) and Sierra et al.31 found an increase
of methane with depth in the water column above AN (100–125 nmol L−1) and PT (10–15 nmol L−1), whereas
in PI this trend was not observed. This is in agreement with a previous work analyzing benthic fauna associated
with seepage of MVs fluids, suggesting locally elevated gas fluxes that reach the seafloor surface, and higher activ-
ity in AN than P I17. Additionally, habitats with structures created by the escaping gas were also found in P T32,
and elevated methane fluxes have also been found in relatively active MVs in the Gulf of Cádiz16,33. The level of
extrusion activity between the MVs studied here is AN > PT > PI and it could be the reason for the existence of
different sources of DOM in the MVs. For example, in AN, DOC, C2 and C4 exhibited a negative relationship
with the Mg:Cl ratio ( R2 = 0.51, 0.79, 0.45, respectively, p < 0.001, n = 23, Fig. 5), indicating an increase with the
increasing mud volcano fluids. In PT, DOC and C2 also showed an inverse relationship with this ratio, weaker
than in AN, but significant (R2 = 0.44 and 0.51, respectively, p < 0.01, n = 12, Fig. 5), while no relationships were
Scientific Reports | (2021) 11:3200 | https://doi.org/10.1038/s41598-021-82632-3 6
Vol:.(1234567890)www.nature.com/scientificreports/
Figure 5. Linear relationship between the Mg:Cl ratio with dissolved organic carbon (DOC) and fluorescent
components in Anastasya (A–C) and St. Petersburg (D,E). Only the relationships with p < 0.01 are shown.
MV Cruise DOC a254 a350 C1 C2 C3 C4
AN June 3.5 16.0 1.5 0.1 0.6 0.3 2.0
AN Dec 2.0 30.9 1.8 0.1 0.4 0.4 4.0
PI June 1.6 9.6 1.6 0.1 0.1 0.1 0.2
PI Dec 2.1 12.2 1.1 0.1 0.1 0.1 0.2
PT June 4.0 17.8 0.9 0.4 0.3 0.3 0.6
Table 3. Production of dissolved organic carbon (DOC, mmol L−1), chromophoric DOM (as a254 and a350,
m−1) and fluorescent components (C1 to C4, RU) in the pore water sediments of Anastasya (AN), Pipoca (PI)
and St. Petersburg (PT) during June and December 2016. The net increase is indicated (= value bottom depth
pore water − value bottom water).
observed in PI (p > 0.01). Our results indicate that cold seeps from MVs could be a source of DOC and FDOM
to shallower sediments and, eventually, to the overlying water column.
We found a net production of DOC, CDOM, and FDOM to the overlying water column in the three MVs
(Table 3). However, as previously discussed for PI, and given the R 2 of the relationship between DOM and the
Mg:Cl ratio found in AN and PT, there might be other factors and sources implicated in the final distribution
of DOM. In sediments, there is generally a net production of DOM as a result of organic matter degradation
processes4. Sulfate is one of the main electron acceptors available for the oxidation of organic matter in marine
sediments; hence sulfate reduction is an important diagenetic process below the oxic z one34. Several studies in
marine sediments found that FDOM could be produced via anaerobic degradation of particulate organic matter
through sulfate reduction or oxidation of methane35–37. Luek et al.30 found that the production of FDOM was
directly related to sulfate-reducing bacteria in incubations of coastal sediments. The decomposition of organic
matter by sulfate reduction consumes sulfate and releases a mmonium34. Both sulfate and ammonium were
measured in pore water samples from the three MVs and are described elsewhere (Jiménez-López et al. submit-
ted). Accordingly, in AN, the increase of DOC concentration, C2 and C4 was accompanied by the increase in
ammonium (Fig. 6A–C, R2 = 0.28, 0.75 and 0.79, respectively, p < 0.01, n = 23) concurrent with the decrease of
sulfate (Fig. 6D–F, R2 = 0.39, 0.89 and 0.59, respectively, p < 0.01, n = 23). Moreover, in AN, these fluorescent
components were related to a decrease in DOM humification and with an increase of freshly released DOM
(Table S3). In PT, only C2 exhibited a strong relationship with ammonium and sulfate, with the same trends
as in AN (Fig. 6G,H, R2 = 0.91 and 0.87, respectively, p < 0.01, n = 12), whereas no relationship was observed in
PI (p > 0.01). These results suggest that DOC concentration, C2 and C4 could also be related to the activity of
sulfate-reducing bacteria in MVs sediments.
Additionally, AN is characterized by the presence of large microbial mats in its summit, associated with cold
seep and extremophiles conditions in its anoxic sediments, while chemosynthetic-based communities have
also been found in P T17,38. The biological release of DOC has been previously reported in seep environment
characterized by the presence of microbial mats in the Hydrate R idge39. The deep DOC in fluid seepage may
stimulate the microbial community to release autochthonous organic matter and enhance heterotrophy in seep
Scientific Reports | (2021) 11:3200 | https://doi.org/10.1038/s41598-021-82632-3 7
Vol.:(0123456789)www.nature.com/scientificreports/
Figure 6. Linear relationship between ammonium and sulfate with dissolved organic carbon (DOC) and
fluorescent components C2 and C4 in Anastasya (A–F) and St. Petersburg (G,H). Only the relationships with
p < 0.01 are shown.
environments39. Based on BIX values, Retelleti et al.20 suggested that MVs have more abundance of DOC from
biological sources than sediments without MVs, which has been attributed to the direct release of DOC from
microorganisms. This could explain the highest BIX values observed in AN (> 1 up to 3), which corresponds to
the presence of DOM recently r eleased40. Anaerobic production of DOM via sulfate-reducing bacteria might
also be a source of DOM in AN and, to a lesser extent, in PT, providing energy to the microbial communities
living there. These processes were also suggested as one of the responsible of FDOM composition in other M Vs20.
On the other hand, deep cold seep fluids and biological activity appear to be a minor source of DOM in
PI, probably linked to the lower seepage activity of this mud volcano, as previously mentioned. Although PI is
located in the same MVs field than AN (Table S1), it is strongly influenced by bottom currents from Mediter-
ranean waters32 and organisms not associated with fluid emissions, but typical in these waters, such as dense
crinoid beds, had been observed in its s ummits17. We hypothesized that the net increase of DOM observed in PI
(Table 3) could be due to abiotic processes such as condensation, fragmentation, or physical dissolution of POM
to DOM3,41. For example, abiotic condensation of FDOM could be responsible of refractory organic m atter3. This
could explain the negative relationship between FDOM components with BIX observed in PI, but not observed in
the other MVs (Table S3), as well as the relatively less variable DOM profiles in pore water (Table 1, Figs. 2 and 3).
Our results agree with previous works that suggest that similar fluorescent components may have different
sources6,30. Humic-like C2 was first proposed as a component of marine origin29, but further studies indicate
that this component is observed in almost all aquatic environments (Table S2), and its signal was then attrib-
uted to microbial humic-like fluorescence3. In the water column of the Gulf of Cádiz, C2 was described from
both autochthonous and allochthonous sources27, while in this work it was related to cold seeps from MVs and
bacterial sulfate-reduction. Several works indicate that ‘humic-like’ DOM is also produced in the absence of ter-
rocesses3,30,42. Our results support the hypothesis that spectral regions originally
restrial sources or humification p
defined as “humic-like” can have many diverse sources not considered by the traditional classification29. On the
other hand, the distribution of C1 might be explained by deposition from the water column and/or solubiliza-
tion, given the similar distribution observed between MVs (p > 0.05), while the net increase observed might be
due to abiotic processes. Another possibility could be C1 production by solubilization of the terrestrial organic
matter that has settled.
Scientific Reports | (2021) 11:3200 | https://doi.org/10.1038/s41598-021-82632-3 8
Vol:.(1234567890)www.nature.com/scientificreports/
Finally, C3 was described as a mixture of PAH and protein-like components related to anthropogenic pol-
lution in the water column of the Gulf of Cádiz27. Although MVs could also be a source of PAH18, a unique
source cannot be distinguished using PARAFAC. Spectral fluorescence overlapping between fluorophores with
low excitation wavelength such as PAH43 and signals from proteins44 might result in a mixture of fluorophores.
Moreover, Sharma et al.45 found a similar component to our C3 in soil organic matter and described it as a
mixture of terrestrial humic-like and tryptophan fluorescence (peak-T)29 with almost no biological production,
degradation or absorption. Accordingly, C3 was positively related to the terrestrial C1 in the three MVs (Table S3)
and also with the peak-T (R2 = 0.63, p < 0.01, n = 60) suggesting that C3 could be a mixture of fluorophores with
different sources.
Continental margin sediments may be responsible for a significant fraction of DOM delivered to the marine
environment6,35,46. The benthic fluxes of DOC were in the range of those estimated in other MVs and most con-
tinental slopes, and lower than those from estuarine sediments (Table 2). The highest estimated benthic flux of
DOC was observed in PT, which could be due to the higher DOC concentrations observed here (Table 1). We
can conclude that cold seep from MVs acts as a source of DOC to the deep waters, probably minimal compared
to other oceanic sources (e.g. 250 × 106 tons y−1 from rivers).
Although no information of diffusive benthic flux of CDOM and FDOM from MVs was found, our data was
compared with those from marine sediments and hydrothermal vents. Benthic flux of CDOM (as a254 and a350)
showed higher values than those reported for marine sediments, whereas the fluxes from the humic-like com-
ponents were in the same range (Table 2). Among the fluorescent components, protein-like estimated benthic
fluxes from AN were one order of magnitude higher than those in PI and PT and also in marine sediments. Our
results suggest that MVs could act as a source of CDOM and FDOM to the deep waters of the Gulf of Cádiz.
Noteworthy, benthic fluxes from a reference site without mud volcanoes in this zone will improve our findings.
Conclusions
Cold seeps from MVs and biological activity via anaerobic sulfate-reducing bacteria represent a source of DOC,
CDOM, and FDOM to the deep waters of the Gulf of Cádiz, providing energy and resources to the deep het-
erotrophic microbial communities. However, further studies are needed to better understand the role of mud
volcanoes in DOM cycling in the deep water of the Gulf of Cádiz (e.g. stable isotopes, FT-ICR-MS, amino acid
analysis).
Methods
Site description. The Gulf of Cádiz is located between the SW continental margin of the Iberian Peninsula
and the NW margin of Africa (Fig. 1). It is strongly influenced by the exchange of Atlantic and Mediterranean
water masses through the Strait of Gibraltar and it is characterized by the presence of several areas of hydro-
carbon-rich fluid venting structures (e.g., MVs, pockmarks, carbonate chimneys and crusts, mud mounds and
diapiric ridges)17,22,47,48.
The study was carried out in three MVs: Anastasya and Pipoca, situated in the Guadalquivir Diapiric Ridge
Field, and St. Petersburg, in the deeper Tasyo field, located between 457 and 860 m depth (Table S1). Recent work
found that bottom waters at these MVs exhibit high methane concentrations, especially in AN31. Based on cold
seep fauna at the summit of these MVs and the characteristic of the mud breccia sediments (e.g., gas bubbles,
smell of H2S), AN seems to be the more active one among the three MVs studied here17.
Sampling and analytical methods. Two cruises were carried out onboard R/V Angeles Alvariño and
Ramón Margalef during June and December 2016. Seawater samples from the water column were collected from
5 m to the summit of each MV (n = 44), and pore water samples were collected from gravity cores inside each
MV. The 44 seawater samples were taken using Niskin bottles (10 L) mounted on a rosette-sampler coupled to a
Seabird CTD 911 + to measure temperature and salinity. Details regarding the measurements of physicochemical
variables are described elsewhere27. For measuring DOC concentration, absorbance and fluorescence, seawater
was filtered using precombusted filters (Whatman GF/F, nominal pore size 0.7 µm, 450 °C, 4 h). Both optical
analyses were performed on board with the same settings described below. Samples for DOC concentration were
frozen in acid-clean HDPE bottles until analysis.
Two 1 m long gravity cores of 9.5 cm inner diameter were collected from inside each mud volcano. Sub-
samples from each core were taken onboard. Sections of 1 cm thickness were carefully sliced at different depths
(~ 0.5 to 45 cm below the seafloor) and stored frozen until analysis. Sediments and pore water samples were
treated in an inert atmosphere using N 2 to minimize exposure to oxygen. Pore water samples were collected
by centrifugation (~ 100 g of sediment, 30 min, 10.000 G and 10 °C, SIGMA-18KS, n = 60) and then filtered
(Millipore HPF 0.45 µm). Combusted GF/F filters significantly increase their retention capacity due to compac-
tion of the borosilicate microfibers49, hence no significant differences associated with using different filters for
pore water and seawater samples are expected in this work. Even though centrifugation could have an effect on
DOM composition, it would be minimal compared to other techniques when analyzing FDOM50,51. It does not
require pretreatment and it is currently the most widely used method for collecting pore water from sediments
for DOC and FDOM analyses (see references Table 2). Magnesium (Mg), chloride (Cl) and sulphate concentra-
tions were measured in pore water samples by ionic chromatograph (Metrohm 881/882, Compact IC pro, plus,
CV = 1.78 ± 0.26%), and ammonium was measured using a segmented flow auto-analyser (Skalar, San Plus)
(Jiménez-López et al. submitted). For DOC analysis, pore water was diluted in MilliQ and stored frozen until
analysis using a Multi N/C 3100 Analytik Jena analyzer (instrument variability = 43 ± 1.8 mM, Hansell CRM
Program). UV–visible absorption spectra were immediately scanned from 250 to 800 nm using a spectrometer
(JASCO-V750) using a 1 cm path length quartz cuvette. The estimated detection limit of the spectrophotometer
Scientific Reports | (2021) 11:3200 | https://doi.org/10.1038/s41598-021-82632-3 9
Vol.:(0123456789)www.nature.com/scientificreports/
for quantifying CDOM absorption is 0.0015 absorbance units or 0.03 m1 (1 cm cuvette), and the noise is 0.00004
absorbance units (specifications JASCO-750). A blank was measured every six samples to detect and correct
instrument drift. We calculated the absorption coefficient at 254 and 350 nm and the spectral slope S 275-29552,53.
Excitation-emission matrixes (EEMs) at 250–450/300–560 nm were immediately obtained using a spectrofluo-
rometer with an accessory for temperature control (JASCO FP-8300, EHC-813). Prior to PARAFAC modeling,
EEMs from seawater and pore water samples were standardized (e.g. blank subtraction, instrument correction
factor, Raman and Rayleigh scatter band were trimmed, and inner filter effect was corrected), and normalized
to Raman Unit (RU) using the drEEM 0.2 toolbox for Matlab54. Fluorescent components were validated using
split-half validation and random-initialization a nalysis54. We also calculated the humification (HIX) and freshness
index (BIX) following Huguet et al.40. Further details for the calculation of spectral indexes, EEMs standardiza-
tion, and PARAFAC analysis are described in a previous w ork27.
Assuming diffusive transport across the sediment–water interface, we estimated the benthic fluxes of DOC,
CDOM (as a254 and a350), and FDOM components from the MVs using Fick’s first law of diffusion following
Burdige et al.35 and Hung et al. 19.
J = ϕDsdC/dz
where φ is porosity, Ds is the bulk sediment diffusion coefficient corrected for sediment tortuosity (θ2) accord-
0/θ2, D0 is the free solution coefficient (1.585 × 10⁻⁶ cm2 s−1)55 and θ2 was estimated using the modified
ing to D
Weissberg relationship ( Boudreau56, θ2 = [1 − 2 Ln (ϕ)]). Finally, dC/dz was calculated as the difference between
the bottom water and pore water concentration at 0.5 cm. It should be noted that bottom water collected at ~ 5 m
above MVs was used, thus benthic flux estimation should be treated with a degree of caution, since, in general,
water overlying the sediments (~ 30 cm) should be u sed36. To apply the same method, for FDOM we used the
values obtained by pick picking techniques of the four PARAFAC components in both bottom and pore water
samples.
Statistical analysis. Two ways ANOVA and the post hoc Tukey test were performed to assess differences
in DOM (factor 1: MVs and factor 2: cruises). A significance level of 0.05 was selected. Linear regression models
were used to determine the relationship between DOM variables and were considered statistically significant
when p < 0.01. All analyses were performed with R 1.3.1073 software57.
Data availability
The datasets generated during the current study are available from the corresponding author on reasonable
request.
Received: 3 August 2020; Accepted: 18 January 2021
References
1. Hansell, D. A., Carlson, C. A., Repeta, D. J. R. & Schlitzer, R. Dissolved organic matter in the ocean: A controversy stimulates new
insights. Oceanography 22, 202–211 (2009).
2. Nelson, N. B. & Siegel, D. A. The global distribution and dynamics of chromophoric dissolved organic matter. Ann. Rev. Mar. Sci.
5, 447–476 (2013).
3. Coble, P. G., Lead, J., Baker, A., Reynolds, D. M. & Spencer, R. G. M. Aquatic Organic Matter Fluorescence (Cambridge University
Press, Cambridge, 2014).
4. Burdige, D. J. & Komada, T. Sediment Pore Waters. Biogeochemistry of Marine Dissolved Organic Matter 2nd edn. (Elsevier Inc.,
Amsterdam, 2015). https://doi.org/10.1016/B978-0-12-405940-5.00012-1.
5. Raymond, P. A. & Spencer, R. G. M. Riverine DOM. Biogeochem. Mar. Dissolved Org. Matter Second Ed. https://doi.org/10.1016/
B978-0-12-405940-5.00011-X (2015).
6. Stedmon, C. A. & Nelson, N. B. The optical properties of DOM in the ocean. Biogeochem. Mar. Dissolved Org. Matter Second Ed.
https://doi.org/10.1016/B978-0-12-405940-5.00010-8 (2015).
7. Dittmar, T. & Koch, B. P. Thermogenic organic matter dissolved in the abyssal ocean. Mar. Chem. 102, 208–217 (2006).
8. Pohlman, J. W., Bauer, J. E., Waite, W. F., Osburn, C. L. & Chapman, N. R. Methane hydrate-bearing seeps as a source of aged dis-
solved organic carbon to the oceans. Nat. Geosci. 4, 37–41 (2011).
9. Yang, L. et al. Absorption and fluorescence of dissolved organic matter in submarine hydrothermal vents off NE Taiwan. Mar.
Chem. 128–129, 64–71 (2012).
10. Tryon, M., Brown, K., Dorman, L. R. & Sauter, A. A new benthic aqueous flux meter for very low to moderate discharge rates.
Deep. Res. Part I Oceanogr. Res. Pap. 48, 2121–2146 (2001).
11. Lang, S. Q., Butterfield, D. A., Lilley, M. D., PaulJohnson, H. & Hedges, J. I. Dissolved organic carbon in ridge-axis and ridge-flank
hydrothermal systems. Geochim. Cosmochim. Acta 70, 3830–3842 (2006).
12. Hawkes, J. A. et al. Efficient removal of recalcitrant deep-ocean dissolved organic matter during hydrothermal circulation. Nat.
Geosci. 8, 856–860 (2015).
13. Ceramicola, S., Dupré, S., Somoza, L. & Woodside, J. Cold seep systems. Submar. Geomorphol. https://doi.org/10.1007/978-3-319-
57852-1 (2018).
14. Milkov, A. V. Worldwide distribution of submarine mud volcanoes and associated gas hydrates. Mar. Geol. 167, 29–42 (2000).
15. Dimitrov, L. I. Mud volcanoes—A significant source of atmospheric methane. Geo-Marine Lett. 23, 155–161 (2003).
16. Vanneste, H. et al. Spatial variation in fluid flow and geochemical fluxes across the sediment-seawater interface at the Carlos Ribeiro
mud volcano (Gulf of Cadiz). Geochim. Cosmochim. Acta 75, 1124–1144 (2011).
17. Palomino, D. et al. Multidisciplinary study of mud volcanoes and diapirs and their relationship to seepages and bottom currents
in the Gulf of Cádiz continental slope (northeastern sector). Mar. Geol. 378, 196–212 (2016).
18. Mazzini, A. & Etiope, G. Mud volcanism: An updated review. Earth-Science Rev. 168, 81–112 (2017).
19. Hung, C. W. et al. Benthic fluxes of dissolved organic carbon from gas hydrate sediments in the northern South China Sea. Sci.
Rep. 6, 1–8 (2016).
Scientific Reports | (2021) 11:3200 | https://doi.org/10.1038/s41598-021-82632-3 10
Vol:.(1234567890)www.nature.com/scientificreports/
20. Retelletti Brogi, S. et al. Exploring sediment porewater dissolved organic matter (DOM) in a mud volcano: Clues of a thermogenic
DOM source from fluorescence spectroscopy. Mar. Chem. 211, 15–24 (2019).
21. Maldonado, A., Somoza, L. & Pallarés, L. The Betic orogen and the Iberian-African boundary in the Gulf of Cadiz: Geological
evolution (central North Atlantic). Mar. Geol. 155, 9–43 (1999).
22. Mazurenko, L. L., Soloviev, V. A., Belenkaya, I., Ivanov, M. K. & Pinheiro, L. M. Mud volcano gas hydrates in the Gulf of Cadiz.
Terra Nov. 14, 321–329 (2002).
23. Pinheiro, L. M. et al. Mud volcanism in the Gulf of Cadiz: Results from the TTR-10 cruise. Mar. Geol. 195, 131–151 (2003).
24. Rueda, J. L. et al. New records of recently described chemosymbiotic bivalves for mud volcanoes within the European waters (Gulf
of Cádiz). Mediterr. Mar. Sci. 13, 262–267 (2012).
25. Sánchez-Guillamón, O. Deep submarine volcanoes in two geodynamic settings (Canary Basin and Gulf of Cádiz): Morphology
and shallow structure. (2019).
26. Murphy, K. R., Stedmon, C. A., Wenig, P. & Bro, R. OpenFluor- An online spectral library of auto-fluorescence by organic com-
pounds in the environment. Anal. Methods 6, 658–661 (2014).
27. Amaral, V., Romera-Castillo, C. & Forja, J. Dissolved organic matter in the Gulf of Cádiz: Distribution and drivers of chromophoric
and fluorescent properties. Front. Mar. Sci. 7, 1–15 (2020).
28. Lorenzo-Seva, U. & ten Berge, J. M. F. Tucker’s congruence coefficient as a meaningful index of factor similarity. Methodology 2,
57–64 (2006).
29. Coble, P. Characterization of marine and terrestrial DOM in seawater using excitation-emission matrix spectroscopy. Mar. Chem.
51, 325–346 (1996).
30. Luek, J. L., Thompson, K. E., Larsen, R. K., Heyes, A. & Gonsior, M. Sulfate reduction in sediments produces high levels of chromo-
phoric dissolved organic matter. Sci. Rep. 7, 1–8 (2017).
31. Sierra, A. et al. Methane dynamics in the coastal—Continental shelf transition zone of the Gulf of Cadiz. Estuar. Coast. Shelf Sci.
236, 106653 (2020).
32. Díaz del Río, V. et al. Volcanes de Fango del Golfo de Cádiz. 132 (2014).
33. Sommer, S. et al. Seabed methane emissions and the habitat of frenulate tubeworms on the Captain Arutyunov mud volcano (Gulf
of Cadiz). Mar. Ecol. Prog. Ser. 382, 69–86 (2009).
34. Malcolm, S. J., Battersby, N. S., Stanley, S. O. & Brown, C. M. Organic degradation, sulphate reduction and ammonia production
in the sediments of Loch Eil, Scotland. Estuar. Coast. Shelf Sci. 23, 689–704 (1986).
35. Burdige, D. J., Kline, S. W. & Chen, W. Fluorescent dissolved organic matter in marine sediment pore waters. Mar. Chem. 89,
289–311 (2004).
36. Chen, M. et al. Production of fluorescent dissolved organic matter in Arctic Ocean sediments. Sci. Rep. 6, 1–10 (2016).
37. Chen, M., Kim, J. H., Choi, J., Lee, Y. K. & Hur, J. Biological early diagenesis and insolation-paced paleoproductivity signified in
deep core sediment organic matter. Sci. Rep. 7, 1–11 (2017).
38. Rueda, J. L. et al. From chemosynthesis-based communities to cold-water corals: Vulnerable deep-sea habitats of the Gulf of Cádiz.
Mar. Biodivers. 46, 473–482 (2016).
39. Valentine, D. L. et al. Biogeochemical investigations of marine methane seeps, Hydrate Ridge, Oregon. J. Geophys. Res. Biogeosci.
110, G02005 (2005).
40. Huguet, A. et al. Properties of fluorescent dissolved organic matter in the Gironde Estuary. Org. Geochem. 40, 706–719 (2009).
41. Liu, Z. & Lee, C. The role of organic matter in the sorption capacity of marine sediments. Mar. Chem. 105, 240–257 (2007).
42. Murphy, K. R. et al. Photochemistry illuminates ubiquitous organic matter fluorescence spectra. Environ. Sci. Technol. 52, 11243–
11250 (2018).
43. Ferretto, N. et al. Identification and quantification of known polycyclic aromatic hydrocarbons and pesticides in complex mixtures
using fluorescence excitation-emission matrices and parallel factor analysis. Chemosphere 107, 344–353 (2014).
44. Mayer, L. M., Schick, L. L. & Loder, T. C. Dissolved protein fluorescence in two maine estuaries. Mar. Chem. 64, 171–179 (1999).
45. Sharma, P. et al. Green manure as part of organic management cycle: Effects on changes in organic matter characteristics across
the soil profile. Geoderma 305, 197–207 (2017).
46. Burdige, D. J., Berelson, W. M., Coale, K. H., McManus, J. & Johnson, K. S. Fluxes of dissolved organic carbon from California
continental margin sediments. Geochim. Cosmochim. Acta 63, 1507–1515 (1999).
47. Somoza, L. et al. Seabed morphology and hydrocarbon seepage in the Gulf of Cádiz mud volcano area: Acoustic imagery, multibeam
and ultra-high resolution seismic data. Mar. Geol. 195, 153–176 (2003).
48. Kenyon, N. H. et al. Multidisciplinary Study of geological processes on the North East Atlantic and Western Mediterranean Margins.
Intergov. Oceanogr. Comm. Tech. Ser. UNESCO 56, 136 (2000).
49. Nayar, S. & Chou, L. M. Relative efficiencies of different filters in retaining phytoplankton for pigment and productivity studies.
Estuar. Coast. Shelf Sci. 58, 241–248 (2003).
50. Akkanen, J., Lyytikäinen, M., Tuikka, A. & Kukkonen, J. V. K. Dissolved organic matter in pore water of freshwater sediments:
Effects of separation procedure on quantity, quality and functionality. Chemosphere 60, 1608–1615 (2005).
51. Chen, M., Lee, J. H. & Hur, J. Effects of sampling methods on the quantity and quality of dissolved organic matter in sediment
pore waters as revealed by absorption and fluorescence spectroscopy. Environ. Sci. Pollut. Res. 22, 14841–14851 (2015).
52. Blough, N. V. & Del Vecchio, R. Chromophoric DOM in the coastal environment. Biogeochem. Mar. Dissolved Org. Matter https
://doi.org/10.1016/b978-012323841-2/50012-9 (2002).
53. Helms, J. R. et al. Absorption spectral slopes and slope ratios as indicators of molecular weight, source, and photobleaching of
chromophoric dissolved organic matter. Limnol. Oceanogr. 53, 955–969 (2008).
54. Murphy, K. R., Stedmon, C. A., Graeber, D. & Bro, R. Fluorescence spectroscopy and multi-way techniques PARAFAC. Anal.
Methods 5, 6557–6566 (2013).
55. Komada, T. et al. Dissolved organic carbon dynamics in anaerobic sediments of the Santa Monica Basin. Geochim. Cosmochim.
Acta 110, 253–273 (2013).
56. Boudreau, B. P. Diagenetic models and their implementation – Modelling transport and reactions in aquatic sediments. (Springer,
1997).
57. R Core Team. R: A language and environment for statistical computing. R Foundation for Statistical Computing, Vienna, Austria.
https://www.R-project.org/. (2020).
58. Hulth, S., Tengberg, A., Landen, A. & Hall, P. O. J. Mineraliztion and burial of organic carbon in sediments of the southern Weddell
Sea (Antarctica). Deep Sea Res. I 44, 955–981 (1997).
59. Otto, S. & Balzer, W. Release of dissolved organic carbon (DOC) from sediments of the N.W. European Continental Margin (Goban
Spur) and its significance for benthic carbon cycling. Prog. Oceano. 42, 127–144 (1998).
60. Alperin, M. J. et al. Benthic fluxes and porewater concentration profiles of dissolved organic carbon in sediments from the North
Carolina continental slope. Geochim. Cosmochim. Acta 63, 427–448 (1999).
61. Lhajnar, N., Rixen, T., Gaye-Haake, B., Schafer, P. & Ittekkot, V. Dissolved organic carbon (DOC) fluxes of deep-sea sediments
from the Arabian Sea and NE Atlantic. Deep-Sea Res. II 52, 1947–1964 (2005).
Scientific Reports | (2021) 11:3200 | https://doi.org/10.1038/s41598-021-82632-3 11
Vol.:(0123456789)www.nature.com/scientificreports/
Acknowledgements
This work was funded by the Spanish CICYT (Spanish Program for Science Technology) under the contract
CTM2014-59244- C3-1-R and RTI2018-100865-B-C21. VA was financed by the National Research and Inno-
vation Agency of Uruguay (ANII) with a Ph.D. fellowship (POS_EXT_2015_1_122780). CR-C was funded by
a Postdoctoral Fellowship from the Spanish “Ministerio de Economía y Competitividad, Juan de la Cierva-
Incorporación”. The authors would like to thanks the crews of the R/V’s Angeles Alvariño and Ramón Margalef
for their assistance during fieldwork. Teodora Ortega and Dolores Jiménez-López for their assistance in field
sampling and processing. We acknowledge the help of Jose Sanabria with Fig. 1. Gastón Pereyra performed the
final language revision.
Author contributions
All authors designed research and reviewed the final version of the manuscript. JF and VA measured and pro-
cessed the data. VA analyzed the data and wrote the draft of the manuscript with the help and inputs of CR-C
and JF.
Competing interests
The authors declare no competing interests.
Additional information
Supplementary Information The online version contains supplementary material available at https://doi.
org/10.1038/s41598-021-82632-3.
Correspondence and requests for materials should be addressed to V.A.
Reprints and permissions information is available at www.nature.com/reprints.
Publisher’s note Springer Nature remains neutral with regard to jurisdictional claims in published maps and
institutional affiliations.
Open Access This article is licensed under a Creative Commons Attribution 4.0 International
License, which permits use, sharing, adaptation, distribution and reproduction in any medium or
format, as long as you give appropriate credit to the original author(s) and the source, provide a link to the
Creative Commons licence, and indicate if changes were made. The images or other third party material in this
article are included in the article’s Creative Commons licence, unless indicated otherwise in a credit line to the
material. If material is not included in the article’s Creative Commons licence and your intended use is not
permitted by statutory regulation or exceeds the permitted use, you will need to obtain permission directly from
the copyright holder. To view a copy of this licence, visit http://creativecommons.org/licenses/by/4.0/.
© The Author(s) 2021
Scientific Reports | (2021) 11:3200 | https://doi.org/10.1038/s41598-021-82632-3 12
Vol:.(1234567890)You can also read