MPN Drop Agar Method for Determination of Heterotrophic Microorganisms in Soil and Water Samples Using Tissue Plate as a Carrier - MDPI
←
→
Page content transcription
If your browser does not render page correctly, please read the page content below
sustainability

Brief Report
MPN Drop Agar Method for Determination
of Heterotrophic Microorganisms in Soil and Water
Samples Using Tissue Plate as a Carrier
Jana Chumchalová *            and Martin Kubal
 Department of Environmental Chemistry, University of Chemical Technology in Prague,
 Faculty of Environmental Technology, Technická 5, 166 28 Prague 6, Czech Republic; Martin.Kubal@vscht.cz
 * Correspondence: Jana.Chumchalova@vscht.cz; Tel.: +4202-2244-4362

 Received: 29 July 2020; Accepted: 5 October 2020; Published: 7 October 2020

 Abstract: The most probable number (MPN) method is a culture-based method commonly used in the
 field of environmental microbiology to examine microbial populations in liquid substrates. The MPN
 tests require a wide range of special laboratory equipment, a lot of laboratory space, and skilled staff,
 which together limit their applicability. This paper presents a modified MPN method, which reduces
 the experimental requirements by applying tissue plate as a carrier. The modified MPN method
 introduces a fast-filled tissue plate with 5 × 5 squares as agar carrier, instead of the commonly used set
 of glass tubes. Further, self-refilling automatic syringe Socorex® was implemented to apply samples to
 the plate. The response of the modified MPN method was tested on eight selected bacterial strains as
 well as on soil and water samples. Simultaneously, all the strains and samples were tested by standard
 spread plate method. High linear correlation between the two methods was found, which makes a
 new modified MPN method a useful alternative within the field of environmental microbiology.

 Keywords: culture-based methods; soil; tissue plate; water

1. Introduction
     Microbial characteristics are generally considered complex indicators of soil and water health
because of clear relationships between microbiome, soil/water characteristics, plant quality, and
environment sustainability [1]. A thorough understanding and the effective measurability of microbial
characteristics such as biomass, activity, communication, and diversity are significant to support the
beneficial effects of microorganisms to plants, animals, and humans, and to prevent their adverse
effects on society. Soil and water microorganisms play a key role in the decomposition of organic
matter residue, determining the release of mineral nutrients and nutrient cycling [2]. Moreover,
microorganisms contribute to the transformation and degradation of waste materials and synthetic
organic compounds. They also influence the physical properties of soil. Therefore, microorganisms
may function as an excellent indicator of change in soil health, thereby providing an early sign of
soil quality improvement or an early warning of soil degradation [3,4]. Most of the research effort
applied now in the field of environmental microbiology is directed at culture-independent principles,
such as molecular methods, dehydrogenase activity, and respiration activity [5]. However, these
culture-independent techniques often do not allow detailed investigations that are possible with
cultures. Without successful cultivation, it is difficult to detect and identify novel organisms, obtain
phenotypic and functional information, and determine the functions of unknown genes [6].
     Thus, the culture-based methods remain fundamental tools in environmental microbiology and
help us to understand the microbial world and its contribution to sustainable practices in soil and
water management.

Sustainability 2020, 12, 8252; doi:10.3390/su12198252                      www.mdpi.com/journal/sustainability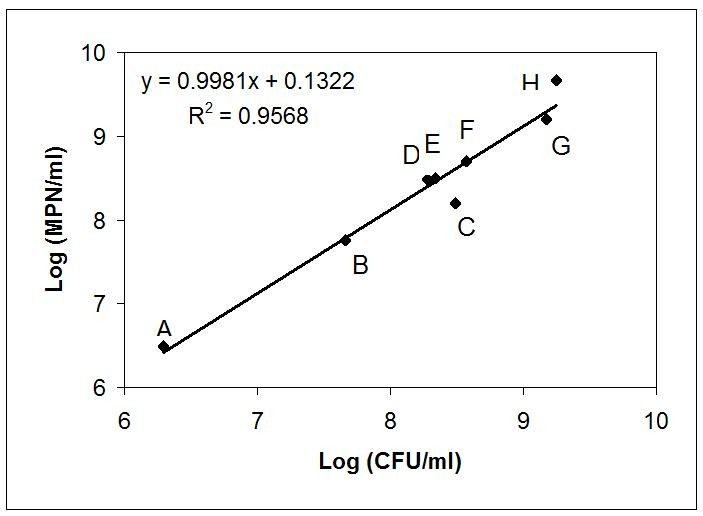
Sustainability 2020, 12, 8252                                                                         2 of 8

      Environmental samples generally contain an enormous number of microbial cells. This is especially
true for soils with a typical range of 107 –1012 cells per one gram of soil dry matter. Even if less than 1%
of the microorganisms observed under the microscope may typically be cultivated [7], and irrespective
of rapid development of molecular or genetic examination techniques, the culture-based methods
remain a fundamental tool in environmental microbiology. Cultivability is a particularly important
parameter when exploring contaminated matrices and preparing bioremediation systems.
      Traditional culture-based methods include the pour plate method, spread plate method, and most
probable number (MPN) method. All of these methods are widely applied and supported by a broad
spectrum of guidelines. Still, the technical aspects exist, in which the culture-based methods may
be improved.
      When spread plate method is used with more than 10 s application of hand spreader, lower counts
of gram-negative bacteria are mostly determined, which is related to mechanical forces sufficient to
damage the cells [8]. Another limitation is a loss of viable bacteria as a result of bacteria adhesion to
the spreader (irrespective of glass or plastic). The amount of bacteria adhered to the spreader varied
according to volume of liquid being spread and the size of the spreader [9]. The spreader adhesion of
bacterial cells also varied according to the organism species [10]. It was estimated that the loss would
be approximately 10% [9].
      Pour plate method may not be suitable to cultivate microorganisms, which are sensitive to the
high temperatures at which mixing of sample and medium is typically carried out.
      The MPN method is generally a means to estimate microbial population sizes in liquid substrate [11].
It relies on the detection of specific qualitative attributes of the microorganism of interest (bubbles,
color, precipitates). Population estimates are derived from the pattern of attribute occurrence across
a serial dilution from MPN tables. This method does not rely upon the population size within any
single dilution or aliquot, but rather on the pattern of positive and negative test results following
inoculation of a suitable test medium. It is considered suitable to estimate microbial population sizes
when quantitative assessment of individual cells is not possible [12]. The MPN method is particularly
useful when an estimate of numbers present in very low concentrations is required and the large
volume of samples to be examined makes the plate count impracticable [13].
      The most common form of the MPN method utilizes a system of multiple tubes containing
the liquid medium. However, an alternative MPN method was developed that used an agar plate
inoculated with drops, and the presence or absence of growth was recorded here [11].
      Obviously, the MPN method is well suited for monitoring activities that produce a high number of
samples, where a broad range of population sizes is expected and a cultivation examination strategy is
preferred over molecular techniques. Processing a large number of samples with a broad concentration
range automatically increased requirements on laboratory space, equipment, time, and staff experience.
      Thus, the aim of this study was to develop a simplified modification of the MPN method for
enumeration of indigenous microorganisms in environmental samples, represented here by the samples
of soil and water. The modified MPN method was, in particular, intended for routine analysis of a
heterotrophic population in environmental samples, and the connection of the MPN principle with the
agar medium was identified as a promising strategy. The microbial recovery of the modified MPN
method developed was compared with a spread plate method.

2. Materials and Methods
      The following bacterial strains were used for testing: Gordonia terrae CCM 2633 (A), Enterococcus
faecalis CCM 4224 (B), Pseudomonas fluorescens CCM 4796 (C), Escherichia coli CCM 3954 (D), Pseudomonas
aeruginosa CCM 3963 (E), Pseudomonas aeruginosa CCM 1961 (F), Pseudomonas aeruginosa CCM 7930 (G),
and Pseudomonas fluorescens CCM 2115 (H). Capital letters in parentheses indicate the particular points
presented in Figure 1. All the strains originated from Czech Collection of Microorganisms, Brno. The
received strains were subcultured at least three times in nutrient broth (Oxoid, Basingstoke, UK) to
gain fresh culture before the target cultivation experiments.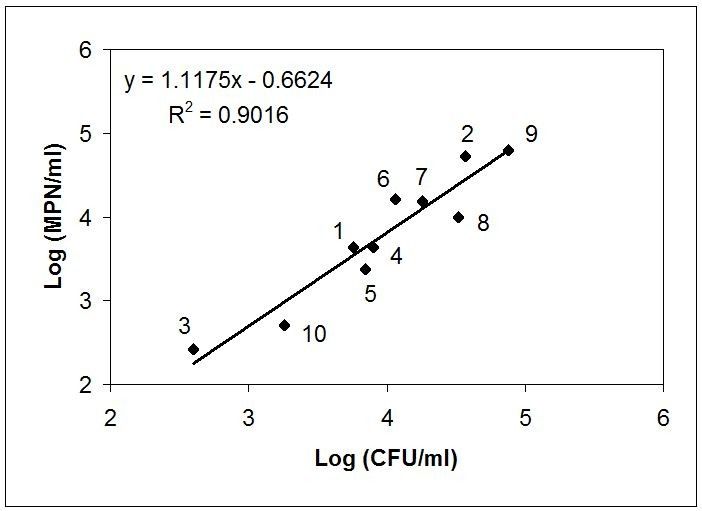
Sustainability 2020, 12, x FOR PEER REVIEW 3 of 8
particular points presented in Figure 1. All the strains originated from Czech Collection of
Microorganisms,
Sustainability 2020, 12, Brno.
8252 The received strains were subcultured at least three times in nutrient broth
3 of 8
(Oxoid, Basingstoke, UK) to gain fresh culture before the target cultivation experiments.
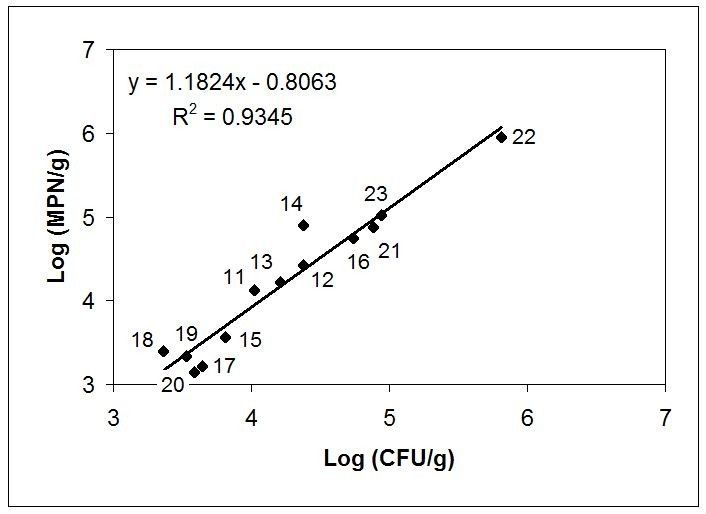
Figure 1. Regression line of most probable number (MPN) drop agar method counts vs. spread plate
method counts for eight selected strains.
Strains were cultivated at 22 ◦°C C for 2–3 days in nutrient broth before use. All strains were stored
◦C ◦
−20 °CCinin 30% v/v of
30% v/v of glycerol.
glycerol.
at 4 °C and maintained at −20
A total of 10 aqueous
aqueous and
and 13
13 soil
soil samples
samples were
were collected
collected (Table
(Table 1). The
The first
first group
group included
included water
from public swimming pool, samples from drinking water water wells
wells and
and polluted
polluted pump-and-treat
pump-and-treat wells,
wells,
household wastewater,
wastewater, andand
minemine
water. water.
The second
The group
second included
groupsoilincluded
samples fromsoil uncontaminated
samples from
places (Prague city area), samples from contaminated site with chemical industry
uncontaminated places (Prague city area), samples from contaminated site with chemical industry (Neratovice, Czech
Republic), andCzech
(Neratovice, sediment samples.and
Republic), Sampling
sedimentprocedures
samples. followed
Samplingthe ISO 19458:2006
procedures standardthe
followed forISO
the
aqueous samples
19458:2006 and for
standard ISOthe18400-102:2017,
aqueous samples together with
and ISOISO 18400-206:2018together
18400-102:2017, standards for the
with ISOsoil and
18400-
sedimentstandards
206:2018 samples. for the soil and sediment samples.
Table 1.
Table The list
1. The list of
of analyzed
analyzed samples.
samples.
Sample
Sample Matrix *
Matrix Description;
Description; GPSGPS Position
Position (CzechRepublic
(Czech RepublicTerritory)
Territory)
1 1 Surface water
Surface water Public
Publicswimming
swimming pool;
pool; NN49 ◦ 56.386700 , E 14
49°56.38670′, ◦ 44.052400
E 14°44.05240′
2 Surface water Creekbellow
Creek bellow output
output ofofbiological
biological wastewater
wastewater treatment 50◦ 12.96942
unit; Nunit;
treatment
0 , E 14◦ 8.432330
N 50°12.96942′, E
3 2 Surface water
Groundwater Drinking water well; N 49◦ 56.282450 , E 14◦ 41.845920
14°8.43233′
4 Groundwater Drinking water well; N 49◦ 28.756000 , E 15◦ 44.223970
5 3 Groundwater
Mine water Drinking water
Kutná Hora; well;
N 49 N 49°56.28245′,
◦ 58.46962 E 14°41.84592′
0 , E 15◦ 16.96935 0
6 4 Groundwater
Groundwater (contaminated) Drinking water well;
Pump-and-Treat system,N 49°28.75600′,
Crystal Bohemia E factory,
15°44.22397′
Poděbrady; N 50◦ 8.713150 , E 15◦ 7.656250
7 5 Mine(contaminated)
Groundwater water Kutná Hora; N 49°58.46962′,
Pump-and-Treat system, Crystal Bohemia factory, Poděbrady; N 50◦ 8.715420 , E 15◦ 7.628570
E 15°16.96935′
8 Groundwater (contaminated)
Groundwater Pump-and-Treat system,
Pump-and-Treat system,Crystal
Crystal Bohemia
Bohemia factory, Poděbrady;
factory, N 50◦ 8.72520
Poděbrady;
0 , E 15◦ 7.616720
N 50°8.71315′, E
9 6 Groundwater (contaminated) Pump-and-Treat system, Spolana, Neratovice; N 50◦ 16.232630 , E 14◦ 30.935050
(contaminated) 15°7.65625′ ◦ 0 ◦ 0
10 Groundwater (contaminated) Pump-and-Treat system, Karlovy Vary; N 50 13.73613 , E 12 50.73683
11 7 Groundwater
Soil (2 m depth) Pump-and-Treat
Sampling borehole,system,
Praha;Crystal Bohemia
N 50◦ 2.92988 0 , E 14 factory,
◦ 19.43730Poděbrady;
0 N 50°8.71542′, E
12 (contaminated)
Soil (4 m depth) 15°7.62857′
Sampling borehole, Praha; N 50◦ 2.929880 , E 14◦ 19.437300
13 Groundwater
Soil (6 m depth) Pump-and-Treat system,
Sampling borehole, N 50◦ 2.92988
Praha;Crystal Bohemia0 , E 14◦ 19.437300
factory, Poděbrady; N 50°8.72520′, E
14 8 Soil (2 m depth)
(contaminated) Sampling borehole, Praha; N 50◦ 2.919130 , E 14◦ 19.348150
15°7.61672′
15 Soil (4 m depth) Sampling borehole, Praha; N 50◦ 2.919130 , E 14◦ 19.348150
Groundwater ◦ 16.232630 , E 14◦ 30.935050
16 9 Soil (2 m depth) Pump-and-Treat system,
Sampling borehole, Spolana,
Neratovice; N 50Neratovice; N 50°16.23263′, E 14°30.93505′
17 (contaminated)
Soil (6 m depth) Sampling borehole, Neratovice; N 50◦ 16.232630 , E 14◦ 30.935050
18 Groundwater
Soil (4 m depth) Sampling borehole, Neratovice; N 50◦ 16.239630 , E 14◦ 30.933770
10 Pump-and-Treat system, Karlovy Vary; N 50°13.73613′, E 12°50.73683′
19 (contaminated)
Soil (3 m depth) Sampling borehole, Neratovice; N 50◦ 16.239630 , E 14◦ 30.933770
20 11 Soil (2 m depth) Sampling borehole, Neratovice; N 50 ◦ 16.239630 , E 14◦ 30.933770
Soil (2 m depth) Sampling borehole, Praha; N 50°2.92988′, E 14°19.43730′
21 Sediment (0.15 m depth) Lagoon Dobroutov; N 49◦ 28.434000 , E 15◦ 45.159580
12 Soil (4 m depth) Sampling borehole, Praha; N 50°2.92988′, E 14°19.43730′
22 Sediment (surface) Lagoon Dobroutov; N 49◦ 28.434000 , E 15◦ 45.159580
23 13 Soil
Soil (6 m depth)
(5 m depth) Sampling
Samplingborehole, Praha; N 50°2.92988′,
borehole, Neratovice; N 50◦ 16.23963E 014°19.43730′
, E 14◦ 30.933770
14 Soil (2 m depth) Sampling borehole, Praha; N 50°2.91913′, E 14°19.34815′
15 Soil (4 m depth) Sampling borehole, Praha; N 50°2.91913′, E 14°19.34815′
All
16 serial dilutions were performed
Soil (2 m depth) Samplingusing sterile
borehole, saline (0.85%
Neratovice; NaCl, EISO
N 50°16.23263′, 8199:2007). The samples
14°30.93505′
17 Soil (6 m depth) Sampling borehole, Neratovice; N 50°16.23263′, E 14°30.93505′
of bacterial strains in nutrient broth and the collected aqueous samples were vortexed for 10 s. Soil
18 Soil (4 m depth) Sampling borehole, Neratovice; N 50°16.23963′, E 14°30.93377′
and sediment
19
samples were processed
Soil (3 m depth)
as follows: 1 g of sample was introduced into glass reagent
Sampling borehole, Neratovice; N 50°16.23963′, E 14°30.93377′
bottle20
with glassSoil
stopper containing
(2 m depth) Samplingof
9 mL sterile Neratovice;
borehole, saline with N 15 glass balls
50°16.23963′, of diameter 5 mm. Sample
E 14°30.93377′
was homogenized
21 Sedimentby shaking
(0.15 m depth)onLagoon
a shaker for 30 Nmin
Dobroutov; at 100 rpm
49°28.43400′, at laboratory temperature. After
E 15°45.15958′
homogenization of samples, the serials of decimal dilutions were prepared.Sustainability 2020, 12, 8252 4 of 8
Microbial counts were determined by cultivation on nutrient agar (Oxoid, Basingstoke, UK) using
two methods: (1) spread plate method and (2) MPN drop agar method. Appropriate dilutions were
regularly spread on pre-dried nutrient agar surface of a 9 cm plate by hand plating with a sterile
bent glass rod until dry. Each dilution was plated in duplicate. The inverted plates were cultured
at 22 ◦ C. Time of incubation varied with the organism and type of sample tested. At the end of the
incubation period, the grown colonies were enumerated and total count was calculated according to
ISO 7218:2007.
Instead of classic tubes with liquid medium [13], a modified MPN method was applied with 5 × 5
polystyrene tissue plate as a carrier of media. Melted nutrient agar was poured in every square section
of 5 × 5 polystyrene tissue plates using sterile self-refilling automatic syringe Socorex® . The volume of
1.5 mL was loaded in every square section (1.8 cm2 ). Pre-dried and pre-warmed nutrient agar was
inoculated with 30 µL drops in the manner that five squares in line were used for each dilution level.
The plate was tilted at an angle of about 30◦ to regularly distribute the poured dilution over the whole
surface agar in the squares. The plates were inverted after sample drops had been absorbed into the
agar and then incubated at 22 ◦ C. Time of incubation varied with the bacterial strain and type of sample
tested. The number of positive squares sections (where colony growth was observed) was recorded
after incubation, and MPN index was calculated according to ISO 7218:2007.
Colony counts for both MPN drop agar method and spread method were transformed into Log10
values and interpreted, for each type of experiment, through linear regression model. The agreement
between the experimental data provided by the two methods was verified here using the Student t test
for paired samples at the 5% level of significance.
3. Results and Discussion
The first part of the results measured in this work is presented in Figure 1, where correlation
between the counts of microbial strains obtained by MPN drop agar method and spread plate method
for eight selected strains is shown. The results presented here cover a relatively broad range of
concentrations of CFU, as evidenced by more than three orders of magnitude through which the
experimental data were distributed. All the strains presented in Figure 1 are the typical subsurface or
water inhabitants with high importance to the field of environmental science and technology [14].
Genus Pseudomonas was selected because it is known for swarming growth, especially at
Pseudomonas aeruginosa [15]. This genus belongs to the group of soil generalists, and it is found,
often in high numbers, in virtually every soil on the planet [16]. Pseudomonas is among the dominant
culturable bacteria in soil [17].
Gordonia strain was included because it belongs to Actinomycetes. Actinomycetes is a nontaxonomic
term for a group of the Gram-positive bacteria that exhibit filamentous growth and spore formation.
Gordonia has been isolated not only from soil [17,18], where it is very common, but also from water.
They have also been isolated from wastewater treatment bioreactors or biofilters. Gordonia degrade
natural organic compounds that are not readily biodegradable, and are candidates for bioremediation
processes (hydrocarbon degradation). Several species of Gordonia are known to cause infections,
especially in humans [18]. Gordonia and Pseudomonas are known as biosurfactant producers, which is
very important if hydrophobic organic pollutants are present.
Finally, Enterococcus and Escherichia strains are indicators for feces derived from human and
animals and Enterococcus is an indicator for a “not so fresh” or recent contamination. Escherichia coli
can also exhibit swarming growth [19].
Selection of the bacterial strains presented in Figure 1 followed, however, not only from their
environmental importance but also from good cultivability and identifiability.
The value of correlation coefficient calculated for Figure 1 clearly indicates strong linear relationship
between the two detection methods. Thus, for the eight bacterial strains, the results provided by
modified MPN method were interchangeable for the results of a comparative spread plate method.can
can also
also exhibit
exhibit swarming
swarming growth
growth [19].
[19].
Selection
Selection of of the
the bacterial
bacterial strains
strains presented
presented in in Figure
Figure 11 followed,
followed, however,
however, notnot only
only from
from their
their
environmental importance but also from good cultivability and
environmental importance but also from good cultivability and identifiability. identifiability.
The
The value
value of of correlation
correlation coefficient
coefficient calculated
calculated for
for Figure
Figure 11 clearly
clearly indicates
indicates strong
strong linear
linear
relationship
relationship between
between the
the two
two detection
detection methods.
methods. Thus,
Thus, for
for the
the eight
eight bacterial
bacterial strains,
strains, the
the results
results
Sustainability 2020, 12, 8252 5 of 8
provided
provided by by modified
modified MPN MPN method
method were
were interchangeable
interchangeable forfor the
the results
results of
of aa comparative
comparative spread
spread
plate
plate method.
method.
Figures
Figures 22 and and 33 show
show correlations between the
correlations between the counts
counts from environmental samples
from environmental samples (listed
(listed inin
Table 1) obtained by a new MPN drop agar method and spread plate method.
Table 1) obtained by a new MPN drop agar method and spread plate method. For all samples, there For all samples, there
were
were nono significant
nosignificant differences
significantdifferences
differences between
between
between these
these twotwo
these methods.
methods.
two The The
methods. correlation
correlation
The coefficients
coefficients
correlation evidence
evidence
coefficients again
evidence
again
very very
high high
linear linear relationship
relationship between between
the two the two methods.
methods.
again very high linear relationship between the two methods.
Figure 2.
2. Regression
Figure 2.
Figure Regression line
Regression line of
line of MPN
of MPN drop
MPN drop agar
drop method
agar method
agar counts
method counts vs.
vs. spread
counts vs. spread plate
spread plate method
plate method counts
method counts for
counts for 10
for 10
10
water samples.
water samples.
Figure
Figure 3.
3. Regression
Regressionline
Regression lineof
line ofofMPN
MPNdrop
MPN drop
drop agar
agar method
agar counts
method
method vs.
counts
counts spread
vs.vs. plate
spread
spread method
plate
plate counts
method
method for
for 13
counts
counts forsoil
13 13
soil
samples.
soil samples.
samples.
For all
For all three
three types
types of
of experiments
experiments shown
shown in in Figures
Figures 1–3,
1–3, the Student t-test
the Student t-test for
for paired
paired samples
samples
showed
showed no significant difference
no significant difference between
between the
between the colony
the colony counts
colony counts at
counts at the
at the 5%
the 5% level
5% level of
level ofsignificance.
of significance.
significance.
The applicability of
The applicability
applicability of the
of modified MPN
the modified
modified MPN drop
MPN agar method,
drop agar
agar method, as
method, as presented
as presented in
presented in this
in this paper,
this paper, might
paper, might be
be
limited if longer cultivation time is required, for example, in order of weeks. In such
limited if longer cultivation time is required, for example, in order of weeks. In such a case, wea case, we must
must
often
often face
face aa medium dehydration similar
medium dehydration similar to
to traditional
traditional spread
spread plate
plate method.
method.
The modified MPN drop agar method developed is fast to perform because of easy filling of
squares with the autoclavable Socorex® self-refilling syringe with spring-loaded plunger and three-way
valve system designed for serial precision injections. Melted agar can be poured into one plate divided
into 25 square sections within 50 s. Moreover, the MPN drop agar method estimates results fast because
only square sections giving visible growth are noted, rather than colony counting. However, the most
important benefits are obtained in time required for sample handling, cost of material, and occupation
of space in laboratory. This method is applicable for organisms with a swarming growth and a mycelialSustainability 2020, 12, 8252 6 of 8
growth. The swarming growth was reported in some rhizobial strains [20], or in some strains with
biosurfactant production used in bioremediation [21].
In this way, the modified MPN drop agar method provides significant benefit compared to
current state of art [11,22–25], compared especially with drop agar methods cited in the literature.
There, 96-well tissue plate was obviously used for dilution preparation and drops with dilutions were
inoculated to one plate [26–28].
Material and cost assessments of both the modified MPN drop agar method and comparative
spread plate method are shown in Tables 2 and 3. Table 2 summarizes consumable material required to
examine one sample, where the MPN method is carried out in one tissue plate (5 × 5), while ten Petri
dishes are considered for the comparative spread plate method. Table 2 further shows space and time
requirements but does not include stable laboratory instrumentation (such as incubator, autoclave, and
Vortex mixer) whose utilization is the same for the both techniques (the only difference being space
volume occupied). The actual costs for consumable material collected for one Czech and one global
supplier are summarized in Table 3.
Table 2. Calculation of material and labor requirements for the determination of heterotrophic
microorganisms used for one sample by both methods.
Method MPN Drop Agar Method Spread Plate Method
a
Nutrient agar (mL) 37.5 150 b
Quantity of carriers 1 tissue plate (5 × 5) 10 Petri dishes
Additional material 1 tip for pouring medium 5 spreaders
Dimensions of the plate with lid (mm) 20 × 101 × 101 height × width × depth 90 × 160 diameter × height (10 plates)
Space occupied (cm3 ) 202 1017
Weight of plates (g) 46.6 126.8
Mean weight of additional material (g) 5 9
Mean handling time c (min) 5 20
a for a set of 5 replicates 5 dilutions, 1.5 mL per square. b for a set of 2 replicates 5 dilutions, 15 mL per plate. c
labeling of plates, absorption of water of the inoculum or spreading, and counting of plates.
Table 3. The actual costs for consumable material obtained from Thermo Fisher Scientific Inc. company
and P-LAB company.
Cost (EUR)
Method Carrier Medium/per Sample/Unit Aditional Material Sum
Thermo Fisher Scientific Inc. company (https://www.thermofisher.com/cz/en/home.html, 7 September 2020)
MPN drop agar method 2.3 EUR/1 tissue plate 0.2 EUR/37.5 mL a 0.3 EUR/1 tip 2.8 EUR
Spread plate method 2.1 EUR/10 Petri plates 0.8 EUR/150 mL b 1 EUR/5 spreaders 3.9 EUR
P-LAB a.s. company (https://www.p-lab.cz/, 7 September 2020)
MPN drop agar method 1.5 EUR/1 tissue plate 0.2 EUR/37.5 mL a 0.4 EUR/1 tip 2.1 EUR
Spread plate method 1.0 EUR/10 Petri plates 0.8 EUR/150 mL b 1 EUR/5 spreaders 2.8 EUR
a for a set of 5 replicates 5 dilutions, 1.5 mL per square. b for a set of 2 replicates 5 dilutions, 15 mL per plate.
Comparison of the costs showed in Table 3 clearly evidenced direct economic benefit related
to the modified MPN method, irrespective of national or global supplier of laboratory consumables.
Significant time saving is another important advantage of the modified MPN method. Reduction in
time demand is in particular connected with labeling of plates, absorption of water of the inoculum or
spreading, and the counting of plates.
The economy of microbiological examination is also greatly influenced by indirect costs, which
include the waste disposal expenses. All the waste materials from microbiological examination are,
according to the international standards (ISO 7218:2007), autoclaved first, then stored in single-use
plastic containers, and finally directed to waste incinerator. The weight reduction indicated in Table 2
for consumable material in the MPN method is of high logistic, environmental, and economic value.
The outputs presented in this paper contribute to the goals of the sustainable development strategy by:Sustainability 2020, 12, 8252 7 of 8
- Providing a modified method that may be applied to microbiological examination of water and
soil samples in simplified arrangement and at lower cost, thus preventing soil degradation and
encouraging sustainable agricultural development;
- Reducing the amount of single-use plastic consumable material used within a laboratory
microbiological examination;
- Reducing the amount of biohazardous waste, whose handling is typically related to complicated
and expensive disposal procedures.
4. Conclusions
New modification of the MPN method was applied to enumeration of indigenous microorganisms
in soil and water samples. The results measured by modified MPN drop agar method were highly
correlated with the results from common spread plate method, which was used here as a standard
cultivation technique. Besides providing comparable results with a common technique, the modified
MPN drop agar method is advantageous due to lower costs, decreased requirements for laboratory
space and equipment, and less staff time. All these aspects make a modified MPN drop agar method
well-suited for extensive monitoring activities, where high numbers of samples are to be examined
by means of the microorganism cultivation method. In a broader sense, better microbial control and
reduced risks from contaminated soil and water can be reached this way.
Author Contributions: Conceptualization, J.C.; methodology, J.C.; formal analysis, M.K.; investigation, J.C.;
resources, M.K.; data curation, J.C.; writing—original draft preparation, J.C. and M.K. All authors have read and
agreed to the published version of the manuscript.
Funding: This research received no external funding.
Conflicts of Interest: The authors declare no conflict of interest.
References
1. Barberán, A.; Ramirez, K.S.; Leff, J.W.; Bradford, M.A.; Wall, D.H.; Fierer, N. Why are some microbes
more ubiquitous than others? Predicting the habitat breadth of soil bacteria. Ecol. Lett. 2014, 17, 794–802.
[CrossRef] [PubMed]
2. Furtak, K.; Grzadziel,
˛ J.; Gałazka,
˛ A.; Niedźwiecki, J. Analysis of soil properties, bacterial community
composition, and metabolic diversity in fluvisols of a floodplain area. Sustainability 2019, 11, 3929. [CrossRef]
3. Wołejko, E.; Jabłońska-Trypuć, A.; Wydro, U.; Butarewicz, A.; Łozowicka, B. Soil biological activity as an
indicator of soil pollution with pesticides—A review. Appl. Soil Ecol. 2020, 147, 103356. [CrossRef]
4. Griffiths, B.S.; Faber, J.; Bloem, J. Applying soil health indicators to encourage sustainable soil use:
The transition from scientific study to practical application. Sustainability 2018, 10, 3021. [CrossRef]
5. Chumchalová, J.; Kubal, M. Laboratory tests for aerobic bioremediation of the contaminated sites in the
Czech Republic. Plant. Soil Environ. 2020, 66, 191–199. [CrossRef]
6. Nguyen, T.M.; Seo, C.; Ji, M.; Paik, M.-J.; Myung, S.; Kim, J. Effective soil extraction method for cultivating
previously uncultured soil bacteria. Appl. Environ. Microbiol. 2018, 84, e01145-18. [CrossRef] [PubMed]
7. Torsvik, V.; Øvreås, L. Microbial diversity and function in soil: From genes to ecosystems.
Curr. Opin. Microbiol. 2002, 5, 240–245. [CrossRef]
8. Hedderich, R.; Müller, R.; Greulich, Y.; Bannert, N.; Holland, G.; Kaiser, P.; Reissbrodt, R. Mechanical damage
to Gram-negative bacteria by surface plating with the Drigalski-spatula technique. Int. J. Food Microbiol.
2011, 146, 105–107. [CrossRef] [PubMed]
9. Young, M. A modified spread plate technique for the determinations of concentrations of viable heterotrophic
bacteria. In Methodology for Biomass Determinations and Microbial Activities in Sediments; ASTM International:
West Conshohocken, PA, USA, 2009; p. 40.
10. Thomas, P.; Sekhar, A.; Mujawar, M. Nonrecovery of varying proportions of viable bacteria during spread
plating governed by the extent of spreader usage and proposal for an alternate spotting-spreading approach
to maximize the CFU. J. Appl. Microbiol. 2012, 113, 339–350. [CrossRef] [PubMed]Sustainability 2020, 12, 8252 8 of 8
11. Carvalhal, M.; Oliveira, M.; Alterthum, F. An economical and time saving alternative to the
most-probable-number method for the enumeration of microorganisms. J. Microbiol. Methods 1991, 14,
165–170. [CrossRef]
12. Woomer, P.L. Most probable number counts. In Methods of Soil Analysis, Part 2. Microbiological and Biochemical
Properties; Bottomley, P.J., Angle, J.S., Weaver, R.W., Eds.; SSSA Book Series; Soil Science Society of America:
Madison, WI, USA, 1994; pp. 59–79.
13. Harrigan, W.F. Laboratory Methods in Food Microbiology; Academic Press: San Diego, CA, USA, 1998.
14. Mat’átková, O.; Pospíšilová, D.; Michailidu, J.; Jaroš, P.; Masák, J. Effect of subinhibitory concentration of
antibiotics on Rhodococcus erythropolis and Pseudomonas fluorescens biofilm formation. Chem. Pap. 2018, 73,
1113–1119. [CrossRef]
15. Overhage, J.; Bains, M.; Brazas, M.D.; Hancock, R.E. Swarming of Pseudomonas aeruginosa is a complex
adaptation leading to increased production of virulence factors and antibiotic resistance. J. Bacteriol. 2008,
190, 2671–2679. [CrossRef] [PubMed]
16. Van Elsas, J.D.; Hartmann, A.; Schloter, M.; Trevors, J.T.; Jansson, J.K. The bacteria and archaea in soil.
In Modern Soil Microbiology, 2nd ed.; Informa UK Limited: Colchester, UK, 2019; pp. 49–64.
17. Maier, R.M.; Pepper, I.L. Earth Environments. In Environmental Microbiology; Elsevier BV: Amsterdam,
The Netherlands, 2009; pp. 57–82.
18. Arenskötter, M.; Bröker, D.; Steinbüchel, A. Biology of the metabolically diverse genus Gordonia.
Appl. Environ. Microbiol. 2004, 70, 3195–3204. [CrossRef]
19. Darnton, N.C.; Turner, L.; Rojevsky, S.; Berg, H.C. Dynamics of bacterial swarming. Biophys. J. 2010, 98,
2082–2090. [CrossRef] [PubMed]
20. Covelli, J.M.; Althabegoiti, M.J.; López, M.F.; Lodeiro, A.R. Swarming motility in Bradyrhizobium japonicum.
Res. Microbiol. 2013, 164, 136–144. [CrossRef] [PubMed]
21. Drzewiecka, D. Significance and roles of Proteus spp. bacteria in natural environments. Microb. Ecol. 2016,
72, 741–758. [CrossRef] [PubMed]
22. Casas, I.A.; León, N.; Izquierdo, P. Microtiter technique for enumeration of mesophiles, psychrotrophs, and
coliforms in raw and pasteurized milk. J. Food Prot. 1977, 40, 795–797. [CrossRef] [PubMed]
23. Baron, F.; Cochet, M.-F.; Ablain, W.; Grosset, N.; Madec, M.-N.; Gonnet, F.; Jan, S.; Gautier, M. Rapid
and cost-effective method for micro-organism enumeration based on miniaturization of the conventional
plate-counting technique. Le Lait 2006, 86, 251–257. [CrossRef]
24. Kashyap, S. Evaluating most probable number method to count and isolate viable methylotrophs.
Braz. J. Microbiol. 2011, 42, 46–48. [CrossRef]
25. Kurm, V.; Van Der Putten, W.H.; Hol, W.H.G. Cultivation-success of rare soil bacteria is not influenced by
incubation time and growth medium. PLoS ONE 2019, 14, e0210073. [CrossRef]
26. Chen, C.-Y.; Nace, G.W.; Irwin, P.L. A 6×6 drop plate method for simultaneous colony counting and MPN
enumeration of Campylobacter jejuni, Listeria monocytogenes, and Escherichia coli. J. Microbiol. Methods 2003, 55,
475–479. [CrossRef]
27. Sieuwerts, S.; De Bok, F.; Mols, E.; De Vos, W.; Vlieg, J.E.T.V.H. A simple and fast method for determining
colony forming units. Lett. Appl. Microbiol. 2008, 47, 275–278. [CrossRef] [PubMed]
28. Tan, S.-T.; Maxcy, R.B.; Stroup, W.W. Colony-forming unit enumeration by a plate-MPN method. J. Food Prot.
1983, 46, 836–841. [CrossRef] [PubMed]
© 2020 by the authors. Licensee MDPI, Basel, Switzerland. This article is an open access
article distributed under the terms and conditions of the Creative Commons Attribution
(CC BY) license (http://creativecommons.org/licenses/by/4.0/).You can also read