SPATIAL ANALYSIS OF EROSION AND QUANTIFICATION OF SOIL LOSSES IN WESTERN ALGERIA - Sciendo
←
→
Page content transcription
If your browser does not render page correctly, please read the page content below
Ekológia (Bratislava) - Journal of the Institute of Landscape Ecology, Slovak Academy of Sciences Vol. 40, No. 2, p. 130–136, 2021
doi:10.2478/eko-2021-0015
SPATIAL ANALYSIS OF EROSION AND QUANTIFICATION OF SOIL LOSSES
IN WESTERN ALGERIA
BENAMAR BELGHERBI , KHELOUFI BENABDELI
Research Laboratory in Geo-Environment and Spaces Development, Faculty of Science of Nature and Life, University of Mascara. BP 305 Sidi Said University
of Mascara 29000, Algeria; e-mail: benamar.belgherbi@univ-mascara.dz; benandeli_k@yahoo.fr
Corresponding author
Received: 4 August 2019 / Accepted: 3 February 2020
Abstract
Belgherbi B., Benabdeli K.: Spatial analysis of erosion and quantification of soil losses in western Algeria. Ekológia (Bratislava), Vol. 40, No. 2, p.
130–136, 2021.
The objective of this study is to establish a soil loss map of a region located in western Algeria allowing the spatialization of erosion models, deposition,
and quantification of soil loss. The model applied is Universal Soil Loss Equation (USLE), wich was developed by Wischmeier and Smith. The map of
current soil losses derived from it shows five areas: very low, low, medium, strong, and very strong. The significant loss in soil areas is located in most
of the south of the area, the upstream mountains part, and a portion to the northwest of the region. They cover an area of 16,805 ha (15.27%) of the
study area. The remainder of area constituting unrigged flat terrain accounts for a loss in low soil. The latter receives all the solid contributions which
are deposited there constituting an important deposit.
Key words: USLE, erosion models, erosion factors, western Algeria, water erosion.
Introduction 2 million m3 is the volume of sediment taken from the basin and
deposited at sea for the only basin tributary to the Mediterranean.
Soil loss due to erosion is a global problem, especially affecting Demmak (1982), Combeau (1977) and Roose (1994) report that
natural resources and agricultural production (Little Boy et al., 45% of Algeria´s surface area is affected by erosion, with 100 ha
1992; Bakker et al., 2005; Pimentel, 2006; Parveen, Kumar, 2012; of arable land lost per rainy day and feeding the siltation of dams.
Ighodaro et al., 2013; Tung et al., 2018). Water erosion is a very In Algeria, the adverse effects of erosion have resulted in a
widespread phenomenon in the world, and Algeria, like the oth- considerable loss of arable land, a disfigurement of the physi-
er Maghreb countries, is among the regions most affected by this cal environment through landscape degradation, desertifica-
phenomenon. It becomes a complex and difficult phenomenon tion of fragile natural environments, siltation of dams (example,
in Algeria where several factors contribute to it by intensifying Fergoug dam in the completely silted up study area), and the
it. This phenomenon has long been reported by several authors destruction of certain infrastructure such as roads and tracks.
(Pouquet, 1952; Despois, 1956; Gréco, 1966; Benchetrit, 1972; The aim is to develop a methodology for estimating water ero-
Pouget, 1974; Sari, 1977; Néboit, 1983; Aubert, 1986; Mazour, sion through quantification of soil losses resulting from ground-
Roose, 2002; Morseli et al., 2012; Meddi, 2015), highlighting that water erosion or gullies in Beni-Chougrane Mountains in western
water erosion continues to degrade considerable proportions of Algeria. The approach is based on identification and mapping of
soil, particularly in relief areas. It is the torrential nature of the the different factors involved in the erosive process. It will be fol-
rains and the combination of both natural and anthropogenic lowed by a location of the areas likely to produce sediments, which
factors (inappropriate cultivation techniques, ploughing in the will be quantified by integrating the Universal Soil Loss Equation
direction of slopes, degradation of perennial vegetation cover, (USLE) model established by Wischmeier and Smith (1978).
fires, soil conditions, steep slopes, lack of vegetation cover, long
periods of drought, fragile soils, and soft rocks) which accentu- Material and methods
ate the impact of this erosion on practically all productive spaces.
In Algeria, about 6 million hectares are exposed to active ero- Study area
sion. The average annual specific erosion varies between 2,000
and 4, 000 t/km²/year; this figure makes Algeria a country most The study area is a depression surrounded by mountains and
threatened by erosion in the world. An average of between 1 and separated from the sea by dune cords. It is bounded to the
© The Author(s) 2021. This is an open access article distributed under the terms of the CC BY-NC-ND license.
https://content.sciendo.com/view/journals/eko/eko-overview.xml
130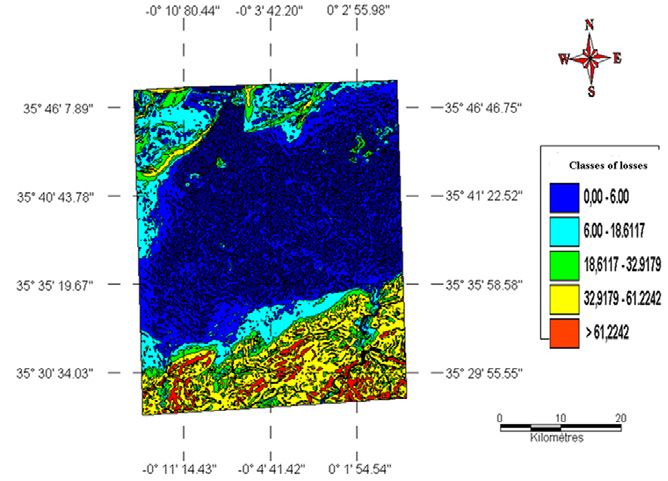
Ekológia (Bratislava) 2021: 40(2): 130–136
north by the Arzew gulf and the coastal massifs, to the east by
the southern part of the Mostaganem plateau, and to the south
by the Beni-Chougrane Mountains (Fig. 1). It covers an area of
109,315 ha; the altitude is between 0 and 608 m (Fig. 2). It is
part of the large catchment area called ”Macta” covering an area
of 1,368,677 ha. Due to its geographical position, the study area
represents a downstream point in the watershed. The slopes of
the study area varied from 0.5% to 25% (Fig. 3) and are fed by
three wadis: Sig, Habra, and Tinn.
The geological formations consist of continental Quaternary
terrain in a structure marked by drifts (Dalloni, 1919). From a
bioclimatic point of view, it belongs to floor inferior with a tem-
perate variant characterized by strong seasonal contrasts with
brutal rains and concentrated between November and March
(Belgherbi et al., 2018).
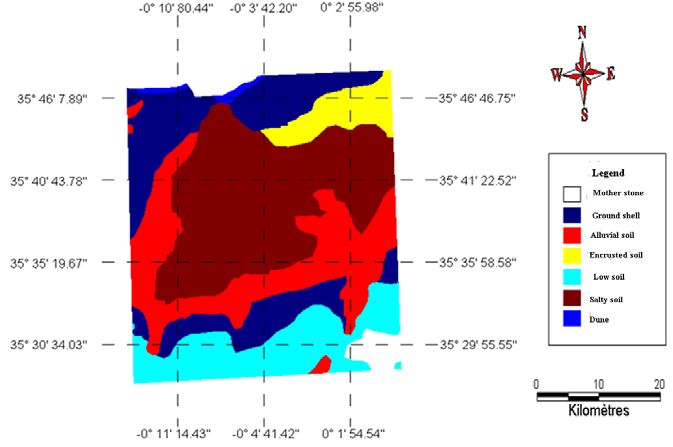
The dominant soils are salids (American soil classification)
with the sodium ion in chloride state (Gaucher, Simmoneau,
1952; Tafer, 1993; Belgherbi, Benabdeli, 2016) and a low repre-
sentation of young mountain soils and shell soils (Fig. 4).
The average population density is quite high approaching 78
inhabitants/km², with a dominant agricultural vocation since Fig. 1. Location of study area.
most of the slopes are exploited by rain cereal crops, which have
aggravated erosion problems.
The study area can be divided into four entities:
• An agricultural entity represented by agricultural land lo-
cated in the far south (citrus and olive orchards) and cereal
fields both sides of the area.
• A forest entity represented by the Tamarix forest and a small
Juniperus grove overlooking the coastal dune at a significant
stage of degradation (Belgherbi, Benabdeli, 2010).
• A range entity consisting essentially of seasonal halophyte
and hydrophytic plant species, annuals, and perennial spe-
cies dominated by Salicornia, Arthrocnemum, Grasses, Rings,
Isoetes, and Bolboschoenus maritimus (Quézel, Simmoneau,
1960).
• A seasonal marsh entity.
Data and application model
The adapted methodology consists of the application of the Fig. 2. Hypsometric map of study area.
Universal Soil Loss Equation (USLE), revised according to Wis-
chmeier and Smith (1978).
Presentation of the model
The Universal Soil Loss Equation groups all variables under five
major factors (Wischmeier, Smith, 1978). It predicts the aver-
age soil loss in the field, losses that are caused by surface erosion
(erosion by the impact of raindrops or beating, sheet erosion, and
gully erosion). It is a multiplicative function of the five factors
that control water erosion: climatic aggressiveness, soil erodibil-
ity, slope and length, land use, and erosion control practices. The
formula is expressed:
Ea = R. K. LS. C. P , (1)
where Ea is average annual land losses (t/ha/year), R is rain ero-
sion (climatic factor), K is soil erodibility factor, LS is topograph-
ic erosivity factor integrating slope and slope length, C is land
cover factor, and P is agricultural practices factor. Fig. 3. Slope map of study area.
131
Ekológia (Bratislava) 2021: 40(2): 130–136

                                                                         The index soil erodibility (K) was made by applying the Baril
                                                                     formula (Baril, 1988) tested in Mediterranean countries, notably
                                                                     in Greece, Spain, Tunisia, and Morocco, where it gave satisfac-
                                                                     tory results. K is strongly related to the physical proprieties of
                                                                     the soil and plays an important role in soil conservation strate-
                                                                     gies (Shabani et al., 2014). The K index is determined from the
                                                                     following expression:

                                                                         100 k = 2.1*10-4*(12 - %MO) M1.4+3.25* (S-2) +2.5*(P-3), (3)

                                                                     where MO is the percentage of organic matter, S is the structure
                                                                     code, P is the permeability class, and M is (% fine sand + % silt)
                                                                     (100 - % clay).
                                                                     For spatialization of the K factor, several samples were taken
                                                                     from each soil type in study area. The analyses carried out con-
Fig. 4. Soil map of study area.                                      cern grain size, organic matter content, and permeability. The re-
                                                                     sults of the permeability obtained were attributed by a numerical
                                                                     value according to the classification of USDA (1952).
                                                                         These data are entered into the USEL model, digitized in a
                                                                     GIS using the soil map of the study area, and assigned the respec-
                                                                     tive erodibility factor K to each soil type. The index topographic
                                                                     factor (LS): Topographic factor is the slope length gradient fac-
                                                                     tors comprising L, slope length, and S, slope steepness (Panagos
                                                                     et al., 2015). The LS index is determined from the following
                                                                     expression:

                                                                         LS = (l/22, 15) m (65.41*sin2S+4.56*sinS + 0.065),           (4)

                                                                     where l is the length of the slope (in m) and S is the slope inclina-
                                                                     tion (in %).
                                                                         The LS topographic index is produced by juxtaposing two
                                                                     maps (slope map and slope length map). The vegetation cover
                                                                     factor (C) takes into account the nature and density of the veg-
                                                                     etation cover. To be able to evaluate this factor for the different
                                                                     vegetation cover units, it is necessary to establish a land use map
                                                                     for our study area. The C factor is most important factor that
                                                                     controls soil erosion risk (Knijff et al., 2000). The results were
                                                                     compared with the study results of Cormary and Masson (1964)
                                                                     to assign a value to each plant formation represented at the study
Fig. 5. Methodological flowchart.                                    area level. The anti-erosion practices factor reflects techniques
                                                                     that reduce the amount of runoff and its velocity, thereby de-
                                                                     creasing the effects of water erosion; such as: contour planting,
                                                                     shallow plowing, mulching,...
     The index rain erosivity (R) is equal to the kinetic energy         This index is estimated on the basis of field observations by
of the rains, multiplied by the maximum rain intensity over 30       evaluating the various actions taken to reduce the effect of ero-
minutes expressed in cm per hour. The erosivity factor of rainfall   sion. This factor is obtained by comparison a standard P=1 for
(R) is a function of the falling raindrop and the rainfall inten-    unmanaged areas. If there is no erosion control solution, then
sity, and it is the product of kinetic energy of the raindrop and    P value should be 1. P is considered the most uncertain values
the 30-minute maximum rainfall intensity (Pandey et al., 2007).      (Morgan, Nearing, 2011).
Some authors (Kalman, 1967; Arnoldus, 1980) have developed
alternative formulas that only imply monthly and yearly precipi-     The data necessary for the application
tation. Rainfall erosion was calculated by applying the Arnoldus
formula (Arnoldus, 1980). This choice depends on the nature of       The data used can be summarized into two main categories:
the precipitation data available at the reference meteorological     cartographic documents and satellite images. The various maps
station (Sidi Abdelmoumen station). The climatic aggressive fac-     used to carry out this water erosion assessment work are six in
tor R is expressed as follows:                                       number and are summarized in Table 1. In the satellite image
                                                                     category, we have used Landsat TM image with a resolution of
    R= 1.735*10*(1.50 logΣPi/P - 0.8188),		                   (2)    30 m. The choice of this type of satellite image was conditioned
                                                                     by both the presence of scenes containing the area and its avail-
where I is month and P is monthly precipitation.                     ability has a resolution of 30 m.

132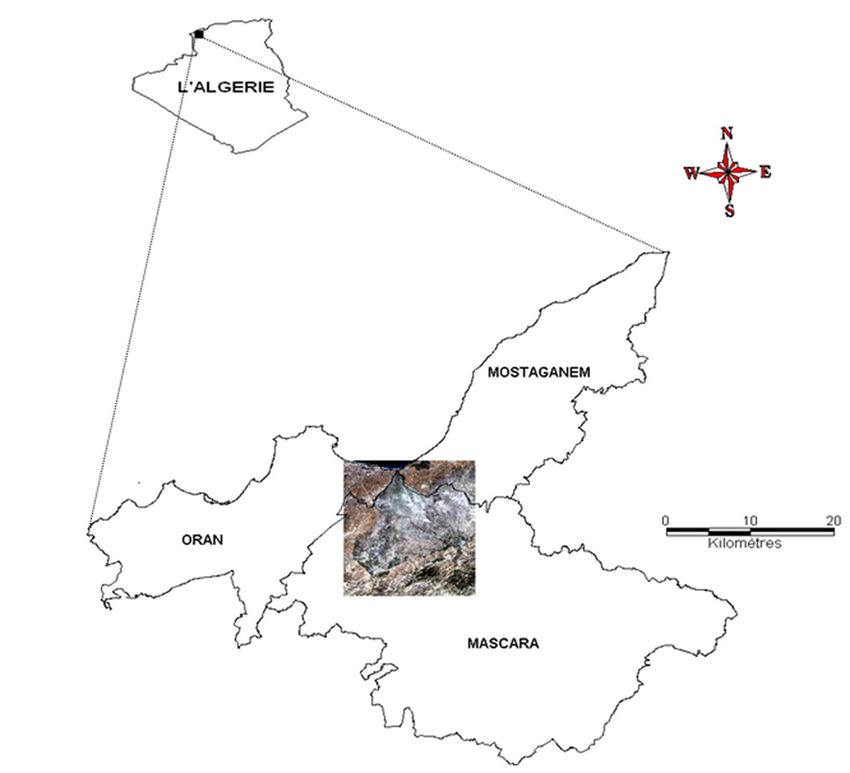
Ekológia (Bratislava) 2021: 40(2): 130–136

Methodology adopted

The soil loss assessment was carried out using satellite images
(Landsat TM), topographic maps at a scale of 1:50,000, the veg-
etation map of Santa et al. (1958), for a spatialized knowledge of
erosion differentiation factors (land use, importance of vegeta-
tion cover) and measurements and observations of the ground.
The use of Geographic Information System (GIS) for analysis
and modeling of erosion and deposition processes will comple-
ment our approach. The approach adopted can be summarized
as follows (Fig. 5):
•    Several field trips were carried out to validate and correct
     the land use map, estimate and visualize erosion control
     techniques, and take soil samples for possible laboratory
     analysis.
•    The satellite image was used to map land use and occupation
     in the region.
•    The MapInfo 8.0 (GIS software) was manipulated to set up
     the digital terrain model (DTM) and obtain some maps,              Fig. 6. Map of soil erodibility factor.
     mainly the slope length map and the slope inclination map.
     The same software was used to create the soil map.

Results

Determination of model parameters

Rainfall erosivity factor (R)

The average annual rainfall from 1983 to 2017, provided by the
Sidi Abdelmoumen station, was used to calculate the R factor for
entire study area. The R value of 36.94t/ha/h was calculated on a
single precipitation value P for an annual average precipitation
of 243 mm.

Soil erodibility factor (K)

Permeability analyses demonstrated two classes: a soil with
a moderate water absorption rate and a slow to moderate soil,
representing, respectively, according to the USDA classification
(1951) a value of 3 and 4.
    The erodibility factor map (Fig. 6) thus established allowed to     Fig. 7. Topographic factor map.
highlight five (5) classes taking into account the different types of
soil encountered. The highest value is attributed to the shell soil,
the inked soil, and the poorly evolved soil with 0.30, 0.28, and
0.21, respectively. The values varied from 0.14 to the minimum
and 0.30 to the maximum.

Topographic factor (LS)

The distribution map of the LS factor (Fig. 7) illustrates an im-
portant range in value where the index varies between 0.82 and
8.28. The highest values are located in the upstream part of the
area; they are concentrated in the southern part of the area repre-
sented by a mountainous massif with steep slopes.

Vegetation cover factor (C)

The study area is mainly spatialized by three occupation classes
and land use (Fig. 8): a first class represented by forest formations   Fig. 8. Map of vegetation cover factor.

                                                                                                                                        133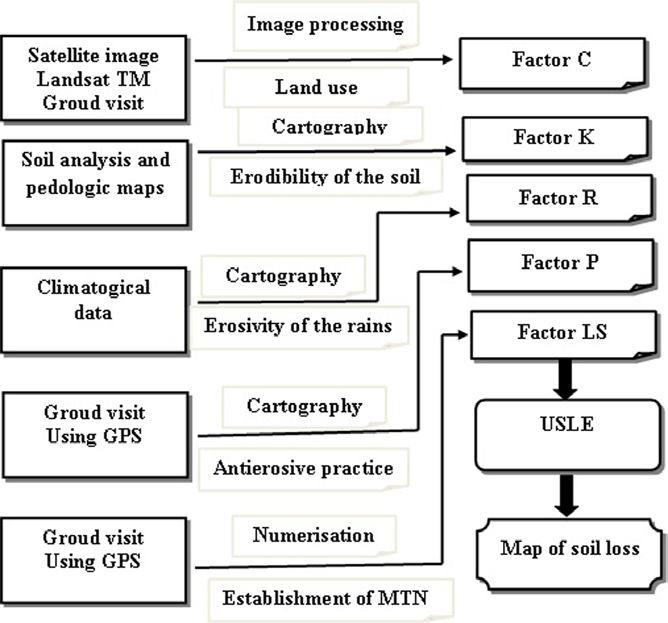
Ekológia (Bratislava) 2021: 40(2): 130–136
Discussion
The value of erosivity factor remains very high considering that
most of the rains are torrential and the study area remains bare
for a fairly long period of the year on topography of an uneven
terrain. According to Fournier (1960), solid transport was essen-
tially a function of two factors: the topography and aggressive-
ness or continentality index of the rains.
The parameter erodibility factors show a clear fragility of
soils and their susceptibility to erosion, knowing that the K index
varies from 0.70 for most fragile soils to 0.01 on the most stable
soils (Roose, 1994). The slope influences the aggressiveness of
erosion, but the existence of erosion also on low slopes indicates
that there is no need for a steep slope to trigger this phenom-
enon: rainfall action is sufficient (Fauck, 1956; Fournier, 1967).
The bare soil (vegetation cover factor) dominates more than
Fig. 9. Soil loss map.
89% of the land occupation, which explains the area����������
´���������
s vulner-
ability to erosion and the extent of land loss recorded. Late cul-
tivated plots develop an erosion of less than 20% of the erosion
totaling an area of 6,578 ha (6.05%), a second class for agricul-
measured on bare plots (Wischmeier, Smith, 1978). Mouffaddal
tural and pastoral purposes covering 97,618 ha (89.27%), and a
(2002) confirms that groundwater erosion in forest environ-
last class covering bare soils, sebkha, and agglomerations with an
ments, even degraded, and under olive trees remains modest
area of 8,119 ha (4.68%).
despite the steep slopes. On fallow land, sediments are often
The values of the vegetation cover index vary between 0.13
trapped in tufts of grass, but runoff is abundant between tufts.
and 1 depending on the type of land use where it is assigned to
The rangeland causes compaction of the superficial horizon and
the bare soil the value 1. The exploitation of map n°8 underlines
thus increases runoff, often resulting in gullying of downstream
that the value 0.40 represents cereal cultivation, class 0.13 repre-
fields (Sabir et al., 1994).
sents grazing land, and class 1 represents bare soil.
Taking into account the tolerance threshold defined by Heu-
sch (1982) as 12t/ha/year, it appears that a fairly large part of
Anti-erosion practice factor (P) the study area is subject to sheet erosion and intense runoff. The
mountains part is characterized by uneven terrain and steep
Agriculture practiced throughout the area is exclusively cereal- slopes. The soils are formed of particulate structure and granu-
based; no application of anti-erosion cultivation techniques is lometry predominantly so friable (young mountain soil and shell
practiced for the following reasons: land fragmentation, lack of soil) and susceptible to erosion action. The widespread practice
resources, and ignorance of erosion problems. All interventions of cereal farming is another aggravating factor since the soil
carried out on land with a steep tree slope, arboreal, reforesta- remains bare for more than 5 months, which generally corre-
tion, and cereal cultivation do not obey any rules taking into ac- sponds to the autumn and winter rainy periods. In mountains,
count the configuration of the land. No anti-erosion techniques gully erosion and dry mechanical erosion processes are accentu-
are applied, such as low walls, bleachers, benches, and agricul- ated by steep slopes and quickly lead to the stripping of superfi-
tural teenagers. In this context, the value P = 1 was assigned to cial horizons, most humiferous, especially when the soil is bare
the entire area of the study area. and worked on the surface by disc ploughing instruments.
The central part of the study area is represented by a very
Erosion mapping and validation of results low-slope plain and alluvial saline soil, and it is a downstream
point in the study area. It is also the place of deposition of the
The combination of rain erosion factors R, soil erosion K, topo- solid thrust produced by runoff and sheet erosion from the oth-
graphic factor LS, vegetation cover factor C, and practical an- er part of the area. The highest soil losses and runoff occur at a
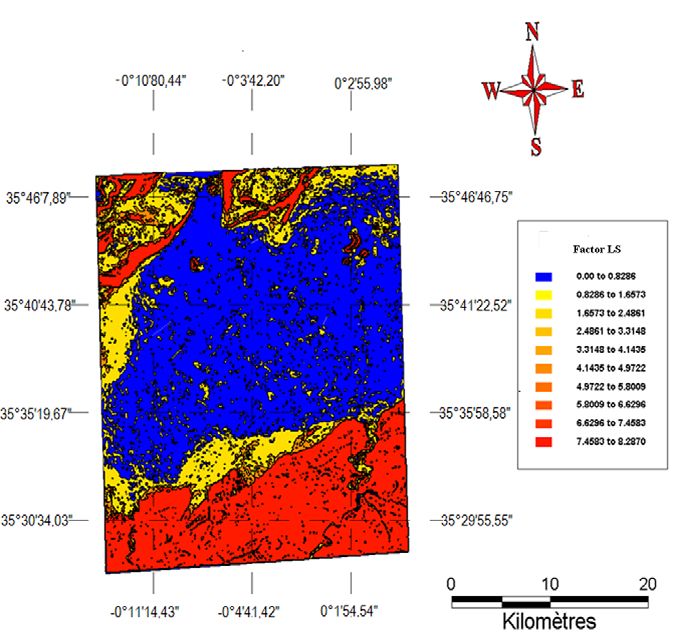
ti-erosion factor P produced the soil loss map (Fig. 9). Slope, time where the soil is already very humid and coincides with the
erodibility, and vegetation cover have greatly contributed to the stormy autumn and spring rains. It has been proven that sheet
development of soil map and soil behavior in the face of water erosion selectively removes organic matter, clay silt colloids, and
erosion. As for the rain, it represents the engine of water erosion, nutrients, while gutter erosion does not selectively scrape the
but it remains less important than the factors mentioned above soil. When gutter erosion develops, it generally decays the hu-
in classifying soils according to their sensitivity to water erosion. mus horizon, especially on steep slopes (Bolline, 1982).
The use of the soil loss map (Fig. 9) shows that soil losses vary But practically, as is the case in our study area, it is very dif-
between 6 and 61. The most significant soil losses are located in ficult to separate sheet erosion from gully erosion (Fig. 4). Under
the southern and northwestern part an area of 16,805 ha, repre- such conditions, sloping terrain, from ground without vegeta-
senting a rate of 15.27% of the total area. tion cover for a significant period of the year and the presence
The moderate soil loss (6-18 t/ha/year) and low soil loss (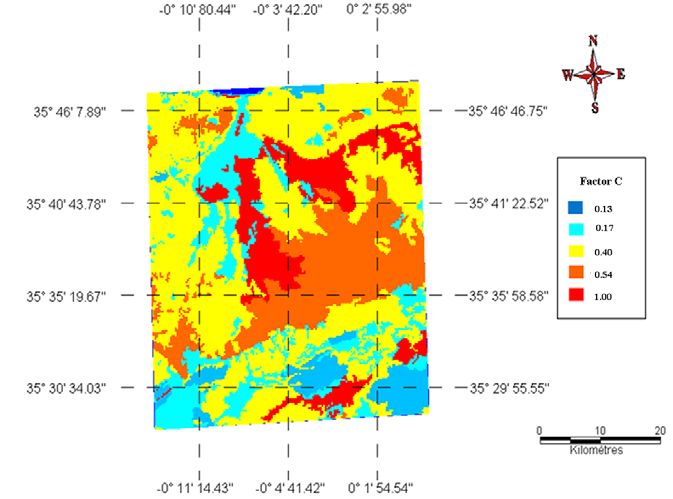
Ekológia (Bratislava) 2021: 40(2): 130–136

to widespread gullying or badlands. Several authors (Chaplot                           Belgherbi, B., Benabdeli, K. & Mostefai K. (2018). Mapping the risk of forest
et al., 2004; Albergel et al., 2008; Benslimane et al., 2011) have                          fires in Algeria: Application of the forest of Guetarnia in western Algeria.
                                                                                            Ekológia (Bratislava), 37(3), 289‒300. DOI: 10.2478/eko-2018-0022.
confirmed that gully erosion produces significantly more erosion
                                                                                       Benchetrit, M. (1972). L’érosion actuelle et ses conséquences sur l’aménagement
per hectare than sheet erosion. However, as this last affects much                          en Algérie. Édit. Presses Universitaires de France, Paris, PUF.
larger areas, it is sheet erosion that ultimately brings the most                      Benslimane, A., Raclot, D., Evrard, O., Sanaa, M., Lefevre, I., Ahmadi, M. &
sediment to the dam.                                                                        Le Bissonnais Y. (2011). Quantification des sources d’érosion à l’échelle du
     The severity of the erosion problem and the importance of its                          bassin versant : illustration sur le bassin de Kamech, Cap Bon, Tunisie.
                                                                                            Colloque sur l’érosion hydrique et la vulnérabilité des sols au Maghreb :
impact on the land in the study area are not only due to physical
                                                                                            état des lieux et perspectives (Rabat).
factors (aggressive rainfall, slope length and slope, soil charac-                     Bolline, A. (1982). Etude et prévision de l’érosion des sols limoneux cultivés en
teristics) but also largely responsible to anthropic factors (forest                        moyenne Belgique. Thèse Doctorat Géographie, Univ Liège (Belgique).
fires, trampling of livestock, illegal logging, cultural practices,                         IRSIA.
speculation...) (Fig. 5). The results obtained confirm with a lo-                      Chaplot, V., Le Bissonnais, Y., Bernadou, J. & Runnoff (2004). Soil andSOC
calized quantitative contribution that erosion in Algeria is at the                         losses with a small sloping land catchment of Laos under shifting cultiva-
                                                                                            tion. Bulletin du Réseau Érosion, 22, 263‒276.
origin of considerable land losses that also have negative impacts                     Combeau, A. (1977). Erosion et conservation des sols. Paris: Cahiers OR-
on the economy, such as infrastructure degradation and soil fer-                            STOM.
tility.                                                                                Cormary, Y. & Masson J. (1964). Application à un projet type de la formule
                                                                                            de perte de sols de Wischmeier: étude de conservation des eaux et du sol.
                                                                                            Cahiers ORSTOM, série Pédologie, 2(3), 3‒26.
Conclusion                                                                             Dalloni, M. (1919). Le terrain houiller sur le littoral de la province d’Oran.
                                                                                            Comptes Rendus de l’Académie des Sciences, 168, 1008‒1010.
The evaluation of soil losses undertaken in an area fairly repre-                      Demmak, A. (1982). Contribution à l’étude de l’érosion et des transports solides
sentative of other regions of Algeria made it possible to highlight                         en Algérie septentrionale. Thèse de Docteur Ingénieur, Université de
a classification of areas according to the size of the land losses                          Paris VI.
                                                                                       Despois, J. (1956). La culture en terrasses en Afrique du Nord. Annales Écon-
recorded. The method used, based on the application of the Uni-
                                                                                            omie, Société et Civilisation, 11(1), 42‒50.
versal Soil Loss Equation (USLE) associated with remote sensing                        Ellison, W. (1944). Studies of raindrop erosion. Agricultural Engineering, 25,
and geographic information system, made it possible to estimate                             131‒181.
the average loss of 55.22 t/ha/year. This value corresponds to very                    Fauck, R. (1956). Erosion et mécanisation agricole en Casamance (Sénégal).
high erosion not tolerated by fragile soils, which are also subject                         Bureau du sol en Afrique occidentale.
to a semi-arid climate with low rainfall but stormy character.                         Fournier, F. (1960). Climat et érosion. Presses Universitaire de France (PUF).
                                                                                       Fournier, F. (1967). La recherche en érosion et conservation des sols sur le
    Soil loss results valued up to 61.22 t/ha/year show that the                            continent africain. Sols Africains, 12(1), 5-53.
southern and northwestern part of the study area is the most vul-                      Gaucher, G. & Simoneau P. (1952). Monographie agricole de la plaine de
nerable; they are characterized by a dominance of shallow soils                             Saint Denis. Terres et Eaux, 14 et 15.
with a light texture and low organic matter content and located                        Gréco, J. (1966). L’érosion, la défense et la restauration des sols et le reboisement
on high slopes. Approximately 16,805 ha (15.27%) of the total                               en Algérie. Alger: MARA.
                                                                                       Heusch, B. (1982). Etude de l’érosion et des transports solides en zone semi-
area are concerned by this assessment. Regions of low soil loss or
                                                                                            aride. Recherche bibliographique sur l’Afrique du nord, Projet RAB,
deposition correspond to areas of low slope located in the central                          PNUD, 80-04.
part of the area that collects the erosion product (solid bedload)                     Ighodaro, I.D., Lategan, F.S. & Yusuf S.F.G. (2013). The impact of soil ero-
that constitutes a significant alluvial deposit.                                            sion on agricultural potential and performance of Sheshegu community
                                                                                            farmers in the eastern cape of south Africa. J. Agric. Sci., 5(5), 140‒147.
                                                                                            DOI : 10.5539/jas.v5n5p140.
References                                                                             Kalman, R. (1967). Le facteur climatique de l’érosion dans le bassin de Sebou
                                                                                            (Maroc). Projet Sebou, Rapp inédit. Ministère de l’agriculture.
Albergel, J., Zante, P., Collinet, J., Attiar, R. & Merzouk A. (2008). Ravinement      Knijff, J.M., Jones, R.J.A. & Montanarella L. (2000). Soil erosion risk assess-
    et bilan hydro-sédimentaire des lacs de retenue collinaires au Maghreb.                 ment in Europe. Joint Research Centre, European Commission, EUR
    In E. Roose, J. Albergel, G. de Noni, M. Sabir & A. Laouina (Eds.), Effi-               19044 EN.
    cacité de la GCES en milieux semi-arides (pp. 378‒384). Paris: AUF, EAC,           Little Boy, M., Freebairn, D.M., Hammer, G.L. & Silburn D.M. (1992). Impact
    IRD.                                                                                    of soil erosion on production in cropping systems. II. Simulation of pro-
Arnoldus, H.M.J. (1980). An approximation of the rainfall factor in the                     duction and erosion risks for a wheat cropping system. Aust. J. Soil Res.,
    USLE. In M. de Boodt & D. Gabriels (Eds.), Assessment of erosion (pp.                   30(5), 775‒788. DOI: 10.1071/SR9920775.
    127‒132). New York: John Wiley.                                                    Mazour, M. & Roose E. (2002). Influence de la couverture végétale sur le ruis-
Aubert, G. (1986). Réflexions sur l’utilisation de certains types de banquettes             sellement et l’érosion des sols sur parcelles d’érosion dans les bassins ver-
    de “Défense et Restauration des Sols” en Algérie. Cahiers ORSTOM, série                 sants du Nord-ouest de l’Algérie. Bulletin du Réseau Érosion, 21, 320‒330.
    Pédologie, 22(2), 147‒152.                                                         Meddi, M. (2015). Contribution à l’étude du transport solide en Algérie du
Bakker, M.M., Govers, G., Kosmas, C., Vanacker, V., Oost, K.V. & Rounse                     nord. Larhyss Journal, 24, 315‒336.
    M. (2005). Soil erosion and drivers of land use change. Journal of Ag-             Morgan, R.P.C. & Nearing M.A. (2011). Handbook of erosion modeling. Black-
    riculture, Eco-Systems and Environment, 105, 467‒481. DOI: 10.1016/j.                   well Publishing. DOI: 10.1002/9781444328455.
    agee.2004.07.009.                                                                  Morseli, B., Habi, M., Mazour, M., Hamoudi, A. & Halitim A. (2012). Ero-
Baril, P. (1988). Notes de cours choisies sur l’érosion el la conservation des sols.        sion et ruissellement en montagnes méditerranéennes d’Algérie du Nord:
    Ecole Polytechnique Fédérale de Lausanne.                                               analyse des facteurs conditionnels sous pluies naturelles et artificielles.
Belgherbi, B. & Benabdeli K. (2010). Contribution à l’étude des causes de                   Revue Marocaine des Science Agronomiques et Vétérinaires, 1(1), 33‒40.
    dégradation de la forêt de Tamarix au niveau de la zone humide de la               Mouffaddal, K. (2002). Premiers résultats des parcelles d’érosion dans le bas-
    Macta (Algérie occidentale), Revue Forêt Méditerranéenne, 31(1), 55‒62.                 sin de Nakhla, Maroc. Bulletin du Réseau Érosion, 21, 244‒254.
Belgherbi, B. & Benabdeli K. (2016). Etude phyto-écologique et préservation            Néboit, R. (1983). L’homme et l’érosion : l’érosion des sols dans le monde. Asso-
    de la biodiversité de la zone humide de la Macta (Algérie occidentale). Edi-
                                                                               ����         ciation des publications de la faculté des lettres et des sciences humaines.
    tion Universitaires Européennes.                                                        France.

                                                                                                                                                                     135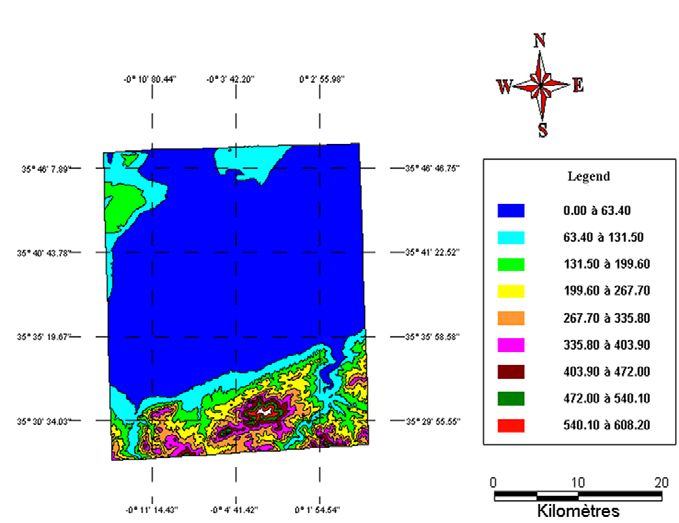
Ekológia (Bratislava) 2021: 40(2): 130–136

Panagos, P., Borrelli, P. & Meusburger K. (2015). A new european slope          Roose, E. (1994). Introduction à la gestion conservatoire de l’eau, de la bio-
    length andSteepnees factor (LS-factor) for modeling soil erosion by wa-          masse et de la fertilité des sols (GCES).FAO Soils Bulletin Vol. 70. Rome.
    ter. Geosciences, 5(2), 117‒126. DOI: 10.3390/geosciences5020117.           Sabir, M., Merzouk, A. & Berkat O. (1994). Impact du pâturage sur les pro-
Pandey, A., Chowdary, V.M. & Mal B.C. (2007). Identification of critical ero-        priétés hydriques du sol dans un milieu pastoral aride : Maroc. Bulletin
    sion prone area in the small agricultural watershed using USLE, GIS and          du Réseau Érosion, 14, 444‒462.
    remote sensing. Water Resources Management, 21(4), 729‒746. DOI:            Santa, S., Daumas, P., Simonneau, P., Chavassut, G.& Jacquard B. (1958).
    10.1007/s11269-006-9061-z.                                                       Carte de la végétation de l’Algérie. Bosquet-Mostaganem.
Parveen, R. & Kumar U. (2012). Integrated approach of universal soil loss       Sari, D. (1977). L’homme et l’érosion dans l’Ouarsenis (Algérie). Alger: SNED.
    equation (USLE) and geographical information system (GIS) for               Shabani, F., Kumar, L. & Esmaeili A. (2014). Improvement to the prediction
    soil loss risk assessment in upper south Koel Basin, Jharkhand. Jour-            of the USLE K factor. Geomorphology, 204, 229‒234. DOI: 10.1016/j.geo-
    nal of Geographic Information System, 4(6), 588‒596. DOI: 10.4236/               morph.2013.08.008.
    jgis.2012.46061.                                                            Tafer, B. (1993). Etude phytoécologique des complexes de végétation halophiles
Pimentel, D. (2006). Soil erosion: A food and environmental threat. Envi-            de la plaine de Mohammadia (Macta-Oranie). Thèse Doc, Université de
    ronment, Development and Sustainability, 8(1), 119‒137. DOI : 10.1007/           Droit, d’économie et des sciences d’Aix-Marseille.
    s10668-005-1262-8.                                                          Tung, G.P., Jan, D. & Martin K. (2018). Integrated universal soil loss equation
Pouget, M. (1974). Etude agro-pédologique de la région d’Ouzera (Algérie).           (USLE) and Geographical Information System (GIS) for soil erosion es-
    Rapport ANRH, Alger.                                                             timation in ASap basin: Central Vietnam. International Soil and Water
Pouquet, J. (1952). Les Monts du Tessala (chaînes sud-telliennes d’Oranie):          Conservation Research, 6, 99‒110. DOI: 101016/j.iswcr.2018.01.001.
    Essai morphogénétique. Revue de Géographie Alpine, 40(4), 691‒694.          USDA (1951). Soil survey manual. Washington: USDA.
Quezel, P. & Simmoneau P. (1960). Quelques aspects de la végétation des ter-    Wischmeier, W. & Smith D. (1978). Predicting rainfail erosion losses - A guide
    rains salés des plaines sub-littorales de l’Oranie orientale. DHER, Bull,        to conservation planning. Washington: USDA.
    n°6, Alger.

136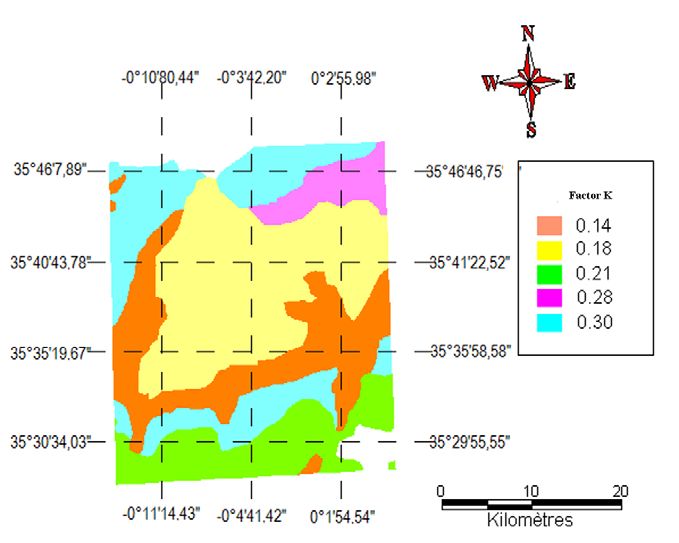
You can also read