Finding locations of Flickr resources using language models and similarity search
←
→
Page content transcription
If your browser does not render page correctly, please read the page content below
Finding locations of Flickr resources using language
                  models and similarity search

                                                                         ∗
               Olivier Van Laere                   Steven Schockaert                       Bart Dhoedt
            Department of Information           Dept. of Applied Mathematics         Department of Information
               Technology, IBBT                   and Computer Science                  Technology, IBBT
            Ghent University, Belgium            Ghent University, Belgium           Ghent University, Belgium
          olivier.vanlaere@ugent.be            steven.schockaert@ugent.be            bart.dhoedt@ugent.be

ABSTRACT                                                         i.e. short (but otherwise unconstrained) textual descriptions
We present a two-step approach to estimate where a given         that are provided by users, although in the case of Flickr,
photo or video was taken, using only the tags that a user        only owners can add tags. Such tags help users to organize
has assigned to it. In the first step, a language modeling ap-   the resources they find interesting or to otherwise facilitate
proach is adopted to find the area which most likely contains    retrieval of such resources (by themselves or by others) in
the geographic location of the resource. In the subsequent       the future [2]. In the case of photos and videos, most of
second step, a precise location is determined within the area    the structured metadata is provided automatically by the
that was found to be most plausible. The main idea of this       camera, without any involvement of the user. These types
step is to compare the multimedia object under consider-         of metadata usually include the type of camera, the settings
ation with resources from the training set, for which the        that were used (e.g. aperture, focal distance, etc.) and the
exact coordinates are known, and which were taken in that        time and date. In a limited number of cases, cameras also
area. Our final estimation is then determined as a func-         provide geographic coordinates, using a built-in or exter-
tion of the coordinates of the most similar among these re-      nally connected GPS device. Flickr additionally offers the
sources. Experimental results show this two-step approach        possibility of manually indicating on a map where a photo
to improve substantially over either language models or sim-     was taken.
ilarity search alone.
                                                                 The availability of location metadata is important for at
                                                                 least two reasons. First, it allows users to easily retrieve
Categories and Subject Descriptors                               photos or videos that were taken at a particular location,
H.4 [INFORMATION SYSTEMS APPLICATIONS
                                                                 e.g. by explicitly supporting spatial constraints in queries
]: Miscellaneous; H.3.7 [INFORMATION STORAGE
                                                                 [13], or by displaying the resources on a map which users can
AND RETRIEVAL]: Digital libraries
                                                                 explore [14]. Second, by analyzing the correlation between
                                                                 geographic location and the occurrence of certain tags, we
General Terms                                                    may discover geographic knowledge beyond what is usually
Experimentation, Measurement                                     described in gazetteers [4, 6]. As a result of these considera-
                                                                 tions, and given that only a small fraction of Flickr resources
Keywords                                                         are currently geo-annotated, there has been a recent interest
Geographic information retrieval, Language models, Semi-         in techniques that could automatically estimate the geogra-
structured knowledge, Geo-annotation                             phic location of photos and videos [8]. More generally, there
                                                                 seems to be a trend towards leveraging user-contributed, un-
                                                                 structured information to structured, semantic annotations,
1.   INTRODUCTION                                                e.g. automatically completing Wikipedia infoboxes [16] or
Web 2.0 systems such as Flickr bring structure in collec-        building ontologies from user tags [12].
tions of shared multimedia objects by taking advantage of
both structured and unstructured forms of metadata. Un-          Several kinds of information are available to estimate the
structured metadata is mainly available in the form of tags,     geographic location of a photo or video: visual features, user
∗Postdoctoral Fellow of the Research Foundation – Flanders       profiles, and tags. Visual features may be useful to recog-
                                                                 nize certain types of landmarks, or to differentiate photo
(FWO).
                                                                 or videos that were taken e.g. at the beach from resources
                                                                 taken in a city center. In general, however, visual infor-
                                                                 mation alone is not likely to be sufficient for determining a
                                                                 specific location. Similarly, user profiles may be useful to
                                                                 introduce a bias (e.g. users are more likely to take photos
                                                                 closer to the place where they live), but they do not contain
                                                                 sufficient information to pinpoint where a photo or video
                                                                 was taken. In this paper, we exclusively focus on the third
                                                                 type of available information, viz. the tags associated with a
                                                                 resource. Indeed, before the value of visual features or user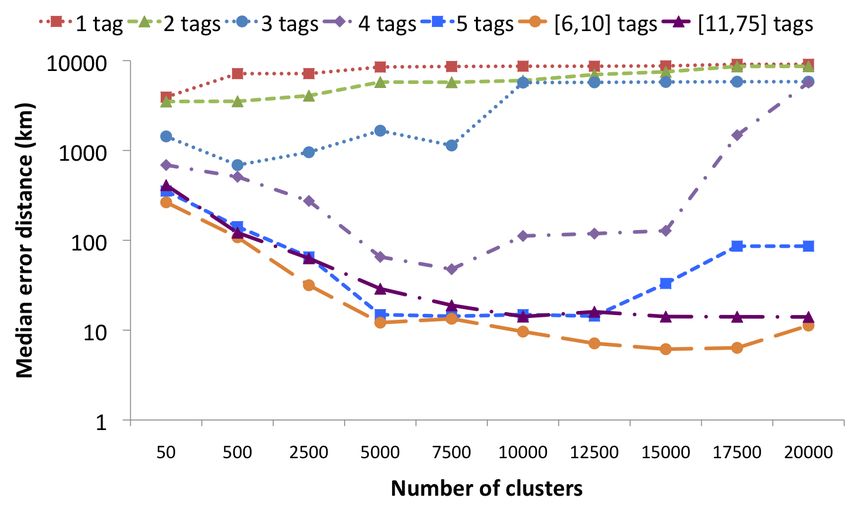
profiles for this task can be assessed, in our opinion, a more
thorough understanding is needed of the kind of geographic
information that can be extracted from tags.

To estimate the location of a multimedia object based on its
tags, three natural strategies present themselves. First, we
may use gazetteers to find the locations of those tags that
correspond to toponyms. Although intuitive, this strategy
has proven to be particularly challenging in practice, among
others due to the fact that no capitalization occurs in tags,
making it difficult to identify the toponyms (e.g. nice vs.
Nice), as well as due to the high ambiguity of toponyms and
the limited amount of context information that is available
for disambiguation. Second, we may interpret the problem
of georeferencing as a classification problem, by partitioning
the locations on earth into a finite number of areas. Stan-          Figure 1: Plot of all the photos in the training set
dard language modeling approaches can then be used to de-
termine the most likely area for a given resource, represented
                                                                     the basis of our system: finding the most plausible area, us-
as its set of tags. This method eliminates the problem of de-
                                                                     ing a standard language modeling approach, and finding the
termining which tags are toponyms, or any form of (explicit)
                                                                     most likely location within that area, using similarity search.
disambiguation. A drawback, however, is that it results in
                                                                     Next, in Section 5 we explain how these two methods can be
an entire area, rather than a precise coordinate. The more
                                                                     combined, and show that this combination performs better
areas in the partition, the more fine-grained our conclusion
                                                                     than the two components on which it is based. Finally, we
will be, but, the higher the chances of classification error
                                                                     provide an overview of related work and conclude.
become. Third, we may resort to similarity search, and esti-
mate the location of a given resource as a weighted average of
the locations of the most similar objects in our training set,       2.   DATA ACQUISITION AND PREPROCESS-
e.g. using a form of similarity that is based on the overlap              ING
between tag sets. In this case, we do obtain precise coordi-
                                                                     As training data, we used a collection of 8 685 711 photos,
nates, but the performance of the method may be limited by
                                                                     containing the 3 185 258 georeferenced Flickr photos that
the fact that it treats spatially relevant tags in the same way
                                                                     were provided to participants of the Placing Task, together
as others. For instance, a resource tagged with paris,bridge
                                                                     with an additional crawl of 5 500 368 georeferenced Flickr
will be considered as similar to a resource tagged with lon-
                                                                     photos. In addition to the coordinates themselves, Flickr
don,bridge as to a resource tagged with paris,cathedral. In
                                                                     provides information about the accuracy of coordinates as a
this paper, we propose to combine the best of the latter two
                                                                     number between 1 (world-level) and 16 (street level). When
strategies: first use a classifier to find the most likely area in
                                                                     crawling the additional data, we only crawled Flickr photos
which a photo or video was taken, and then use similarity
                                                                     having an accuracy of at least 12, to ensure that all coor-
search to find the most likely location within that area.
                                                                     dinates were meaningful w.r.t. within-city location. Once
                                                                     retrieved, photos that did not contain tags or valid coordi-
We have participated in the Placing Task of the 2010 Media-
                                                                     nates were removed from the collection. Next, we ensured
Eval benchmarking initiative [8] using a system based on
                                                                     that at most one photo was retained in the collection with a
this two-step approach. Our system came out best, localiz-
                                                                     given tag set and user name, in order to reduce the impact
ing about 44% of the videos in the test collection within 1km
                                                                     of bulk uploads [14]. Once filtered, the remaining dataset
of their true location. In this paper, we present the details
                                                                     contained 3 271 022 photos. A visual representation of this
of our system, and we analyze which aspects are responsible
                                                                     dataset is shown in Figure 1.
for its performance, focusing on two crucial points. First, we
stress the importance of combining classification (e.g. using
                                                                     The test videos provided for the Placing Task contain videos
language models) with interpolation (e.g. using similarity
                                                                     that are part of bulk uploads, in the sense that some videos
search), revealing that neither method alone is capable of
                                                                     were uploaded around the same time as some photos in the
producing equally good results. Second, we analyze the in-
                                                                     training set by the same user, often resulting in a very high
fluence of user-specific tags. In particular, in case of the
                                                                     similarity between the tag set of the corresponding videos
Placing Task, it turns out that most of the users that own a
                                                                     and photos. To avoid any undesirable effects of bulk uploads
video from the test collection also own one or more photos
                                                                     in our evaluation, we crawled a collection of 10 000 Flickr
in the training data: among the 4576 test videos with at
                                                                     videos that have been uploaded later than the most recent
least one tag, 923 different users appear of whom 873 own
                                                                     photo from the training set. We furthermore restricted our-
at least one photo in the training set. We analyze to what
                                                                     selves to videos with an accuracy level of 16, to ensure that
extent the availability of such previous geo-annotations by
                                                                     our gold standard was as accurate as possible. This data set
the same user influences the performance of the system.
                                                                     was then split into 7 400 videos that are owned by a user
                                                                     who also has at least one photo in our training set, and 2 600
The paper is structured as follows. First, we detail the na-
                                                                     videos by users who do not appear in the training set.
ture of the data sets that have been used, as well as the pre-
processing methods that were applied. The subsequent two
                                                                     Next, the locations of the photos in the training set were
sections individually consider the two strategies that lie at
                                                                     clustered in a set of disjoint areas A using the k-medoids al-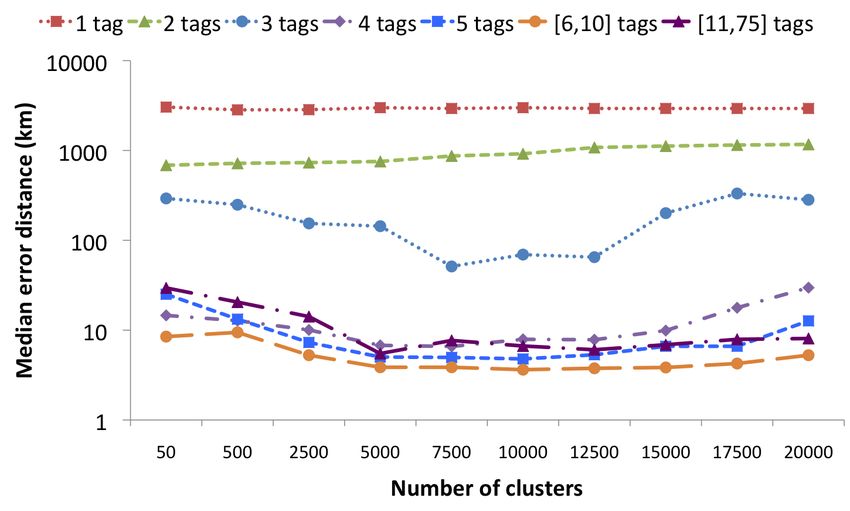
gorithm with geodesic distance, considering a varying num-
ber of clusters k. We consider ten different resolutions and
thus ten different sets of areas Ak . The datasets were clus-
tered into 50, 500, 2 500, 5 000, 7 500, 10 000, 12 500, 15
000, 17 500 and 20 000 disjoint areas respectively.

Subsequently, a vocabulary V consisting of ‘interesting’ tags
is compiled, which are tags that are likely to be indicative
of geographic location. We used χ2 feature selection to de-
termine for each area in A the m most important tags. Let
A be the set of areas that is obtained after clustering. Then
for each area a in A and each tag t occurring in photos from
a, the χ2 statistic is given by:
                (Ota − Eta )2   (Ota − Eta )2   (Ota − Eta )2
  χ2 (a, t) =                 +               +
                    Eta             Eta             Eta             Figure 2: Median error between the medoid of the
                  (Ota − Eta )2                                     found cluster and the true location of the videos in
                +                                                   the test set.
                      Eta
where Ota is the number of photos in area a in which tag t
occurs, Ota is the number of photos outside area a in which         other information, resources are assigned to the area con-
tag t occurs, Ota is the number of photos in area a in which        taining the largest number of photos from the training set.
tag t does not occur, and Ota is the number of photos outside       To obtain a reliable estimate of P (t|a), some form of smooth-
area a in which tag t does not occur. Furthermore, Eta is           ing is needed, to avoid a zero probability when x is as-
the number of occurrences of tag t in photos of area a that         sociated with a tag that does not occur with any of the
could be expected if occurrence of t were independent of the        photos in area a from the training set. We have exper-
location in area a, i.e. Eta = N · P (t) · P (a) with N the total   imented with Laplace smoothing, Jelinek-Mercer smooth-
number of photos, P (t) the percentage of photos containing         ing, and Bayesian smoothing with Dirichlet priors, the lat-
tag t and P (a) the percentage of photos that are located in        ter yielding the best results in general (with Jelink-Mercer
area a, i.e.:                                                       producing similar results). These findings conform to ex-
                                                                    perimental results in other areas of information retrieval
                                    |Xa |
                        P (a) = P                            (1)    [17], and to earlier work on georeferencing Flickr photos [14].
                                    b∈A|Xb |                        Specifically, using Bayesian smoothing with Dirichlet priors,
where, for each area a ∈ A, we write Xa to denote the set           we take:
of images from our training set that were taken in area a.                                        “     P
                                                                                                           0 ∈A Ota0
                                                                                                                         ”
Similarly, Eta = N ·P (t)·(1−P (a)), Eta = N ·(1−P (t))·P (a),                            Ota + µ P 0 a P      0   O 0 0
                                                                                P (t|a) =        P a ∈A t ∈V t a
Eta = N · (1 − P (t)) · (1 − P (a)). The vocabulary V was                                       ( t0 ∈V Ot0 a ) + µ
then obtained by taking for each area a, the m tags with
highest χ2 value. In the default configuration of our system,       where, as before, we write Ota for the number of occurrences
the m values are 640 000 for the coarsest clustering, 6 400,        of term t in area a, and V is the vocabulary (after feature
256, 64, 28, 16, 10, 7, 5 for the intermediate resolutions          selection). The parameter µ takes a value in ]0, +∞[ and
and 4 for the finest clustering level. This choice of features      was set to 1750, although good results were found for a large
ensures that the language models, introduced next, require          range of values. The area ax assigned to resource x is then
approximately the same amount1 of space for each clustering         the area maximizing the right-hand side of (2):
level. In Section 6, we will analyze the impact of the choice                                           Y
                                                                                   ax = arg max P (a) ·     P (t|a)           (3)
of the m values.                                                                           a∈A
                                                                                                         t∈x

3. LANGUAGE MODELS                                                  Thus an area is found which is assumed to contain the true
                                                                    location of x. It may be useful to convert this area to a
3.1 Outline                                                         precise location, e.g. for comparison with other methods. To
Given a previously unseen resource x, we try to determine
                                                                    this end, an area a can be represented as its medoid med(a):
in which area x was most likely taken by comparing its tags
with those of the images in the training set. Specifically,
                                                                                                        X
                                                                                    med (a) = arg min      d(x, y)            (4)
using standard generative unigram language modeling, the                                         x∈a
                                                                                                       y∈a
probability of area a, given the tags that are available for
resource x is given by                                              where d(x, y) represents the geodesic distance. Note that the
                                    Y                               medoid is the most central element of an area, rather than
                  P (a|x) ∝ P (a) ·   P (t|a)            (2)        its center-of-gravity. The latter is avoided here because it is
                                     t∈x                            too sensitive to outliers.
where we identify the resource x with its set of tags. The
prior probability P (a) of area a can be estimated using max-       3.2    Experimental results
imum likelihood, as in (1), which means that in absence of          Whether or not (4) provides a good estimation depends on
1                                                                   the number of clusters that are considered. If this number
  Space requirements increase quadratically with the number
of clusters.                                                        is too small, the clusters will be too coarse, and the medoid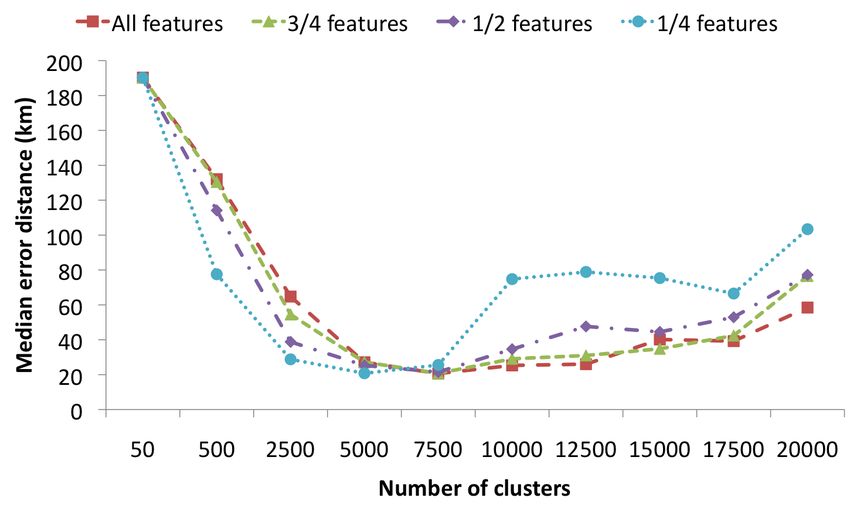
will not be a good approximation of the true location in
general. If this number is too large, however, the chances of
classification error increase. Thus there is a trade-off to be
found, as can clearly be seen in Figure 2. This figure depicts
the median error that was obtained for a variety of clus-
ter sizes, i.e. the median of the geodesic distance between
the medoid of the cluster that was found by (3) and the
true location. The figure reports the results of three exper-
imental set-ups: one experiment considers the 7 400 videos
whose owner appears in our training set (Overlap), one ex-
periment considers the results for these same videos when
the photos from these video owners have been excluded from
the training set (Filtered ), and one experiment considers the
2 600 videos whose owners are distinct from the owners of
the photos in the (complete) training set (Distinct).
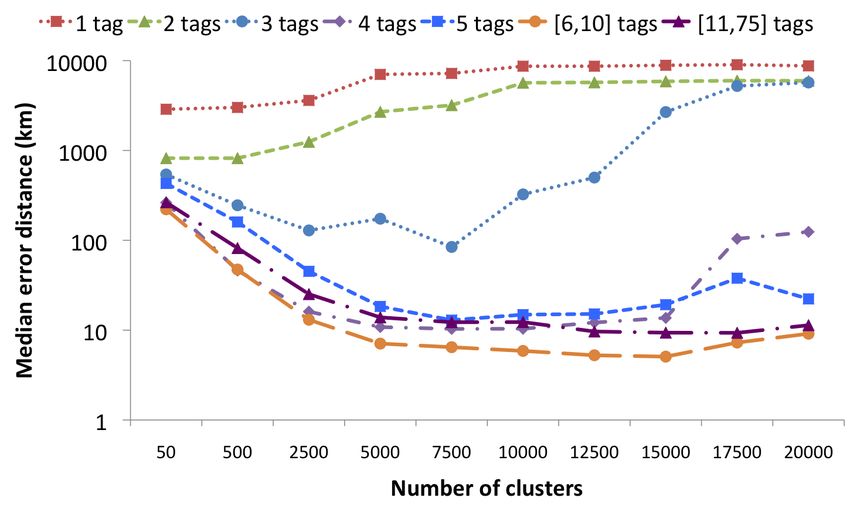
Figure 3: Median error between the medoid of the
Regarding the influence of previously geo-annotated photos found cluster and the true location, each time using
by the same user, the bad performance of the Distinct ex- all test videos containing a given number of tags.
periment is particularly noticeable. Closer inspection of the
results has revealed that the bad results are to a large ex-
tent due to the fact that the videos in the corresponding
test set have less (and less informative) tags. For instance,
while the average number of tags per video is 9.39 for the
Overlap experiment, we only have 5.92 tags on average for
the videos of the Distinct experiment. We may speculate
that users owning a larger number of resources tend to put
more effort in accurately tagging these resources. As the
users of the videos in the Overlap experiment own photos as
well as videos, they are more likely to belong to this latter
category. The Filtered experiment confirms this intuition,
showing that the mere lack of geo-annotated objects by the
same user has a much milder impact, although the optimal
median error is still worse by almost a factor two. This sug-
gests that the number of (good) tags has a much stronger
influence than the presence or absence of geo-annotated ob- Figure 4: Median error between the medoid of the
jects by the same user. To test this hypothesis, we have found cluster and the true location, using only the
separately evaluated those videos that contain a given num- test videos from the Distinct set-up containing a
ber of tags, starting from a combined test set containing all given number of tags.
10 000 videos. The results, which are shown in Figure 3,
clearly show that videos with more tags also tend to contain
more descriptive tags and can therefore be more accurately
localized. However, the results for videos with more than median error of 31.10 km. The lower optimal number of
10 tags are, somewhat surprisingly, worse than those for clusters in the case of Distinct suggests that the less infor-
videos with 6 to 10 tags. This appears to be due to the mative the tags of a given video are, the coarser the cluster-
fact that among the videos with more than 10 tags, many ing should ideally be. This is also confirmed by the results
contain tags that have not been manually added, e.g. taxo- in Figure 3 which show the optimal number of clusters to be
nomy:phylum=chordata. In particular, we found that 9.25% 50 for photos with 1 tag (2876.46 km), 500 for photos with
of all tag occurrences contain a ‘:’ in the [11,75] category, 2 tags (820.61 km), 7 500 for photos with 3 (84.33 km), 4
as opposed to 0.45% in the [6,10] category. Clearly, the as- (10.32 km), or 5 (12.92 km) tags, 15 000 for photos with 6
sumption that the number of tags provides an indication of to 10 tags (5.07 km), and 17 500 for photos with more than
how much effort the user has spent to describe the video 10 tags (9.33 km).
no longer applies when tags are added automatically. Fig-
ure 4 shows that the same conclusions can be drawn, when
restricted to the videos from the Distinct set-up, providing 4. SIMILARITY SEARCH
evidence that it is indeed the lack of appropriate tags that
cause the overall results of the Distinct and Overlap config- 4.1 Outline
urations to be so different.
Rather than converting the problem at hand to a classifica-
tion problem, a more direct strategy to find the location of
For the Overlap experiment, the optimal median error of
a photo or video x consists of identifying the photos from
17.02 km is obtained when using 7 500 clusters, for the Dis-
the training set that are most similar to x, and estimate the
tinct experiment, the optimal median error of 979.86 km is
location of x by averaging these locations. Specifically, let
obtained when using 500 clusters, and for the Filtered exper-
y1 , ..., yk be the k most similar photos from our training set.
iment, we again need 7 500 clusters to obtain the optimal
We then propose to estimate the location of x as a weighted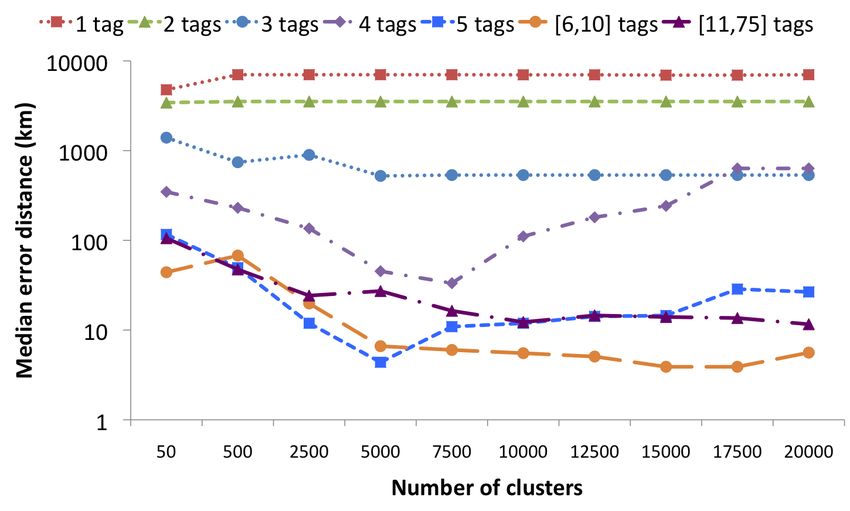
center-of-gravity of the locations of y1 , ..., yk :
                                                                        Table 1: Influence of the similarity threshold on the
                          k                                             median error distance for the Overlap configuration
                       1X
              loc(x) =       sim(x, yi )α · loc(yi )             (5)    (using an exponent α of 1).
                       k i=1
                                                                               threshold   0    0.05 0.10 0.15 0.20
where the parameter α ∈]0, +∞[ determines how strongly                              1      2528    2528   2528   2528    2528
the result is influenced by the most similar photos only. The                       2       477     424    477    773    1150
similarity sim(x, yi ) between resources x and yi was quan-                         3       685     604    662    880    1150
tified using the Jaccard measure:                                                   4       748     741    773    899    1181
                                                                                    5       790     821    835    952    1242
                                       |x ∩ y|                                k
                      sjacc (x, y) =                                                6       824     799    837    954    1238
                                       |x ∪ y|                                      7       808     823    850    961    1247
where we identify a resource with its set of tags without                           8       843     829    856    980    1246
feature selection. In principle, Jaccard similarity may be                          9       855     856    871    971    1242
combined with other types of similarity, e.g. based on visual                      10       863     868    872    968    1243
features.

In (5), locations are assumed to be represented as Cartesian            Table 2: Influence of the exponent α on the median
(x, y, z) coordinates rather than as (lat, lon) pairs2 . In prac-       error distance for the Overlap configuration (using
tice, we thus need to convert the (lati , loni ) coordinates of         a similarity threshold of 0.05).
each photo yi to its Cartesian coordinates:                                        α    1      25     50 75    100
                                                                                    1 2528 2528 2528 2528 2528
                    xi = cos(lati ) · cos(loni )                                    2  424    343    341 341   341
                    yi = cos(lati ) · sin(loni )                                    3  604    435    413 411   410
                    zi = sin(lati )                                                 4  741    417    383 370   370
                                                                                    5  821    410    368 350   349
                                                                                 k
Subsequently, the right-hand side of (5) is evaluated, yield-                       6  799    419    399 395   393
ing a point (x∗ , y ∗ , z ∗ ), which is usually not on the surface of               7  823    422    400 395   395
the earth. Unless this point is exactly the center of the earth,                    8  829    440    427 420   419
its latitude lat∗ and longitude lon∗ can be determined:                             9  856    459    450 441   440
                                                                                   10 868     475    459 451   449
                 lat∗ = atan2(z ∗ , x∗2 + y ∗2 )
                                        p

                 lon∗ = atan2(y ∗ , x∗ )
                                                                        may be influenced by outliers, and the more important it
In addition to the choice of the parameter α, the perfor-               thus becomes to avoid them. Surprisingly, small values of k
mance of (5) depends on the set of resources Rx that is con-            appear to be better than larger values, although the optimal
sidered when determining the k most similar photos y1 , ..., yk .       choice k = 2 is substantially better than k = 1.
In principle, we could take Rx to be the entire training set.
However, we also experiment with putting a threshold on                 Tables 2 illustrates the influence of varying the exponent
the similarity with x, considering in Rx only those resources           α in (5), where we take the similarity threshold fixed at
that are sufficiently similar. This restriction is motivated            0.05. Choosing a higher value of α essentially serves the
by the fact that center-of-gravity methods are sensitive to             same purpose as choosing a higher similarity threshold, i.e.
outliers. Note that using medoids to alleviate the influence            reducing the impact of potential outliers on the result. We
of outliers is not appropriate when the number of points is             can observe that higher values of α tend to produce better
small. Also note that as a result of this restriction, some-            results. Again the choice of k = 2 turns out to be optimal.
times less than k similar photos may be used. In each case
Rx will contain the most similar photo, even if its similarity          In general, it seems that similarity search performs a lot
is below the threshold. Other photos are added only if they             worse than the language models, yielding an optimal error
are sufficiently similar.                                               of 340.69 km, as opposed to 17.02 km in the case of language
                                                                        models. Similar effects are witnessed for the Distinct and
4.2    Experimental results                                             Filtered configurations (not shown), where we respectively
Three parameters influence the performance of the similarity            find an optimal error of 1302.95 km (instead of 979.86 km)
search: the threshold on the similarity with the object to              and 578.22 km (instead of 31.10 km). However, as we will
be classified, the number k of similar photos to consider,              see in the next section, when combined with the language
and the exponent α in (5). Table 1 displays the result for              models, similarity search may be of great value.
different choices of the threshold on similarity, and different
values of k, in case of the Overlap configuration. Regarding            5. A HYBRID APPROACH
the similarity threshold, we find that a small threshold of             5.1 Outline
0.05 slightly improves the results for the smaller values of            The two methods that have been presented in the previous
k. Indeed, the smaller the value of k, the more the result              sections can be combined in a natural way: first an area
2
 See http://www.geomidpoint.com/calculation.html for                    is determined using the language modeling approach from
a comparison with alternative methods to calculate “average             Section 3 and then the similarity based method from Sec-
locations”.                                                             tion 4 is applied, but restricted to the photos in the found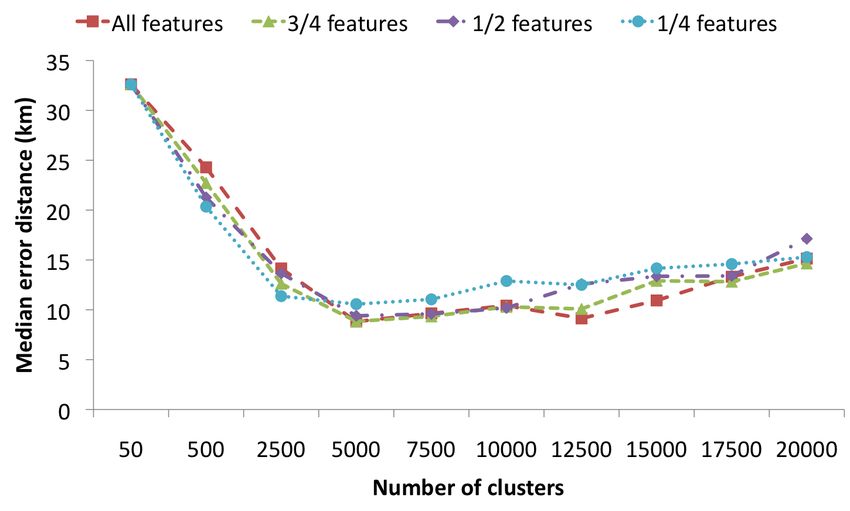
Figure 5: Median error obtained using the hybrid                  Figure 6: Median error between the medoid of the
method with k = 1 and without a similarity thresh-                found cluster and the true location, each time using
old.                                                              all test videos containing a given number of tags.

Table 3: Number of the test videos for which the
location that was found is within a given distance of
the true location.
                   1km 5km 10km 50km 100km
  Overlap (7 400) 2135 3362 3773       4500    4694
  Distinct (2 600) 465   803    903    1066    1128
  Filtered (7 400) 1428 2770 3248      4012    4265

area. When no photo in the clustering satisfies the chosen
similarity threshold, the medoid of the found cluster can be
used instead. Thus, we may take advantage of the language
modeling’s ability to implicitly discriminate between occur-
rences of more and less important tags, while keeping the
advantage of the similarity search that a precise coordinate      Figure 7: Median error between the medoid of the
is obtained.                                                      found cluster and the true location, using only the
                                                                  test videos from the Distinct set-up containing a
A second extension is related to choosing the right number        given number of tags.
of clusters. In particular, when we discover that a given re-
source has no tag in common with the vocabulary of the cho-
sen clustering, we fall-back to the next (coarser) clustering.3   ated. As a result, the positive effect of filtering photos that
In this way, if a resource contains no tags that are indicative   are not sufficiently similar becomes counter-productive. A
of a precise location (e.g. eiffeltower ) but does contain some   more detailed analysis of the results is presented in Table
tags that define a larger-scale area (e.g. france), it may not    3. For all three set-ups, a marked improvement is witnessed
have any tags in common with the vocabulary of the finest         over the results of the language models from Section 3, the
clusterings, but after falling-back to a coarser clustering, a    optimal results now being attained for 5 000 clusters in the
suitable area can still be determined.                            case of the Overlap (8.82 km) and Distinct (633.36 km) set-
                                                                  ups, and for 7 500 clusters in the case of the Filtered (20.64
                                                                  km) set-up.
5.2    Experimental results
Figure 5 shows the median distance that is obtained when          Figures 6 and 7 provide a more detailed picture of the perfor-
language models are combined with similarity search. In-          mance of our method, considering all test videos and those
terestingly, we find that choosing k = 1 with similarity          from the Distinct set-up respectively. As in Section 3, we
threshold 0 (shown in Figure 5) performs slightly better than     find that the bad performance in the Distinct set-up can be
choosing k = 2 with similarity threshold 0.05 (not shown),        attributed to the fewer number of videos with sufficient tags.
despite that the latter configuration is clearly better when      In particular, if we only consider those videos with 6 to 10
similarity search is applied alone. This can be explained by      tags (21.77% of the test videos), a median distance of 3.90
the fact that within a cluster, all photos are relatively close   km is attained when using either 15 000 or 17 500 clusters.
to each other anyway, hence the problem of outliers is allevi-    In case of the Overlap experiment (not shown), the median
3
  Recall that in absence of any tags, without fall-back, the      distance in the [6,10] range (23.19% of the test videos) is
prior probabilities determine to which cluster a resource is      only slightly better, with 3.54 km being attained when us-
assigned, hence the cluster containing the largest number of      ing 10 000 clusters. These results indicate that rather precise
resources will be chosen.                                         coordinates can be found for most videos, provided that a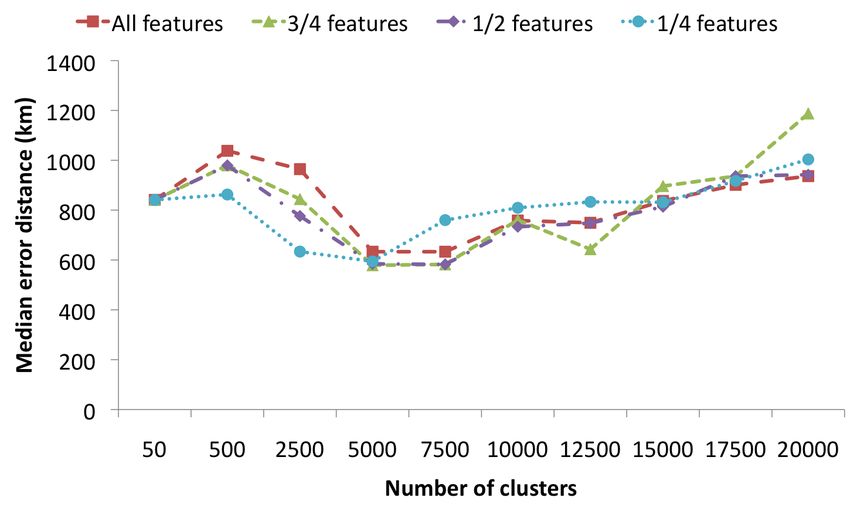
Figure 8: Impact of the amount of feature selection,              Figure 10: Impact of the amount of feature selection,
in case of the Overlap set-up                                     in case of the Filtered set-up

                                                                  gained in popularity. A recent benchmark evaluation of this
                                                                  task was carried out at MediaEval 2010 [8], where an earlier
                                                                  version of our system was shown to substantially outperform
                                                                  all other approaches. This result confirms and strengthens
                                                                  earlier support for using language models in this task [14].

                                                                  Most existing approaches are based on clustering, in one way
                                                                  or another, to convert the task into a classification problem.
                                                                  For instance, in [3] target locations are determined using
                                                                  mean shift clustering, a non-parametric clustering technique
                                                                  from the field of image segmentation. To assign locations to
                                                                  new images, both visual (keypoints) and textual (tags) fea-
                                                                  tures were used. Experiments were carried out on a sample
                                                                  of over 30 million images, using both Bayesian classifiers and
Figure 9: Impact of the amount of feature selection,
                                                                  linear support vector machines, with slightly better results
in case of the Distinct set-up
                                                                  for the latter. Two different resolutions were considered cor-
                                                                  responding to approximately 100 km (finding the correct
                                                                  metropolitan area) and 100 m (finding the correct land-
sufficient number of (manually chosen) tags are available.
                                                                  mark). It was found that visual features, when combined
                                                                  with textual features, substantially improve accuracy in the
Finally we analyze the impact of feature selection. The pur-
                                                                  case of landmarks. In [5], an approach is presented which
pose of feature selection is to eliminate all tags that are
                                                                  is based purely on visual features. For each new photo, the
not spatially relevant, before the language models are built.
                                                                  120 most similar photos with known coordinates are deter-
This may be useful not only for speeding up calculations,
                                                                  mined. This weighted set of 120 locations is then interpreted
but also to improve classification accuracy. Figures 8, 9 and
                                                                  as an estimate of a probability distribution, whose mode is
10 display how choosing a different number of features im-
                                                                  determined using mean-shift clustering. The resulting value
pacts the median error distance. The results for all features
                                                                  is used as prediction of the image’s location.
refers to the set of features that have been used in the exper-
iments throughout the paper, applying χ2 feature selection
                                                                  Next, [14] investigates the idea that when georeferencing im-
as explained in Section 2. The other results show what hap-
                                                                  ages, the spatial distribution of the classes (areas) could be
pens when only the best 25%, 50% and 75% of these features
                                                                  utilized to improve accuracy. Their starting point is that
(according to the χ2 statistic) are retained. The main ob-
                                                                  typically, not only the correct area will receive a high prob-
servation is that the optimal value is quite robust w.r.t. the
                                                                  ability, but also the areas surrounding the correct area. An
number of selected features. Only when a suboptimal num-
                                                                  appropriate adaptation of the standard language modeling
ber of clusters is chosen we find some differences, favoring
                                                                  approach is shown to yield a small, but statistically signifi-
fewer features for the coarser clusterings.
                                                                  cant improvement.

6.   RELATED WORK
The related work falls in two categories: finding the geogra-     Using locations of tagged photos. When available, the
phic scope of resources, and using it when it is available.       coordinates of a photo may be useful for a variety of pur-
                                                                  poses. In [1], for instance, coordinates of tagged photos are
                                                                  used to find representative textual descriptions of different
Finding locations of tagged photos. The task of deriving          areas of the world. These descriptions are then put on a map
geographic coordinates for multimedia objects has recently        to assist users in finding images that were taken in a given
location of interest. The approach is based on spatially clus- 8. REFERENCES
tering a set of geotagged Flickr images, using k-means, and [1] S. Ahern, M. Naaman, R. Nair, and J. H.-I. Yang.
then relying on (an adaptation of) tf-idf weighting to find World explorer: visualizing aggregate data from
the most prominent tags of a given area. Similarly, [9] looks unstructured text in geo-referenced collections. In
at the problem of suggesting useful tags, based on available Proceedings of the 7th ACM/IEEE-CS Joint
coordinates. Some authors have looked at using geographic Conference on Digital Libraries, pages 1–10, 2007.
information to help diversify image retrieval results [7, 10]. [2] M. Ames and M. Naaman. Why we tag: motivations
for annotation in mobile and online media. In
Geotagged photos are also useful from a geographic per- Proceedings of the SIGCHI Conference on Human
spective, to better understand how people refer to places, Factors in Computing Systems, pages 971–980, 2007.
and overcome the limitations and/or costs of existing map- [3] D. J. Crandall, L. Backstrom, D. Huttenlocher, and
ping techniques [4]. For instance, by analyzing the tags of J. Kleinberg. Mapping the world’s photos. In
georeferenced photos, Hollenstein [6] found that the city to- Proceedings of the 18th International Conference on
ponym was by far the most essential reference type for spe- World Wide Web, pages 761–770, 2009.
cific locations. Moreover, [6] provides evidence suggesting [4] M. Goodchild. Citizens as sensors: the world of
that the average user has a rather distinct idea of specific volunteered geography. GeoJournal, 69:211–221, 2007.
places, their location and extent. Despite this tagging be- [5] J. H. Hays and A. A. Efros. IM2GPS: Estimating
haviour, Hollenstein concluded that the data available in geographic information from a single image. In Proc.
the Flickr database meets the requirements to generate spa- Computer Vision and Pattern Recognition, 2008.
tial footprints at a sub-city level. Finding such footprints
[6] L. Hollenstein and R. Purves. Exploring place through
for non-administrative regions (i.e. regions without officially
user-generated content: Using Flickr to describe city
defined boundaries) using georeferenced resources has also
cores. Journal of Spatial Information Science,
been addressed in [13] and [15]. Another problem of interest
1(1):21–48, 2010.
is the automated discovery of which names (or tags) cor-
respond to places. Especially for vernacular place names, [7] L. Kennedy and M. Naaman. Generating diverse and
which typically do not appear in gazetteers, collaborative representative image search results for landmarks. In
tagging-based systems may be a rich source of information. Proceeding of the 17th International Conference on
In [11], methods based on burst-analysis are proposed for World Wide Web, pages 297–306, 2008.
extracting place names from Flickr. [8] M. Larson, M. Soleymani, P. Serdyukov, V. Murdock,
and G. Jones, editors. Working Notes of the
MediaEval Workshop, http://www.multimediaeval.
7. CONCLUDING REMARKS org/mediaeval2010/2010worknotes/, 2010.
We have advocated a two-step approach for georeferencing
[9] E. Moxley, J. Kleban, and B. Manjunath. Spirittagger:
tagged multimedia objects. In the first step, the task of find- a geo-aware tag suggestion tool mined from Flickr. In
ing suitable geographic coordinates is treated as a classifi- Proceeding of the 1st ACM International Conf. on
cation problem, where the classes are areas that have been
Multimedia Information Retrieval, pages 24–30, 2008.
obtained by clustering the locations of the objects in the
[10] A. Popescu and I. Kanellos. Creating visual
training set. Once the most likely area has been identi-
summaries for geographic regions. In IR+SN
fied, we determine a precise location by interpolating the
Workshop (at ECIR), 2009.
locations of the most similar objects, in that area. Experi-
mental results confirm the usefulness of this hybrid method- [11] T. Rattenbury and M. Naaman. Methods for
ology. We have also analysed the influence of previously extracting place semantics from flickr tags. ACM
geo-annotated resources by the same user, and found that, Transactions on the Web, 3(1):1–30, 2009.
while the availability of such resources in the training set [12] P. Schmitz. Inducing ontology from Flickr tags. In
positively influences the performance, the difference in per- Proceedings of the Collaborative Web Tagging
formance all but disappears if a sufficient number of tags is Workshop, pages 210–214, 2006.
available for that resource. [13] S. Schockaert and M. De Cock. Neighborhood
restrictions in geographic IR. In Proc. ACM SIGIR,
We have experimented with several gazetteers (Geonames, pages 167–174, 2007.
DBpedia, and the US and world sets of USGS/NGA), but [14] P. Serdyukov, V. Murdock, and R. van Zwol. Placing
have not been able to improve our results. On the other Flickr photos on a map. In Proc. ACM SIGIR, pages
hand, preliminary analyses that use an oracle for disam- 484–491, 2009.
biguating toponyms show that using gazetteers together with [15] F. Wilske. Approximation of neighborhood boundaries
our current method has the potential of reducing the median using collaborative tagging systems. In Proceedings of
distance considerably. It thus remains unclear whether (or the GI-Days, pages 179–187, 2008.
how) such resources could be useful for this task. In addition [16] F. Wu and D. Weld. Automatically refining the
to gazetteers, other types of information could be taken into Wikipedia infobox ontology. In Proceeding of the 17th
account, which we have not examined, including visual fea- International Conference on World Wide Web, pages
tures and information about the profile and social network 635–644, 2008.
of the corresponding user. [17] C. Zhai and J. Lafferty. A study of smoothing
methods for language models applied to information
retrieval. ACM Transactions on Information Systems,
Acknowledgments. We thank Johannes Deleu for interest- 22(2):179–214, 2004.
ing discussions on the use of gazetteers.You can also read