VIGOR: Cross-View Image Geo-localization beyond One-to-one Retrieval
←
→
Page content transcription
If your browser does not render page correctly, please read the page content below
VIGOR: Cross-View Image Geo-localization beyond One-to-one Retrieval

                                                                         Sijie Zhu, Taojiannan Yang, Chen Chen
                                              Department of Electrical and Computer Engineering, University of North Carolina at Charlotte
                                                                                  {szhu3, tyang30, chen.chen}@uncc.edu
arXiv:2011.12172v2 [cs.CV] 22 Mar 2021

                                                                   Abstract                                      in cross-view geo-localization [24, 22, 7, 17, 29, 21], which
                                                                                                                 uses GPS-tagged aerial-view images as reference for street-
                                             Cross-view image geo-localization aims to determine the             view queries. However, the performance may suffer from a
                                         locations of street-view query images by matching with                  large view or appearance gap between query and reference
                                         GPS-tagged reference images from aerial view. Recent                    images.
                                         works have achieved surprisingly high retrieval accuracy                    Recent works [7, 17, 29] have shown that the perfor-
                                         on city-scale datasets. However, these results rely on the              mance of cross-view image matching can be significantly
                                         assumption that there exists a reference image exactly cen-             improved by feature aggregation and sample mining strate-
                                         tered at the location of any query image, which is not ap-              gies. When the orientation of street-view (or ground-view)
                                         plicable for practical scenarios. In this paper, we redefine            image is available (provided by phone-based compass),
                                         this problem with a more realistic assumption that the query            state-of-the-art methods can achieve a top-1 retrieval accu-
                                         image can be arbitrary in the area of interest and the refer-           racy over 80% [17], which shows the possibility of accu-
                                         ence images are captured before the queries emerge. This                rate geo-localization in real-world settings. However, ex-
                                         assumption breaks the one-to-one retrieval setting of exist-            isting datasets [24, 27, 11] simply assume that each query
                                         ing datasets as the queries and reference images are not                ground-view image has one corresponding reference aerial-
                                         perfectly aligned pairs, and there may be multiple refer-               view image whose center is exactly aligned at the location
                                         ence images covering one query location. To bridge the                  of the query image. We argue this is not practical for real-
                                         gap between this realistic setting and existing datasets, we            world applications, because the query image can occur at
                                         propose a new large-scale benchmark –VIGOR– for cross-                  arbitrary locations in the area of interest and the reference
                                         View Image Geo-localization beyond One-to-one Retrieval.                images should be captured before the queries emerge. In
                                         We benchmark existing state-of-the-art methods and pro-                 this case, perfectly aligned one-to-one correspondence is
                                         pose a novel end-to-end framework to localize the query                 not guaranteed.
                                         in a coarse-to-fine manner. Apart from the image-level re-
                                                                                                                    In light of the novelty of this problem, we propose
                                         trieval accuracy, we also evaluate the localization accuracy
                                                                                                                 a new benchmark (VIGOR) to evaluate cross-view geo-
                                         in terms of the actual distance (meters) using the raw GPS
                                                                                                                 localization in a more realistic setting. Briefly, given an area
                                         data. Extensive experiments are conducted under differ-
                                                                                                                 of interest (AOI), the reference aerial images are densely
                                         ent application scenarios to validate the effectiveness of the
                                                                                                                 sampled to achieve a seamless coverage of the AOI and the
                                         proposed method. The results indicate that cross-view geo-
                                                                                                                 street-view queries are captured at arbitrary locations. In
                                         localization in this realistic setting is still challenging, fos-
                                                                                                                 total, 90, 618 aerial images and 238, 696 street panoramas
                                         tering new research in this direction. Our dataset and code
                                                                                                                 are collected from 4 major cities in the United States (see
                                         will be released at https://github.com/Jeff-
                                                                                                                 details in Sec. 3). The new dataset gives rise to two funda-
                                         Zilence/VIGOR
                                                                                                                 mental differences between this work and prior research.
                                                                                                                    Beyond One-to-one: Previous research mainly focuses
                                         1. Introduction                                                         on the one-to-one correspondence because existing datasets
                                                                                                                 consider perfectly aligned image pairs as default. However,
                                             The objective of image-based geo-localization is to de-             VIGOR enables us to explore the effect of reference sam-
                                         termine the location of a query image by finding the most               ples that are not centered at the locations of queries but still
                                         similar image in a GPS-tagged reference database. Such                  cover the query area. As a result, there could be multiple
                                         technologies have proven useful for accurate localization               reference images partially covering the same query loca-
                                         with noisy GPS signals [4, 26] and navigation in crowded                tion, breaking the one-to-one correspondence. In our geo-
                                         cities [12, 9]. Recently, there has been a surge of interest            localization method, we design a novel hybrid loss to take

                                                                                                             1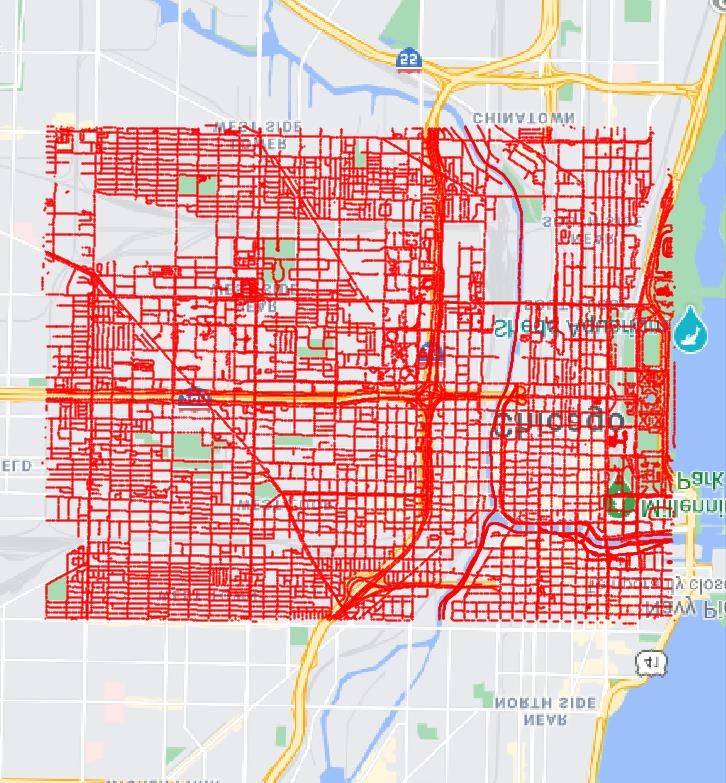
advantage of multiple reference images during training.              consists of aligned panoramas and aerial images with ori-
    Beyond Retrieval: Image retrieval can only provide               entation information. It has 35, 532 image pairs for training
image-level localization. Since the center alignment is not          and 92, 802 pairs for testing. In a nutshell, all these datasets
guaranteed in our dataset, after the retrieval, we further           consider one-to-one retrieval and none of them provide raw
employ a within-image calibration to predict the offset of           GPS data for localization evaluation in terms of meters.
the query location inside the retrieved image. Therefore,            Cross-view Geo-localization. Early works [10, 25, 24, 22]
the proposed joint-retrieval-and-calibration framework pro-          of cross-view geo-localization suffer from low retrieval ac-
vides a coarse-to-fine localization. The whole pipeline is           curacy mainly because of the significant appearance gap be-
end-to-end, and the inference is fast as the offset prediction       tween two views and poor metric learning techniques. With
shares the feature descriptors with the retrieval task. More-        tailored feature extractors and a modified loss function, Hu
over, our dataset is also accompanied with raw GPS data.             et al. [7] show the possibility of achieving accurate localiza-
Thus a more direct performance assessment, i.e. localiza-            tion with end-to-end deep neural networks. Several recent
tion accuracy in terms of real-world distance (e.g. meters),         methods [14, 17] aim to reduce the domain gap by lever-
can be achieved on our dataset.                                      aging GANs [6] and polar transformations [18]. Regmi et
    Our main contributions can be summarized as follows:             al. [14] propose to generate the synthetic aerial-view image
• We introduce a new dataset for the problem of cross-view           from the ground-view query with a conditional GAN and
   image geo-localization. This dataset, for the first time,         adopt feature fusion to achieve better performance. SAFA
   allows one to study this problem under a more realistic           [17] further takes advantage of the geometric prior knowl-
   and practical setting and offers a testbed for bridging the       edge by applying a polar transformation on the query image
   gap between current research and practical applications.          and replacing the global pooling with feature aggregation
• We propose a novel joint-retrieval-and-calibration frame-          blocks. The top-1 accuracy of [17] on CVUSA [27] is al-
   work for accurate geo-localization in a coarse-to-fine            most 90% if the orientation information is given. Other ap-
   manner, which has not been explored in the past.                  proaches [5, 29] exploring metric learning techniques (e.g.
• We develop a new hybrid loss to learn from multiple ref-           hard samples mining strategy) also show promising results
   erence images during training, which is demonstrated to           on popular datasets, and they are not restricted by the geo-
   be effective in various experimental settings.                    metric assumptions. However, none of these methods con-
• We also validate the potential of the proposed cross-view          sider a sub-image level localization beyond the image-level
   geo-localization framework in a real-world application            retrieval or multiple reference images for training.
   scenario (assistive navigation) by simulating noisy GPS.
                                                                     3. VIGOR Dataset
2. Related Work
                                                                     Problem Statement. Given an area of interest (AOI), our
Cross-view Datasets. A number of datasets have been                  objective is to localize an arbitrary street-view query in this
proposed for cross-view geo-localization [10, 25, 24, 27,            area by matching it with aerial reference images. To guar-
22, 11]. Lin et al. [10] consider both satellite images and          antee that any possible query is covered by at least one ref-
land cover attributes for cross-view geo-localization. 6, 756        erence image, the reference aerial images must provide a
ground-view images and 182,988 aerial images are col-                seamless coverage of the AOI. As shown in Fig. 1 (a),
lected from Charleston, South Carolina. Although the aerial          coarsely sampled reference images (black square boxes) are
images are densely sampled, they force a one-to-one cor-             not able to provide full coverage of the AOI, and an arbitrary
respondence between two views and evaluation in terms                query location (the red star) may lie in the area between
of distance is not available. The original CVUSA [25] is             reference samples. Even if the query location (the yellow
a massive dataset containing more than 1 million ground-             star) lies at the edge of a reference aerial image, this refer-
level and aerial images from multiple cities in the United           ence image only shares partial (at most half) scene with the
States. Zhai et al. [27] further make use of the camera’s            one whose center is at the query location, which may not
extrinsic parameters to generate aligned pairs by warping            provide enough information to be distinguished from other
the panoramas, resulting in 35,532 image pairs for train-            negative reference images. These queries can be covered by
ing and 8,884 image pairs for testing. This version of               adding additional overlapping samples (the green box). As
CVUSA is the most widely used dataset in recent research             shown in Fig. 1 (b), if query locations (red stars) lie at the
[7, 17, 29, 14, 23] and we refer to it as CVUSA if not speci-        central area (the black dotted box) of the L × L aerial im-
fied. Vo [24] consists of about one million image pairs from         age, the query and reference images are defined as positive
11 cities in the United States. The authors randomly col-            samples for each other. Other queries (blue stars) outside
lect street-view panoramas and generate several crops from           the central area are defined as semi-positive samples. To
each panorama along with spatially aligned aerial images             guarantee that any arbitrary query has one positive reference
from Google Maps. Similar to CVUSA, CVACT [11] also                  image, we propose to densely sample the aerial images with

                                                                 2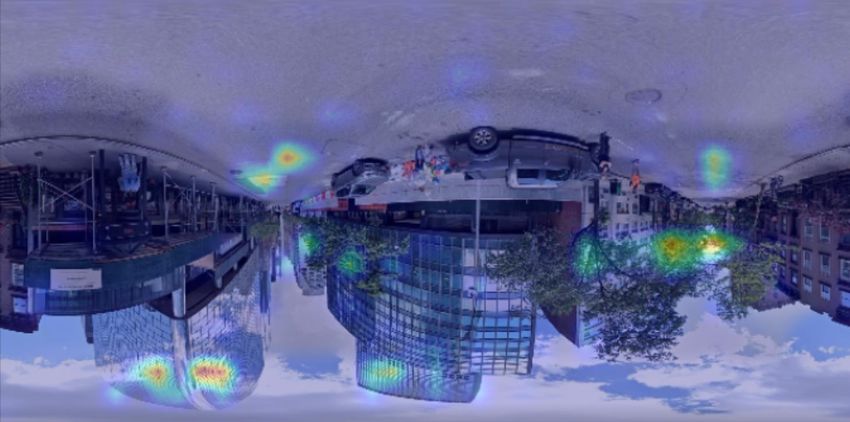
Positive
Positive reference
Non-overlap
IOU ϵ [0.39, 1.0]
IOU=9/23
Aligned reference
L L/2
L/4
Semi-Positive
Semi-positive
Overlap
IOU=1/7
IOU ϵ [0.14, 0.39]
L L/2
L/2
(a) Non-overlap vs Overlap Sampling (b) Positive vs Semi-positive (c) Aligned (R) vs Positive (G) vs Semi-positive (B) (d) Positive vs Semi-positive IOU
Figure 1. The sampling strategy of the proposed dataset. The stars denote the query locations.
180° 0° 90° 180° 270° 360°
50% overlap along both latitude and longitude directions as
demonstrated in Fig. 1 (c). By doing so, any arbitrary query
location (the red star) in the AOI is covered by four refer- 90° 270°
ence images (size L × L). The green box denotes the pos-
itive reference and the other three semi-positive references
are denoted as blue boxes. The positive reference is consid- 0°
ered as ground-truth, because it has the nearest GPS to the
query and contains the most shared objects with the query
image. The red box denotes the perfectly aligned aerial im-
age. Based on the definitions of positive and semi-positive
as illustrated in Fig. 1 (b), we can easily see that all positive
reference images have an IOU (Intersection Over Union) Figure 3. An example of positive samples (stars) and the orienta-
greater than 0.39 with the perfectly aligned reference (see tion correspondence between aerial and ground views. The yellow
Fig. 1 (d)). The IOU of a typical positive sample (offset rel- bar indicates North.
ative to the center equals to (± L8 , ± L8 )) is 0.62. The IOU
between the semi-positive samples and the aligned refer- image has no more than 2 positive panoramas (see Fig. 3,
ence falls in [ 17 ≈ 0.14, 23
9
≈ 0.39]. the distributions are included in the supplementary mate-
rial). This procedure results in 105, 214 panoramas for the
geo-localization experiments. Also, around 4% of the aerial
images cover no panoramas. We keep them as distraction
samples to make the dataset more realistic and challenging.
The zoom level for satellite images is 20 and the ground res-
olution is around 0.114 m. The raw image sizes for aerial-
view and ground-view are 640 × 640 and 2048 × 1024, re-
Manhattan Chicago San Francisco Seattle spectively. Industrial-grade GPS tags for both aerial-view
Figure 2. Aerial image coverage (black polygon) in four cities and and ground-view images are provided for meter-level eval-
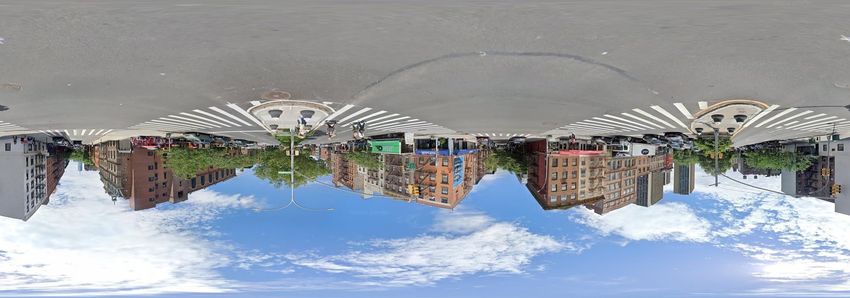
the distributions of panoramas (red dots). uation. The panoramas are then shifted according to the ori-
entation information so that North lies in the middle. Fig. 3
Data Collection. As shown in Fig. 2, we collect 90, 618 shows an example of orientation correspondence between a
aerial images covering the central areas of four cities, i.e. pair of aerial and street-view images.
New York City (Manhattan), San Francisco, Chicago, and Head-to-head Comparison. Table 1 shows a compari-
Seattle, as the AOI using the Google Maps Static API [2]. son between our dataset and previous benchmarks. The
Then 238, 696 street-view panorama images are collected most widely used dataset, CVUSA [27], consists of im-
with the Google Street-View Static API [1] at zoom level 2 ages mainly collected at suburban areas. Our dataset, on the
on most of the streets. All the GPS locations of panorama other hand, is collected for urban environments. In prac-
images are unique in our dataset, and the typical interval tice, the GPS signal is more likely to be noisy in urban ar-
between samples is about 30 m. We perform data balanc- eas than suburban (e.g. the phone-based GPS error can be
ing on the original panoramas to make sure that each aerial up to 50 meters in Manhattan [4]). Therefore, our dataset
3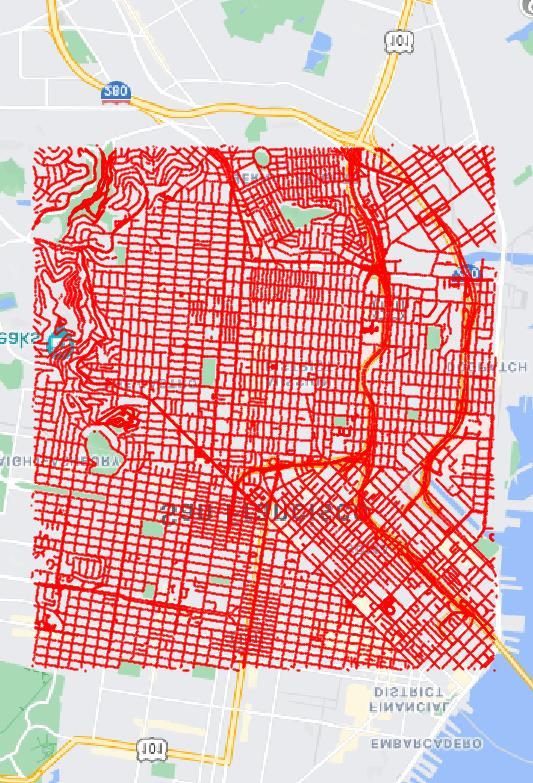
Vo [24]     CVACT [11] CVUSA [27] VIGOR (proposed)
           Satellite images                          ∼ 450, 000     128, 334          44, 416             90, 618
           Panoramas in total                        ∼ 450, 000     128, 334          44, 416            238, 696
           Panoramas after balancing                      -             -                 -              105, 214
           Street-view GPS locations                   Aligned       Aligned          Aligned            Arbitrary
           Full panorama                                 No            Yes               Yes                Yes
           Multiple cities                               Yes           No                Yes                Yes
           Orientation information                       Yes           Yes               Yes                Yes
           Evaluation in terms of meters                 No            No                No                 Yes
           Seamless coverage on area of interest         No            No                No                 Yes
           Number of references covering each query       1             1                 1                  4
           Table 1. Comparison between the proposed VIGOR dataset and existing datasets for cross-view geo-localization.

has more potential application scenarios, e.g. vision-based          available for training, the cross-area transfer is necessary.
mobile assistive navigation. Besides, urban areas are more           For this setting, all the images from New York and Seattle
crowded with tall buildings. The mutual semantics between            are used for training, and images from San Francisco and
ground and aerial views are significantly reduced by occlu-          Chicago are held out for evaluation.
sions and shadows, making our dataset more challenging
than CVUSA. Furthermore, previous datasets simply adopt              4. Coarse-to-fine Cross-view Localization
one-to-one retrieval for evaluation, which is not the case of
real-world scenarios, because it is impossible to predict the           In this section, we propose a joint-retrieval-and-
location of an arbitrary query and capture an aligned refer-         calibration framework for geo-localization in a coarse-to-
ence image there beforehand. Our dataset considers arbi-             fine manner. Sec. 4.1 introduces a strong baseline built
trary query locations, and even the ground-truth reference           with state-of-the-art techniques based on only the positive
image does not have the same GPS location as the query;              samples. Sec. 4.2 proposes an IOU-based semi-positive
thus it is more realistic but challenging for retrieval. Our         assignment loss to leverage the supervision information of
dataset also provides the raw GPS data for meter-level eval-         semi-positive samples. With the retrieved best matching
uation which is the ultimate goal of localization applica-           reference image, Sec. 4.3 aims to estimate the offset of the
tions. We believe that our dataset is a great complement to          query GPS location relative to the center of the retrieved
the existing cross-view image datasets, and can be served as         aerial-view image as a meter-level calibration.
a testbed for bridging the gap between current research and          4.1. Baseline Framework
practical applications.
                                                                         To achieve satisfactory results on the proposed dataset,
                    Same-Area                Cross-Area              it is important to adopt state-of-the-art techniques to build
                  Number City Number                  City           a strong baseline. Therefore, we employ the feature aggre-
        Aerial     90,618     All      44,055    New York            gation module of SAFA (spatial-aware feature aggregation)
 Train
        Street     52,609     All      51,520    Seattle             [17] with the global negative mining strategy from [29].
        Aerial     90,618     All      46,563    San Francisco       Feature Aggregation. SAFA [17] is a combination of po-
 Test
        Street     52,605     All      53,694    Chicago             lar transformation, Siamese backbone and feature aggrega-
    Table 2. The evaluation splits of VIGOR in two settings.         tion blocks. However, the polar transformation assumes that
                                                                     the ground-view GPS is at the center of the corresponding
The Evaluation Protocol. We design two evaluation set-               aerial-view reference image, which does not apply in our
tings for the experiments, i.e. same-area and cross-area eval-       case. Therefore, we only adopt the feature aggregation in
uation, according to different application scenarios.                our framework (see Fig. 4). The main idea of the feature
Same-area: If one plans to build an aerial-view reference            aggregation block is to re-weight the embeddings in accor-
database for arbitrary street queries in an AOI, the goal of         dance with their positions. The spatial-aware block pro-
model training is to handle arbitrary new queries. There-            vides a significant performance gain when the orientation
fore, the best solution would be collecting GPS-tagged               information of query images is available.
queries in the same area for training rather than training in        Mining Strategy. Metric learning literature [15, 20, 13]
other areas with cross-area transfer. In this case, the aerial       has revealed the importance of mining hard samples dur-
images in four cities are all included as the reference data         ing training, as the model would suffer from poor conver-
for both training and testing. Then all the street panoramas         gence when most samples barely contribute to the total loss.
are randomly split into two disjoint sets (see Table 2).             For cross-view geo-localization, [29] further shows the im-
Cross-area: For cities where no GPS-tagged queries are               portance of mining global hard samples instead of mining

                                                                 4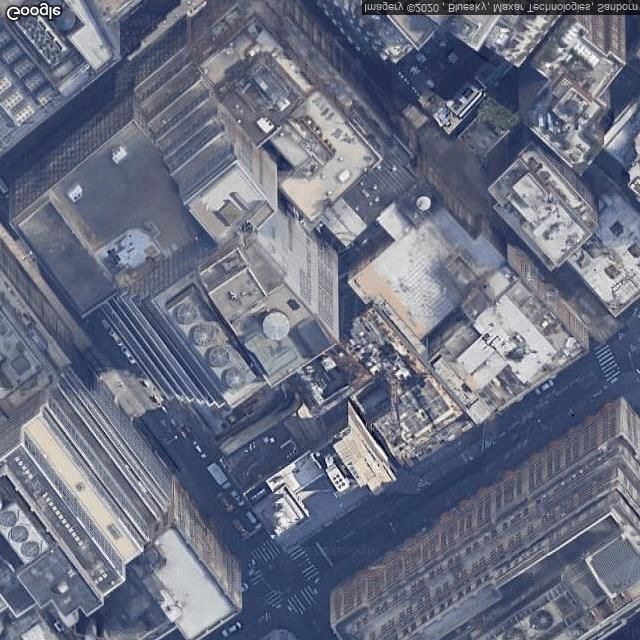
Street-view Query                CNN                      SAFA Block

                                                               ...                             Metric Learning
                                                                                                    Loss
                                                          Spatial-aware       Feature          Concatenate
                                                           Embedding        Aggregation
                                                                                                      MLP
                    or                                                                                       ∆Latitude  Regression
                                                              ...                                            ∆Longitude   Loss
                                             CNN                ...
         Positive        Semi-positive
                                                                                                 Offset Prediction
            Aerial-view Reference
Figure 4. An overview of the proposed end-to-end framework. The Siamese network provides embedding features for retrieval as a coarse
image-level localization. The offset prediction further generates refined localization in terms of meters.

within a mini-batch. The key idea is to build a first-in-first-            IOUpos and IOUsemi denote the IOU of positive and semi-
out mining pool to cache the embedding of the hardest sam-                 positive pairs. This loss forces the ratio of the similarities in
ple and refresh the pool along with back propagation effi-                 the embedding space to be close to the ratio of IOUs. Other
ciently. In a mini-batch, the first half images are randomly               assignment strategies for the semi-positive samples are also
selected and the global hard samples with respect to each of               investigated and evaluated in the ablation study.
them are mined from the mining pool to form the other half
of the batch. We adopt this efficient global mining strategy               4.3. Offset Prediction
[29] in the baseline to further improve its performance.                       With the top-1 retrieved reference aerial image, we em-
4.2. IOU-based Semi-positive Assignment                                    ploy an auxiliary task to further refine the localization in-
                                                                           side the aerial-view image in a unified framework (see Fig.
   If we only consider the positive samples, the retrieval                 4). With image retrieval, the minimal interval between re-
problem can be tackled with standard metric learning. For                  trieved reference images in our dataset is half of the width
the baseline, we adopt the widely used triplet-like loss pro-              of aerial images (L/2). To achieve more fine-grained local-
posed in [7]:                                                              ization, we apply an MLP (Multilayer Perceptron) to predict

           Ltriplet = log 1 + eα(dpos −dneg ) ,           (1)              the offset of the query location relative to the center of the
                                                                           retrieved reference image. As shown in Fig. 4, the auxil-
where dpos and dneg denote the squared l2 distance of the                  iary MLP consists of two fully connected layers and takes
positive and negative pairs. In a mini-batch with N ground-                the concatenated embedding features as input. Here we use
view and aerial-view image pairs, we use the exhaustive                    regression to generate the prediction, while we also provide
strategy [15] to build 2N (N − 1) triplets, thereby making                 a comparison with classification in the experiments. The
full use of all the input images. Following [7], we adopt l2               offset regression loss is formulated as:
normalization on the output embedding features.
                                                                                    Lof f set = (lat − lat∗ )2 + (lon − lon∗ )2 ,     (3)
   In addition to positive samples, it can be beneficial to
take advantage of the supervision information of semi-                     where lat and lon denote the predicted offset of the query
positive samples. However, simply assigning semi-positive                  GPS location relative to the reference GPS in latitude and
samples as positive would hurt the retrieval performance.                  longitude directions, and lat∗ and lon∗ denote the ground-
For a street-view query, the semi-positive aerial images only              truth offset. They are all converted into meters and normal-
contain a small part of the scene at the query location,                   ized with L during training. The final hybrid loss function
thus the similarities in the feature embedding space between               is given by:
semi-positive samples and the query should not be as high                                 Lhybrid = Ltriplet + LIOU + Lof f set .       (4)
as those of positive samples. An intuitive idea is to assign
the similarity according to the IOU between the reference                  5. Experiments
image and the aligned one (see Fig. 1 (d)). Therefore, the
IOU-based semi-positive assignment loss is expressed as:                   Implementation Details. All the experiments are deployed
                                            2                            based on Tensorflow [3]. Ground-view panoramas and
                           Ssemi     IOUsemi                               aerial-view images are resized to 640 × 320 and 320 × 320
             LIOU =               −              ,        (2)
                           Spos       IOUpos                               respectively before being fed into the network. VGG-16
where Spos and Ssemi denote the cosine similarity of the                   [19] is adopted as the backbone feature extractor and 8
positive and semi-positive pairs in the embedding space.                   SAFA blocks are used by following [17]. The mining strat-

                                                                       5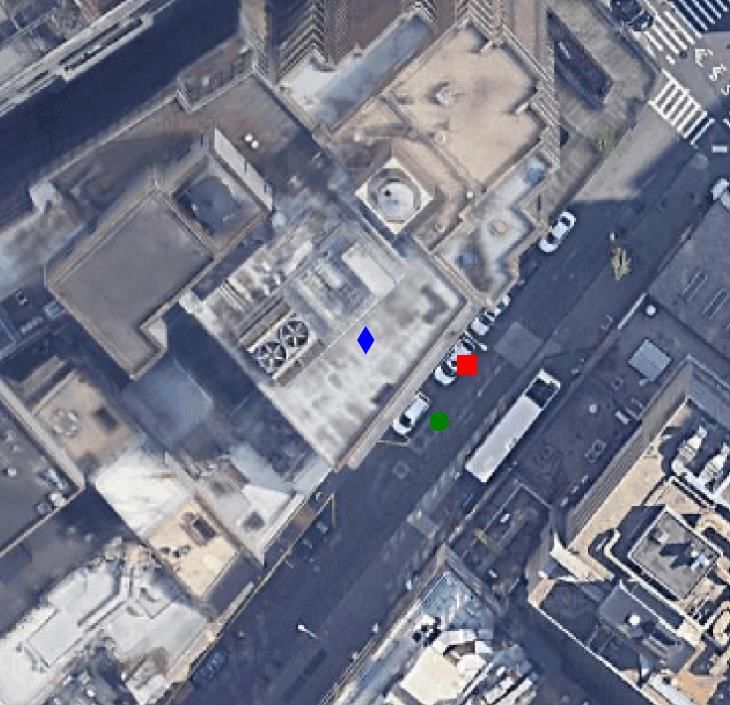
Same-Area                                 Cross-Area
                                                  Top-1 Top-5 Top-1% Hit Rate Top-1 Top-5 Top-1%                                         Hit Rate
                      Siamese-VGG (Ltriplet )      18.1      42.5     97.5        21.2        2.7      8.2      61.7                       3.1
                              SAFA (Ltriplet )     33.9      58.4     98.2        36.9        8.2     19.6      77.6                       8.9
                SAFA+Mining (baseline, Ltriplet )  38.0      62.9     97.6        41.8        9.2     21.1      77.8                       9.9
                                Ours (Lhybrid )    41.1      65.8     98.4        44.7       11.0     23.6      80.2                      11.6
                                        Table 3. Retrieval accuracy (percentage) of different methods.

                    50
                             Siamese-VGG                                                     14       Siamese-VGG
                             SAFA                                                                     SAFA
                             SAFA+Mining                                                     12       SAFA+Mining
                    40
                             Ours                                                                     Ours
                                                                                             10
     Accuracy (%)

                                                                              Accuracy (%)
                    30                                                                       8

                                                                                             6
                    20
                                                                                             4
                    10
                                                                                             2

                    0                                                                        0
                         5        10       15   20    25   30     35     40                       5       10    15       20    25   30    35        40
                                           Threshold (m)                                                            Threshold (m)
                         Figure 5. Same-area (left) and cross-area (right) meter-level localization accuracy of different methods.

                                                                Same-Area                                 Cross-Area
                         Semi-positive Assignment
                                                    Top-1 Top-5 Top-1% Hit Rate Top-1 Top-5 Top-1% Hit Rate
        No semi-positive (i.e. baseline, Ltriplet )  38.0    62.9     97.6       41.8        9.2      21.1      77.8        9.9
                               Positive (Ltriplet )  20.3    45.7     97.9       25.4        2.7       7.6      58.2        3.1
                          IOU (Ltriplet +LIOU )      41.1    65.9     98.3       44.8       10.7      23.5      79.3       11.4
               Positive+IOU (Ltriplet +LIOU )        31.1    58.3     98.6       36.7        5.3      13.6      69.4        6.0
           Table 4. Retrieval accuracy (percentage) of the proposed method with different semi-positive assignment strategies.

egy parameters are set the same as in [29]. Following [7],                             pooling, and is trained with Ltriplet . “SAFA” and “SAFA
we set α in the Ltriplet loss to 10. The Adam optimizer [8]                            + mining” denote the SAFA [17] architecture w/o and w/
is used with a learning rate of 10−5 . Our method is first                             the mining strategy in [29] using Ltriplet . As shown in Ta-
trained with Ltriplet . Then it switches to the hybrid loss                            ble 3 and Fig. 5, the proposed method constantly outper-
(Eq. 4) after 30 epochs for the same-area setting and 10                               forms previous approaches in terms of both retrieval and
epochs for the cross-area setting. The baseline (Sec. 4.1)                             meter-level evaluation. Compared with “SAFA+Mining”
for comparison is only trained with Ltriplet .                                         (the baseline), the relative improvements of our method for
Evaluation Metrics. We first evaluate the retrieval perfor-                            the 10-meter-level accuracy (see Fig. 5) are 124% (11.4%
mance with the top-k recall accuracy following previous                                → 25.5%) in the same-area setting, and 121% (2.8% →
works [7, 17]. For each test query, its closest k reference                            6.2%) in the cross-area setting. The substantial improve-
neighbors in the embedding space are retrieved as predic-                              ments reveal the superiority of the proposed hybrid loss.
tion. One retrieval is considered correct if the ground-truth
image is included in the top-k retrieved images. If the re-
                                                                                       6. Ablation Study
trieved top-1 reference image covers the query image (in-
cluding the ground-truth), it is considered as a hit and the                           Semi-positive Assignment.        We compare four semi-
hit rate is also provided for retrieval evaluation. Moreover,                          positive assignment strategies. “No semi-positive” denotes
we compute the real-world distance between the top-1 pre-                              the baseline which ignores the semi-positive samples. “Pos-
dicted location and the ground-truth query GPS as meter-                               itive” means assigning semi-positive samples as positive
level evaluation.                                                                      and using Ltriplet (Eq. 1). “IOU” denotes our IOU-based
Main Results. On the proposed VIGOR dataset, we com-                                   assignment (Eq. 2). “Positive+IOU” means including the
pare the proposed method with previous approaches under                                semi-positive samples as positive in Ltriplet along with the
both same-area and cross-area settings. “Siamese-VGG”                                  IOU-based assignment loss. The results in Table 4 show
[7] is a simple Siamese-VGG network with global average                                that only IOU-based assignment (“IOU”) boosts the per-

                                                                              6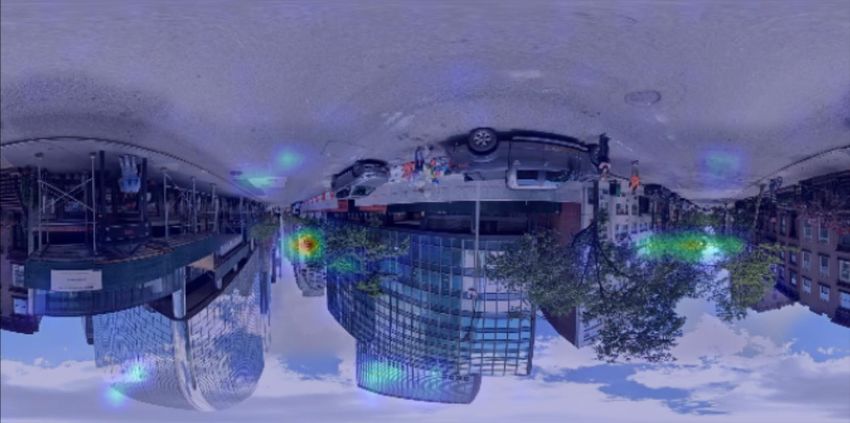
Same-Area                                 Cross-Area
                            Offset Prediction
                                                    Top-1 Top-5 Top-1% Hit Rate Top-1 Top-5 Top-1% Hit Rate
                           None (retrieval-only)     41.1     65.9       98.3       44.8     10.7      23.5       79.3        11.4
                                Regression           41.1     65.8       98.4       44.7     11.0      23.6       80.2        11.6
                               Classification        41.5     66.3       98.4       45.2     10.7      23.2       79.3        11.4
                           Table 5. Retrieval accuracy (percentage) of the proposed method with different offset prediction schemes.

                      50
                                 Retrieval-only                                                 14          Retrieval-only
                                 Regression                                                                 Regression
                                 Classification                                                 12          Classification
                      40
                                                                                                10
       Accuracy (%)

                                                                                 Accuracy (%)
                      30                                                                        8

                                                                                                6
                      20
                                                                                                4
                      10
                                                                                                2

                      0                                                                         0
                             5         10         15   20    25   30   35   40                         5         10      15       20    25     30      35    40
                                                  Threshold (m)                                                              Threshold (m)
           Figure 6. Same-area (left) and cross-area (right) meter-level localization accuracy of different offset prediction methods.

                                                                                                                                  0°     90°        180°    270°   360°
formance compared with the baseline. Based on the re-
sults of “Positive” and “Positive+IOU”, assigning semi-
positive samples as positive hinders the retrieval perfor-                                       Positive
mance whether the IOU-based loss is used or not.
   To further illustrate the difference between positive and
semi-positive matching, we conduct visual explanation.
Specifically, we use Grad-CAM [16, 28] to show which re-                                          Semi-
gions contribute the most to the cosine similarity of the em-                                    Positive

bedding features of two views. As presented in Fig. 7, for
a query image, we select the ground-truth reference aerial
                                                                                          Figure 7. Visualization results of the query image matched with
image (i.e. positive) and a semi-positive image (the query                                positive and semi-positive reference aerial images. Red circle de-
GPS location lies at its edge area), and generate the activa-                             notes the query region.
tion maps of both views. For the positive matching case,
the surrounding objects (buildings, roads and trees) are all
available to provide high contribution to the similarity be-
tween two views. However, in the case of semi-positive
matching, two views only share half of the scene and the
building on the west of the query (around 90◦ in panorama)
does not contribute to the similarity, because it is not in this
semi-positive image. This example shows how the inter-
section semantics of two views affect the image matching,
which agrees with the design of our IOU-based assignment.

Offset Prediction. We investigate both regression and clas-                               Figure 8. Case study on meter-level refinement within the retrieved
                                                                                          aerial image. Red square, green circle and blue diamond denote
sification for offset prediction in our method. For classi-
                                                                                          the final prediction with regression, ground-truth, and center (i.e.
fication, we split the central area of an aerial image (off-
                                                                                          the prediction with only retrieval), respectively.
set in [−L/4, L/4]) into a 10 × 10 grid, leading to 100
classes for classification. As shown in Table 5, both re-                                 method almost doubles the 10-meter-level localization ac-
gression and classification have negligible improvement on                                curacy. However, classification does not work well for cal-
the retrieval performance. However, as evident from Fig. 6,                               ibration possibly due to the ambiguous supervision of grid-
regression-based calibration significantly boosts the meter-                              based classification. We provide a case study in Fig. 8 to
level accuracy in both settings. For example, the regression                              show examples of predicted offset on aerial images.

                                                                                 7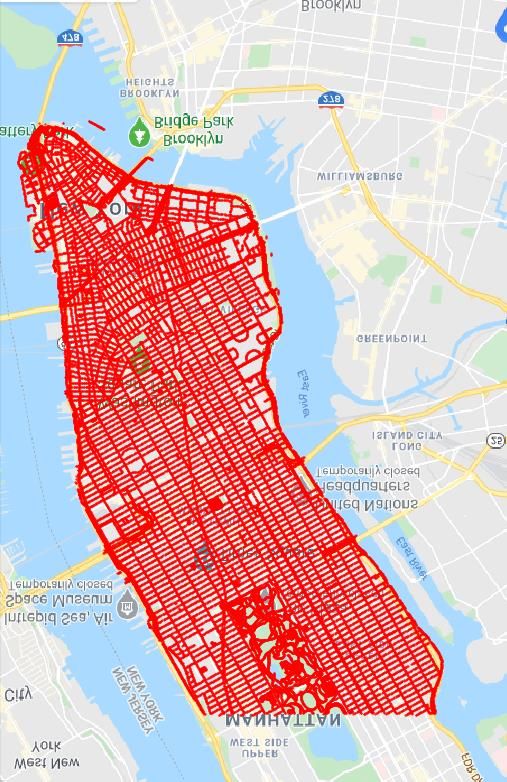
Positive per                    Same-Area                                Cross-Area
                         Aerial Image       Top-1 Top-5 Top-1% Hit Rate Top-1 Top-5 Top-1% Hit Rate
                                 2           38.0    62.9        97.6      41.8       9.2      21.1     77.8         9.9
             Baseline
                                 3           46.0    70.8        98.5      50.8      10.6      23.5     79.5        11.5
                                 2           41.1    65.9        98.3      44.8      10.7      23.5     79.3        11.4
             Ours
                                 3           48.5    72.9        98.9      52.6      11.5      24.8     80.8        12.2
               Table 6. Retrieval accuracy (percentage) of the proposed method with different sample balancing settings.
                                                                                              60
                            80       Original                                                          Original
                                     All                                                               All
                            70       1000 m                                                   50       1000 m
                                     500 m                                                             500 m
                            60       200 m                                                             200 m
                                                                                              40
             Accuracy (%)

                                                                               Accuracy (%)
                            50

                            40                                                                30

                            30                                                                20
                            20
                                                                                              10
                            10

                            0                                                                 0
                                 5         10   15   20    25   30   35   40                       5         10   15   20    25   30   35   40
                                                Threshold (m)                                                     Threshold (m)
Figure 9. Same-area (left) and cross-area (right) meter-level localization accuracy of different search scopes given noisy GPS signal.

Sample Balancing. To investigate the effect of sample                                    retrieval and meter-level evaluation because there are less
balancing in the pre-processing procedure, we compare                                    negative reference samples. The same-area evaluation even
“balancing-2” with “balancing-3” in Table 7. The results in                              yields an accuracy higher than 70% for 30m-level localiza-
Table 6 show that more densely sampled panoramas bring                                   tion. Moreover, as compared to the original noisy GPS, our
slightly better performance on both settings, while the im-                              cross-view geo-localization method significantly improves
provement is consistent across different balancing settings.                             the localization accuracy, demonstrating its practicality in
                                                                                         real-world applications.
                                 Balancing-2 Balancing-3
    Positives per aerial image         2              3                                                             Same-Area         Cross-Area
        Number of panoramas        105,214         149,869                                         Search Scope
                                                                                                                  Top-1 Top-5 Top-1 Top-5
     Number of aerial images        90,618          90,618                                            All          41.1     65.8     11.0     23.6
Table 7. The proposed dataset with different balancing numbers.                                    1000 m          49.2     76.7     19.9     41.5
                                                                                                    500 m          54.1     82.6     26.4     53.3
7. Application: Assistive Navigation                                                                200 m          60.9     90.6     37.7     72.0
                                                                                         Table 8. Retrieval accuracy (percentage) of the proposed method
    The GPS data provided by commercial devices such                                     with noisy GPS signals.
as phones could be noisy in urban environments (e.g.
the phone-based GPS error can reach up to 50 meters in
Manhattan [4]). Image geo-localization can assist mo-                                    8. Conclusion
bile navigation. To further validate the potential of cross-
view geo-localization given noisy GPS signals [4, 26], we                                    We propose a new benchmark for cross-view image geo-
simulate noisy GPS signals by adding random offsets in                                   localization beyond one-to-one retrieval, which is a more
[−100m, 100m] to the ground-truth GPS data (latitude and                                 realistic setting for real-world applications. Our end-to-end
longitude) in our dataset. In the inference stage, the query                             framework first coarsely localizes the query with retrieval,
image can be matched with only a small sub-set of refer-                                 and then refines the localization by predicting the offset
ence images around the noisy GPS locations instead of the                                with regression. An IOU-based hybrid loss is designed to
entire reference database (denoted by “All”). For a noise                                leverage the supervision of semi-positive samples. Exten-
level of 100m, a search scope of 200m is sufficient to cover                             sive results show great potential of the proposed method in
all possible references. To better illustrate the navigational                           realistic settings. Our proposed dataset offers a new testbed
assistance provided by our image geo-localization, we com-                               for cross-view geo-localization and inspires novel research
pare the results of multiple scopes with simply using the                                in this field.
noisy GPS signals (“Original”). As shown in Table 8 and                                      Acknowledgement. This work is partially supported by
Fig. 9, smaller search scopes generate better results for both                           the National Science Foundation under Grant No. 1910844.

                                                                               8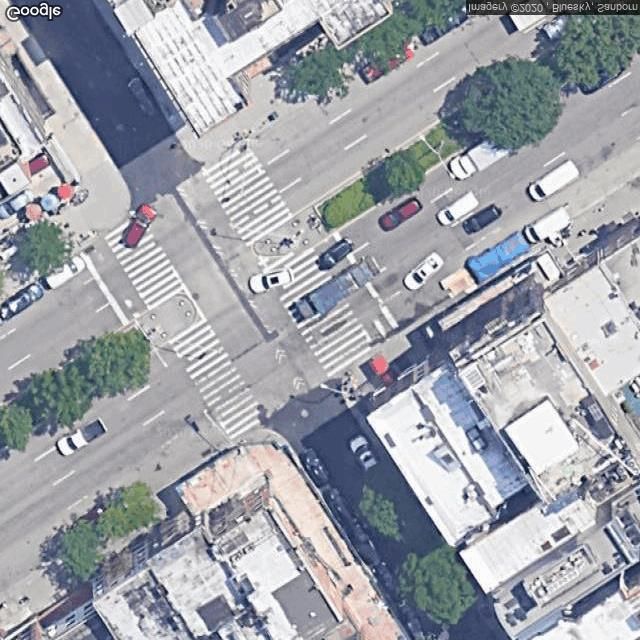
References                                                               [14] Krishna Regmi and Mubarak Shah. Bridging the domain gap
                                                                              for ground-to-aerial image matching. In Proceedings of the
 [1] https://developers.         google.com/maps/documentation/               IEEE International Conference on Computer Vision, pages
     streetview/intro.                                                        470–479, 2019.
 [2] https://developers.google.com/maps/documentation/maps-              [15] Florian Schroff, Dmitry Kalenichenko, and James Philbin.
     static/intro.                                                            Facenet: A unified embedding for face recognition and clus-
 [3] Martı́n Abadi, Paul Barham, Jianmin Chen, Zhifeng Chen,                  tering. In Proceedings of the IEEE conference on computer
     Andy Davis, Jeffrey Dean, Matthieu Devin, Sanjay Ghe-                    vision and pattern recognition, pages 815–823, 2015.
     mawat, Geoffrey Irving, Michael Isard, et al. Tensorflow: A         [16] Ramprasaath R Selvaraju, Michael Cogswell, Abhishek Das,
     system for large-scale machine learning. In 12th {USENIX}                Ramakrishna Vedantam, Devi Parikh, and Dhruv Batra.
     symposium on operating systems design and implementation                 Grad-cam: Visual explanations from deep networks via
     ({OSDI} 16), pages 265–283, 2016.                                        gradient-based localization. In Proceedings of the IEEE in-
 [4] Eli Brosh, Matan Friedmann, Ilan Kadar, Lev Yitzhak Lavy,                ternational conference on computer vision, pages 618–626,
     Elad Levi, Shmuel Rippa, Yair Lempert, Bruno Fernandez-                  2017.
     Ruiz, Roei Herzig, and Trevor Darrell. Accurate visual lo-          [17] Yujiao Shi, Liu Liu, Xin Yu, and Hongdong Li. Spatial-
     calization for automotive applications. In Proceedings of the            aware feature aggregation for image based cross-view geo-
     IEEE Conference on Computer Vision and Pattern Recogni-                  localization. In Advances in Neural Information Processing
     tion Workshops, pages 0–0, 2019.                                         Systems, pages 10090–10100, 2019.
 [5] Sudong Cai, Yulan Guo, Salman Khan, Jiwei Hu, and                   [18] Yujiao Shi, Xin Yu, Dylan Campbell, and Hongdong Li.
     Gongjian Wen. Ground-to-aerial image geo-localization                    Where am i looking at? joint location and orientation es-
     with a hard exemplar reweighting triplet loss. In Proceed-               timation by cross-view matching. In Proceedings of the
     ings of the IEEE International Conference on Computer Vi-                IEEE/CVF Conference on Computer Vision and Pattern
     sion, pages 8391–8400, 2019.                                             Recognition, pages 4064–4072, 2020.
 [6] Ian Goodfellow, Jean Pouget-Abadie, Mehdi Mirza, Bing               [19] Karen Simonyan and Andrew Zisserman. Very deep convo-
     Xu, David Warde-Farley, Sherjil Ozair, Aaron Courville, and              lutional networks for large-scale image recognition. arXiv
     Yoshua Bengio. Generative adversarial nets. In Advances                  preprint arXiv:1409.1556, 2014.
     in neural information processing systems, pages 2672–2680,          [20] Yumin Suh, Bohyung Han, Wonsik Kim, and Kyoung Mu
     2014.                                                                    Lee. Stochastic class-based hard example mining for deep
 [7] Sixing Hu, Mengdan Feng, Rang MH Nguyen, and Gim                         metric learning. In Proceedings of the IEEE Conference
     Hee Lee. Cvm-net: Cross-view matching network for                        on Computer Vision and Pattern Recognition, pages 7251–
     image-based ground-to-aerial geo-localization. In Proceed-               7259, 2019.
     ings of the IEEE Conference on Computer Vision and Pattern          [21] Bin Sun, Chen Chen, Yingying Zhu, and Jianmin Jiang. Geo-
     Recognition, pages 7258–7267, 2018.                                      capsnet: Ground to aerial view image geo-localization using
 [8] Diederik P Kingma and Jimmy Ba. Adam: A method for                       capsule network. In 2019 IEEE International Conference on
     stochastic optimization. arXiv preprint arXiv:1412.6980,                 Multimedia and Expo (ICME), pages 742–747. IEEE, 2019.
     2014.                                                               [22] Yicong Tian, Chen Chen, and Mubarak Shah. Cross-view
 [9] Ang Li, Huiyi Hu, Piotr Mirowski, and Mehrdad Farajtabar.                image matching for geo-localization in urban environments.
     Cross-view policy learning for street navigation. In Proceed-            In Proceedings of the IEEE Conference on Computer Vision
     ings of the IEEE International Conference on Computer Vi-                and Pattern Recognition, pages 3608–3616, 2017.
     sion, pages 8100–8109, 2019.                                        [23] Sebastiano Verde, Thiago Resek, Simone Milani, and An-
[10] Tsung-Yi Lin, Serge Belongie, and James Hays. Cross-view                 derson Rocha. Ground-to-aerial viewpoint localization via
     image geolocalization. In Proceedings of the IEEE Con-                   landmark graphs matching. IEEE Signal Processing Letters,
     ference on Computer Vision and Pattern Recognition, pages                27:1490–1494, 2020.
     891–898, 2013.                                                      [24] Nam N Vo and James Hays. Localizing and orienting street
[11] Liu Liu and Hongdong Li. Lending orientation to neural                   views using overhead imagery. In European conference on
     networks for cross-view geo-localization. In Proceedings of              computer vision, pages 494–509. Springer, 2016.
     the IEEE conference on computer vision and pattern recog-           [25] Scott Workman, Richard Souvenir, and Nathan Jacobs.
     nition, pages 5624–5633, 2019.                                           Wide-area image geolocalization with aerial reference im-
[12] Piotr Mirowski, Matt Grimes, Mateusz Malinowski,                         agery. In Proceedings of the IEEE International Conference
     Karl Moritz Hermann, Keith Anderson, Denis Teplyashin,                   on Computer Vision, pages 3961–3969, 2015.
     Karen Simonyan, Andrew Zisserman, Raia Hadsell, et al.              [26] Amir Roshan Zamir and Mubarak Shah. Accurate image
     Learning to navigate in cities without a map. In Advances in             localization based on google maps street view. In European
     Neural Information Processing Systems, pages 2419–2430,                  Conference on Computer Vision, pages 255–268. Springer,
     2018.                                                                    2010.
[13] Kevin Musgrave, Serge Belongie, and Ser-Nam Lim. A met-             [27] Menghua Zhai, Zachary Bessinger, Scott Workman, and
     ric learning reality check. arXiv preprint arXiv:2003.08505,             Nathan Jacobs. Predicting ground-level scene layout from
     2020.                                                                    aerial imagery. In Proceedings of the IEEE Conference on

                                                                     9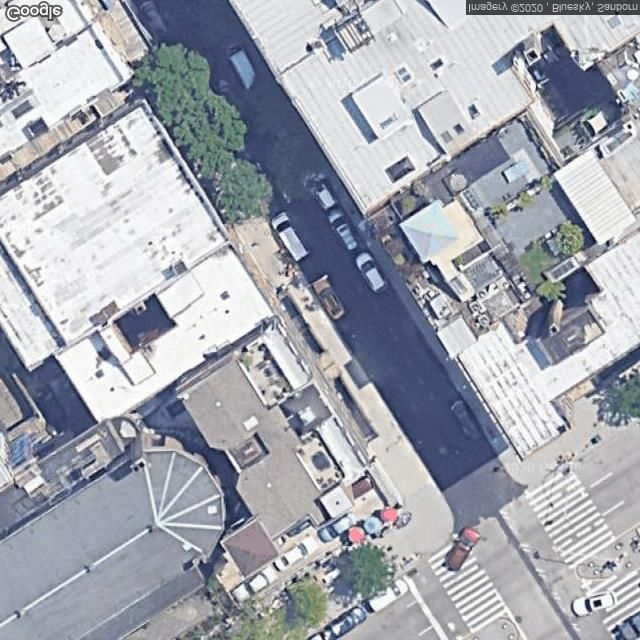
Computer Vision and Pattern Recognition, pages 867–875,
     2017.
[28] Sijie Zhu, Taojiannan Yang, and Chen Chen. Visual
     explanation for deep metric learning.        arXiv preprint
     arXiv:1909.12977, 2019.
[29] Sijie Zhu, Taojiannan Yang, and Chen Chen. Revisiting
     street-to-aerial view image geo-localization and orientation
     estimation. In Proceedings of the IEEE/CVF Winter Con-
     ference on Applications of Computer Vision (WACV), pages
     756–765, January 2021.

                                                                    10
You can also read