Response of a Pioneering Species (Leptospermum scoparium J.R.Forst. & G.Forst.) to Heterogeneity in a Low-Fertility Soil
←
→
Page content transcription
If your browser does not render page correctly, please read the page content below
ORIGINAL RESEARCH
                                                                                                                                             published: 06 February 2019
                                                                                                                                            doi: 10.3389/fpls.2019.00093

                                             Response of a Pioneering Species
                                             (Leptospermum scoparium J.R.Forst.
                                             & G.Forst.) to Heterogeneity in a
                                             Low-Fertility Soil
                                             Maria Jesus Gutiérrez-Ginés 1,2* , Engracia Madejón 3 , Niklas J. Lehto 1 ,
                                             Roger D. McLenaghen 1 , Jacqui Horswell 4 , Nicholas Dickinson 1 and Brett H. Robinson 1,5
                                             1
                                              Faculty of Agriculture and Life Sciences, Lincoln University, Lincoln, New Zealand, 2 The Institute of Environmental Science
                                             and Research Ltd., Christchurch, New Zealand, 3 The Institute of Natural Resources and Agrobiology of Seville, Spanish
                                             National Research Council (CSIC), Seville, Spain, 4 College of Health, Massey University, Wellington, New Zealand, 5 School
                                             of Physical and Chemical Sciences, University of Canterbury, Christchurch, New Zealand

                                             Root foraging may increase plant nutrient acquisition at the cost of reducing the
                                             total volume of soil explored, thereby reducing the chance of the roots encountering
                                             additional patches. Patches in soil seldom contain just one nutrient: the patch may
                                             also have distinct textural, hydrological, and toxicological characteristics. We sought to
                           Edited by:
                  Victoria Fernandez,
                                             determine the characteristics of root foraging by a pioneering species, Leptospermum
     Polytechnic University of Madrid,       scoparium, using pot trials and rhizobox experiments with patches of biosolids. The
                                Spain
                                             growth of L. scoparium was increased by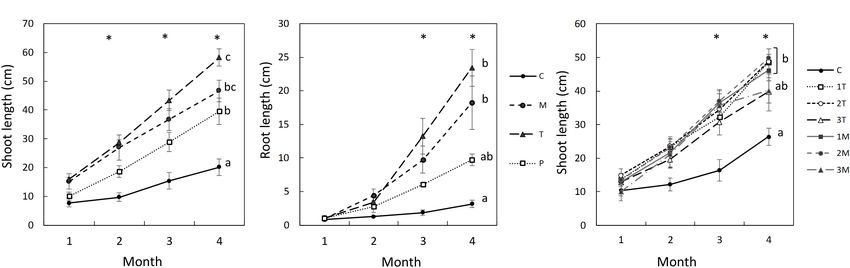
Gutiérrez-Ginés et al.                                                                           A Pioneering Species in Heterogeneous Low-Fertility Soil

to soil heterogeneity. Within a species, root responses to                  toward that patch (Ruffel et al., 2011) or whether roots simply
heterogeneity depend on environmental factors, including soil               proliferate within a patch or along a chemical gradient in soil.
type, the geometric distribution of nutrient-rich patches, as well             Given that it is not possible to create a nutrient patch in
as the type of nutrients present in the patch (Hodge, 2004,                 soil without changing other soil parameters, we used biosolids
2009). McNickle et al. (2009) suggested the use of an optimality            (treated sewage sludge) to represent what may occur both
framework to explain the root foraging behavior of plants, which            naturally (i.e., a patch of decomposed organic matter) and
could help to explain, and unify the contrasting results that have          artificially (a biosolids-amended soil).
been obtained in this research field.                                          It is unknown how the dose of biosolids affects the growth
    High concentrations of some trace elements or other toxic               and elemental composition of this species. This information is
agents in soils can also induce variations in root architecture             critical to determine a biosolids application rate that is likely
(Arduini et al., 1994). Roots can respond to these toxic agents             to elicit a significant growth response in L. scoparium without
by either tolerance, avoidance, or inhibition. Plants can tolerate          resulting in phytotoxicity. Therefore, we aimed to first elucidate
toxic agents in the soil by reducing their bioavailability through          the response of L. scoparium to increasing doses of biosolids
root exudates or recruiting specialist microorganisms to that end           and thence determine the root behavior in a reconstructed soil
(Dimkpa et al., 2009), preventing their entry into symplast, and            profile amended with biosolids both homo- and heterogeneously.
actively transporting toxins from the symplast into the apoplast            In the absence of a chemical gradient in the soil, root growth
(Robinson et al., 2009). Root architecture may change, resulting            toward a patch of biosolids would be consistent with a signaling
in fewer roots growing near or in a patch containing toxic agents           mechanism.
(Moradi et al., 2009; Robinson et al., 2009; Khare et al., 2017). As
with nutrients, plant responses to toxic agents depend on their
distribution in soil (Solomon-Wisdom et al., 2015).                         MATERIALS AND METHODS
    Most of the experiments for studying the foraging behavior
of root systems are carried out in plates with artificial growth            Collection and Preparation of Soil,
media (Khare et al., 2017) or with nutrient solution either in pots         Biosolids, and Plants
(Hodge, 2009), or in rhizoboxes. Reis et al. (2017) used rhizoboxes         Craigieburn silt loam, a Typic Allophanic Brown Soil (Hewitt,
(15 cm × 30 cm × 2 cm) filled with sand; Moradi et al. (2009)               2010), was collected from Coleridge-Lyndon Rd, Canterbury,
had rhizoboxes that were 17 cm × 15 cm × 1.5 cm, filled with                New Zealand (S 43◦ 200 3500 , E 171◦ 360 5900 ). This area has no
sand and irrigated with nutrient solution. The above-mentioned              history of cultivation nor received any fertilizer. The vegetation
studies all propounded the necessity of further research on root            is dominated by Dracophyllum longifolium, L. scoparium, and
behavior in contrasting scenarios, for example with a stratified            Kunzea robusta. Approximately 100 kg was collected from each
soil profile and a growth period of months rather than weeks.               horizon (Ah, 0–15 cm; Bw, 20–40 cm; and BC, 40–70 cm),
    Leptospermum scoparium is a member of the Myrtaceae                     from an area of approx. 25 m2 , using a spade, and stored
family and one of the most widely distributed, abundant, and                separately. Samples were transported to the greenhouse facilities
hardy member of the New Zealand indigenous woody flora                      in Lincoln University, NZ (S 43◦ 380 4300 , E 172◦ 270 4400 ), and
(Stephens et al., 2005). It is a pioneer species that often colonizes       processed in the shade at room temperature, within a week
environments where climax forest cannot develop due to extreme              since collection. Samples from each horizon were homogenized
wet, dry, cold, exposed, infertile, and/or unstable soils (Stephens         and passed through a 12 mm sieve to remove stones while
et al., 2005). The root system of L. scoparium consists on a tap            maintaining soil aggregates and structure. A mixture of samples
root with a few main structural roots of small diameter that give           from Ah and Bw horizons in a 4:1 proportion was used in
rise to a dense network of fine roots. The lateral roots are mainly         the pot experiment. Subsamples from each horizon, as well
concentrated in the top 20 cm of soil and the roots that extended           as the mixture for pot experiment, were taken for chemical
furthest are generally within 10 cm of the soil surface (Watson             analyses. The Christchurch City Council supplied biosolids from
and O’Loughlin, 1985). These authors reported that >96% of the              municipal wastewater treatment plant, which were anaerobically
total root length of L. scoparium consisted of roots with diameter          digested and thermally dried, and presented as granules. Table 1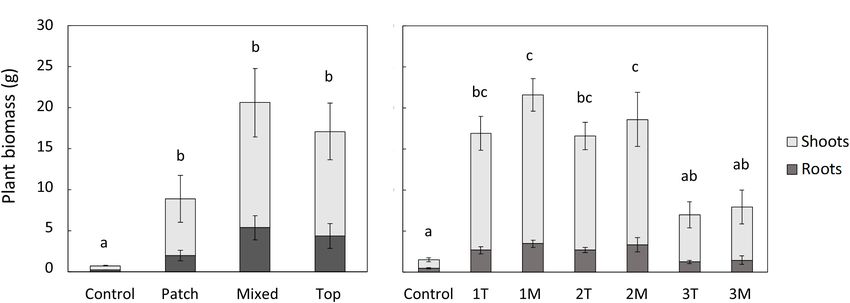
Gutiérrez-Ginés et al.                                                                                             A Pioneering Species in Heterogeneous Low-Fertility Soil

TABLE 1 | Chemical characterization of soil and biosolids in the rhizobox and pot experiment.

Parameter                       Horizon Ah                        Horizon Bw                     Horizon BC                   Soil for pots                  Biosolids

pH                               5.57 ± 0.00                       5.77 ± 0.04                    5.89 ± 0.06                   5.56 ± 0.01                   6.78 ± 0.02
EC (µS cm−1 )                      36 ± 1.0                          17 ± 0.7                       7.9 ± 0.3                     36 ± 1.0                    2690 ± 32
C (%)                            1.46 ± 0.18                       1.03 ± 0.07                    0.70 ± 0.05                   1.59 ± 0.04                     30 ± 0.03
N (%)                            0.24 ± 0.00                       0.12 ± 0.00                    0.07 ± 0.00                   0.22 ± 0.01                   3.95 ± 0.00
NH4 + -N
Gutiérrez-Ginés et al.                                                                            A Pioneering Species in Heterogeneous Low-Fertility Soil

acetate film, which was subsequently scanned with 400 dpi                     Leptospermum scoparium leaves were analyzed for total N
resolution.                                                                using an Elementar Vario-Max CN Analyser. Dried subsamples
   At the end of the experiment, when the roots on the fastest             were digested using a microwave acid digestion technique (CEM
growing treatment (top and mixed application of biosolids)                 MARS Xpress, using 0.3 g dried plant material, 2.0 mL trace
reached the edges of the rhizobox (after 4 months), the shoots             element grade nitric acid and 2.0 mL analytical grade 30%
were abscised, rinsed with deionized water, and oven-dried at              hydrogen peroxide, according to the equipment specifications).
70◦ C for 1 week. Once dried, leaves were separated from the               Due to the small amount of leaves in the control treatments of
stems, bulked together on an individual plant basis and treated            the rhizobox experiment, the minimum weight required for N
separately. For the root collection, the soil material (soil and           analysis was not reached. Therefore, the rhizobox trial did not
roots) from each rhizobox was divided into nine equally sized              have the N analyzed in the control treatment.
sections. Sections were labeled according to their respective                 Concentrations of P, K, S, Mg, Ca, Cr, Mn, Fe, Cu, Zn,
horizon (A, B, or C), and the vertical column from left to right (1,       As, and Cd were determined in the digests and extracts
2, or 3). The roots were then collected from each sector, washed           using inductively coupled plasma optical emission spectroscopy
with tap water using a sieve of 1 mm to avoid losing thin roots,           (ICP–OES, Varian 720-ES). Analysis of Certified Reference
and over a container to recover thinner roots that might have              Materials (reference 981, sandy soil from Netherlands) and
passed through the sieve. For each of the sections, the roots were         a reference plant sample (reference 952, mixture of grasses
bulked together, oven-dried at 70◦ C for 1 week, and weighed.              from Netherlands) from Wageningen Evaluating Programs for
                                                                           Analytical Laboratories (WEPAL, NL-6700 EC Wageningen,
Pot Experiment Setup, Monitoring, and                                      Netherlands) gave recoveries between 85 and 120%.
Harvesting
The pot experiment used 4 L pots (195 mm × 195 mm) with
                                                                           Data Analysis
                                                                           Root drawings were analyzed for total root length by
3.2 kg of soil, and comprised seven treatments and five replicates
                                                                           WinRHIZOTM software1 . To analyze the distribution of roots
per treatment. There was a control treatment without biosolids,
                                                                           in the rhizobox, root drawings were divided in 20 cm × 20 cm
three treatments with biosolids homogeneously incorporated
                                                                           squares, placing the stem in the top-middle part of one of the
into the soil at rates of 1.4, 4.3, and 12.8% fresh weight
                                                                           squares, and root length in each squared was measured. Note
(approx. 16, 48, and 145 t/ha respectively), and biosolids
                                                                           that this division in squares is not the same than the division of
applied on the surface at the same rate. Along the text, the
                                                                           soil and root biomass. This is for increasing the resolution of the
three rates of application are referred to as “low,” “medium,”
                                                                           distribution of root length compared with biomass and soil.
and “high.” One L. scoparium seedling was planted in each
                                                                              The results of each experiment were analyzed separately. For
pot. The 35 pots were placed in a randomized block design
                                                                           the rhizobox experiment, total root length, shoot length, plant dry
in the same greenhouse as the rhizoboxes above. The trial
                                                                           weight, percentage of total biomass allocated to the roots, and
ran during the same period and the pots were maintained
                                                                           concentration of elements were compared between treatments
in an identical fashion as the rhizoboxes. The growth of
                                                                           with analysis of variance (ANOVA) and Turkey’s test post hoc
the plants was recorded by measuring the shoot length as
                                                                           multiple comparison testing (p < 0.05). Raw data was tested
before.
                                                                           for homoscedasticity with Bartlett’s test, and for normality with
   At the end of the experiment, shoots were abscised and treated
                                                                           Ryan-Joiner test’s (which is similar to Shapiro-Wilk). Data was
as above. The top 3 cm of the growing medium in the pot
                                                                           Log10 transformed when the assumptions were not fulfilled.
(consisting of soil, biosolids, and root material) was separated
                                                                           Root length at right and left sides of the main root in the
from the remaining material in the pot below (approximately
                                                                           Patch treatment were compared with one way paired t-test,
11 cm). The roots were treated as above.
                                                                           and assumption of normality for the differences between both
                                                                           sides with Ryan-Joiner test. Calculations were performed using
Chemical Analysis                                                          MINITAB Release 12.
                                                                                          R

Soluble NH4 + and NO3 − concentrations in soils and biosolids                 For the pot experiment, the same responses were analyzed
were determined on fresh samples, using a 2M KCl extraction                with two-way ANOVA with Block and Treatment as factors.
(Clough et al., 2001), and analyzed with a Flow Injection                  Turkey’s multiple comparison test was used to identify significant
Analyser (FOSS FIAstar 5000). Sub samples of soil, and biosolids           differences between treatments. Raw data was tested for
were dried at room temperature and analyzed for pH and                     homoscedasticity with Bartlett’s test, and for normality with
electrical conductivity in a 1:5 (w:v) soil-water ratio (Blakemore         Shapiro-Wilk’s test. When the assumptions were not fulfilled,
et al., 1987). Pseudo-total elements of the soil, and biosolids            data was log10 or root square transformed. Calculations were
were extracted using the microwave CEM MARS Xpress acid                    performed using R software.
digest technique (0.5 g substrate, 4.0 mL trace element grade                 The few outliers identified during the analysis of the results
nitric acid and 4.0 mL 30% hydrogen peroxide, according to                 were removed from the analysis. This is highlighted in the tables
the equipment specifications). The exchangeable trace element              and graphics of results by lower number of replicates analyzed.
fraction was extracted with 0.05M Ca(NO3 )2 (McLaren et al.,               All the graphics were created with Microsoft Excel.
2005). The Olsen P was extracted with 0.5M NaHCO3 (Olsen
et al., 1954).                                                             1
                                                                               www.regent.qc.ca

Frontiers in Plant Science | www.frontiersin.org                       4                                            February 2019 | Volume 10 | Article 93
Gutiérrez-Ginés et al. A Pioneering Species in Heterogeneous Low-Fertility Soil
RESULTS significant lower root and shoot growth. In the first month,
the total root length, and shoot length were not significantly
Root and Shoot Development different between treatments (Figures 1A,B). The roots of C and
Root and shoot length in the end of the experiment were P treatments were thin with few lateral roots, and the growth was
correlated with root and aerial part biomass. The Person mostly vertical. In contrast, the roots in M and T treatments were
correlation coefficients were 0.955 (p < 0.001) for the roots in the thicker with more lateral roots and mainly located top horizon
rhizobox experiment, and 0.636 (p < 0.001) for the whole set of (see Supplementary Material).
aerial parts in both experiments. Therefore, root and shoot length From the second month, the shoot length was significantly
represent plant growth throughout the experiment. higher in M and T treatments than in C. And from the third
In the rhizobox experiment, Mixed (M), and Top (T) month, both shoot and root length were significantly higher in all
treatments were the ones with highest root and shoot length, treatment with biosolids (M, T, and P) than in C (Figures 1A,B).
followed by Patch (P). Control (C) treatment presented Shoots in P treatment were not significant different from the
FIGURE 1 | Averages and standard errors of shoot length (A) and root length (B) of plants throughout the rhizobox experiment, and shoot length in the pot
experiment (B). ∗ indicates p < 0.005 in the ANOVA analysis. Different letters indicate significant differences in total root length between treatments (p < 0.05,
Turkey’s test), n = 3 in (A,B), except for T in (B), with n = 2, and n = 5 in (C).
FIGURE 2 | Distribution of new roots in each 20 cm ×20 cm quadrants in each treatment. Bubble size (area) is proportional to the average % of new roots in each
quadrant. Outlined bubble indicates the quadrat where the main root was N = 3 except for T where N = 2.
Frontiers in Plant Science | www.frontiersin.org 5 February 2019 | Volume 10 | Article 93Gutiérrez-Ginés et al. A Pioneering Species in Heterogeneous Low-Fertility Soil
control until the third month. From the second month, when the the second month (Figure 3), increasing the number of lateral
roots in P treatment found the patch of biosolids (see description roots at right of the main root (in direction of the patch), and
below), the shoot growth rate of P, 10 cm/month, was similar also increasing density of thin roots (more branching) toward,
than M treatment, compared with 4 cm/month in C treatment and in the patch. In all p-treatment rhizoboxes, the length of the
(Figure 1A). new roots length was consistently higher to the right of the main
Similarly, in the pot experiment, the shoot lengths in root (toward the patch) than on left of the main root (Figure 2),
L. scoparium were significantly higher in the biosolids treatments leading to an average new root length on the right hand side that
compared with the control (Figure 1C). Although there was a was significantly higher than the left hand side at the end of the
significant difference in the third month, by the fourth month, experiment.
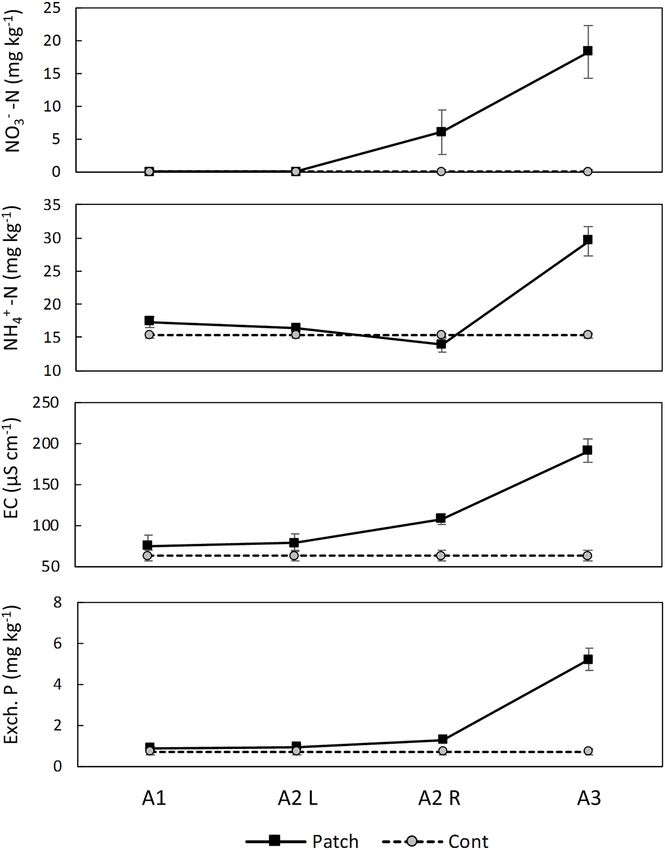
the treatments with the high rate of biosolids were not different The analysis of the soil in the rhizoboxes indicated horizontal
from the control. There were no significant differences between gradients of NO3 − and EC from the patch of biosolids, but not
the type of application T or M. for extractable NH4 + , or P (Figure 4).
Figure 2 shows the average percentage of new roots generated
in each quadrant in each treatment and month. Data of the Plant Biomass
percentages with standard error are in Supplementary Material. The plant biomass (shoots and roots) obtained for the treatments
The roots in M treatment developed mostly in the Ah horizon in the rhizobox experiment followed the sequence M = T = P > C
and were less spread than in the T treatment (Figure 2 and (Figure 5), similar to the results obtained for plant development
Supplementary Material). At the end of the experiment, 95% (shoot and root length), and the enhanced growth resulting
and 88% of the root biomass in M and T, respectively was from biosolids application. No significant differences between
located in the Ah horizon. The total root length in C treatment treatments could be observed in the percentage of the total
throughout the experiment was significantly lower than in M and biomass allocated to roots.
T treatments, but roots developed more vertically (Figures 1B, In the pot experiment, both shoot and root biomass, were
2, 3). Figure 3 represents all the root systems of plants in P significantly higher than the control in the treatments with
treatments along the experiment. Roots in P treatment started low and medium rate of biosolids application (16 and 48 t/ha,
to grow preferentially in/or toward the patch of biosolids from respectively), but no significant difference was observed between
FIGURE 3 | Development of L. scoparium roots growing in the three replicates of patch (P) treatment in the rhizobox experiment. The gray square represents the
scale of 10 cm × 10 cm. The orange square represents the area where the patch of biosolids was located.
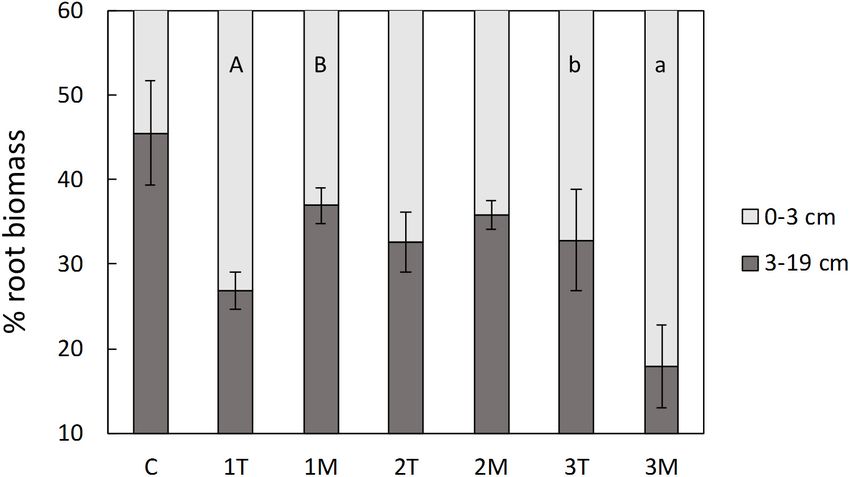
Frontiers in Plant Science | www.frontiersin.org 6 February 2019 | Volume 10 | Article 93Gutiérrez-Ginés et al. A Pioneering Species in Heterogeneous Low-Fertility Soil FIGURE 4 | Soil analysis in the Ah horizon of the rhizoboxes at the end of the experiment. Quadrat A2 was divided to be able to detect a gradient. A3 is the quadrat where the patch of biosolids was located. Results represent average and standard errors (n = 6). EC, electrical conductivity. type of application (T or M; Figure 5). The high dose of biosolids treatment, the percentage of root biomass in the top 3 cm was (145 t/ha) in both types of application (T and M) had a negative significantly higher when biosolids were applied in the top than effect in the biomass of the plants (Figure 5), compared with when they were mixed. At medium rate, the root distribution low and medium rates, and was not significantly different from was unaffected by the type of biosolids application. At the highest control. This was also visually evident with less vigor and foliage dose, there was a higher concentration of roots in the surface in density (see Supplementary Material), as well as small necrosis mixed application of biosolids, compared with top application. spots on the leaves. The percentage of the total biomass allocated to roots was significantly higher in control treatment (average Plant Nutrition and Trace Elements of 32%) than in all biosolids treatments (average of 18%). There In the rhizobox experiment, the N concentration in leaves were no significant differences between biosolids treatments, rate was similar in all treatments with different types of biosolids or type of application (results not shown). Although the type application (M, T or P – there are no leaf N results for C) of application (T or M) did not affect the root biomass, the (Table 2). In the pot experiment, the concentration of N in distribution of root biomass in the pot was different depending leaves of L. scoparium increased in the treatments with biosolids on type of application, as shown in Figure 6. In the low dose compared with control, although it was only significant between Frontiers in Plant Science | www.frontiersin.org 7 February 2019 | Volume 10 | Article 93
Gutiérrez-Ginés et al.                                                                                              A Pioneering Species in Heterogeneous Low-Fertility Soil

  FIGURE 5 | Plant biomass (shoots and roots) in the rhizobox (A) and pot (B) experiments. In (B) 1, 2, and 3 are the increasing doses of biosolids, T is top
  application, and M is mixed application. Bars represent standard error. Different letters indicate significant differences in the total plant biomass (root+shoot)
  (p < 0.05, Turkey’s test). N = 3 in (A) and n = 5 in (B).

  FIGURE 6 | Distribution of root biomass in the top or bottom part of the pots. C, control; 1, 2, 3, increasing dose of biosolids; T, top application; M, mixed
  application. The error bars represent standard error. Different letters indicate significant difference between top and mixed application of biosolids at the same rate,
  capital letters for rate 1, small letters for rate 3 (p < 0.05, t-test).

control and 1M vs. 3M. Nitrogen is supplied by biosolids almost                            However, there are differences in the concentration of S, Mg, and
entirely as NH4 + (Table 1); however, there is some evidence                               Ca between doses of biosolids (Table 2).
to suggest that a proportion of this was converted to the more                                 The nutrient accumulation by leaves (concentration × leaf
mobile NO3 − during the growth period (Figure 4).                                          biomass) was mainly affected by the differences in biomass,
   Phosphorus concentrations in L. scoparium leaves in the                                 rather than by nutrient concentration, being always higher, for
rhizobox experiment were higher in C and P treatments than                                 all the nutrients, in treatments with low and medium biosolids
in T and M treatments (Table 2). In the pot experiment,                                    application in the pot experiment, and M and T in the rhizobox
P concentration increased with higher rates of biosolids                                   experiment (see Supplementary Material).
application, and was not different in surface application                                      In the rhizobox experiment, both Cu and Zn concentrations
compared with mixed application (Table 2). Olsen P was 30 times                            in the leaves of the plants treated with biosolids were low
higher in biosolids than in the soil (Table 1).                                            and similar to the values obtained in the control treatment
   Although exchangeable S, K, Mg, Ca, and Na were higher in                               (Table 2). Despite high concentrations, especially of Zn, in
biosolids than in the soil (Table 1), the concentration of these                           biosolids, the bioavailability of this element for plants was low or
elements in leaves were not higher in biosolids treatments than                            maybe was retained at the root level. Manganese concentrations
in control, because they were not limiting nutrients in the soil.                          were higher in M and T treatments than in C and P, while

Frontiers in Plant Science | www.frontiersin.org                                       8                                               February 2019 | Volume 10 | Article 93
Gutiérrez-Ginés et al.                                                                                            A Pioneering Species in Heterogeneous Low-Fertility Soil

TABLE 2 | Average nutrient and trace element concentration in L. scoparium leaves in both experiments.

Treat.        N               P              S            K           Mg                 Ca              Na        Cu            Mn             Zn            Cd
           % w/w               g kg−1        g kg−1       g kg−1       g kg−1       % w/w              g kg−1      mg kg−1       mg kg−1        mg kg−1       mg kg−1

Rhixobox experiment
ANOVA                         0.000                                   0.000#        0.002                          0.033#        0.001#         0.040
Control      n.a.             2.5     b     3.0          8.2          4.7      b      1.8        b       1.8       7.1      b    185       a    41            0.00
Mixed        2.3              1.4      a    2.7          8.0          2.6      a      1.5        b       0.85      5.2      ab   397      b     42            0.03
Patch        2.3              2.3     b     2.9          8.0          2.5      a      1.0        a       1.0       5.6      ab   255       a    29            0.04
Top          2.2              1.0      a    2.4          6.7          2.0      a      1.0        a       1.0       4.4      a    403      b     21            0.01

Pot experiment
ANOVA      0.005∗             0.001         0.005        0.022        0.000#        0.000#                          0.005        0.000#         0.000#        0.000&
Control      2.0         a    1.4     ab    3.2     ab   12      b    4.1      cd     1.4      bcd       1.1       6.3      b    292       a    61       ab   0.02     ab
1T           2.4         ab   1.5     abc   3.1     ab   8.9     ab   1.9      a     0.89        a       1.0       5.3      ab   267       a    36       a    0.01      a
1M           2.2         a    1.2      a    2.5     a    8.5     ab   2.1      ab    0.97       ab       0.72      3.2      a    241       a    40       a    0.01      a
2T           2.6         ab   2.0     bc    3.0     ab   9.0     ab   2.5      ab     1.2      abc       0.85      4.3      ab   720      bc    42       a    0.13     bc
2M           2.7         ab   1.9     abc   3.4     b    9.1     ab   2.6      b      1.4       cd       1.0       5.5      b    578      b     62       ab   0.12     abcd
3T           2.7         ab   1.8     abc   2.9     ab   6.1     a    2.6      b      1.1      abc       0.85      3.7      ab   803      bc    41       a    0.15     cd
3M           2.8         b    2.1      c    3.5     b    6.0     a    3.7      d      1.7        d       0.85      5.6      ab   977       c    88       b    0.22     cd

ANOVA, indicates the p-value of the ANOVA analysis in each experiment for each element. Different letters indicate significant differences (p < 0.05, Turkey’s test) between
treatments in the same experiment. Where no ANOVA or letters are present indicates that there were no significant differences. ∗ None of the transformations fulfilled the
assumptions, ANOVA made in raw data. # Log10 transformation. & Square root transformation.

no significant differences were found for leaf concentrations                                The root systems of L. scoparium in our rhizoboxes were
of Cd.                                                                                   consistent with the findings of Watson and O’Loughlin (1985)
   In the pot experiment, the leaf concentration of trace                                who reported a high proportion of fine roots. Although
elements increased as the application doses of biosolids increased                       L. scoparium has not been classified according to Grime’s plant
(Table 2). Concentrations of Mn and Cd increased significantly                           strategies (Grime, 2001), its predominance in low fertility soils
from the control, with ten (Cd), and two (Mn) fold increases                             is consistent with “stress-tolerant” type. However, L. scoparium
observed between the low and medium dose treatments. On                                  growth and traits are contrary to the traits associated with plants
the other hand, leaf concentrations of Cu and Zn did not                                 in this category: L. scoparium is not a slow-growing species, and
increase significantly with increased biosolids application rates.                       our results show high morphological root plasticity.
The type of application did not influence the accumulation of                                This foraging behavior may enhance the effectiveness
trace elements in the leaves except in the case of the high dose                         of L. scoparium to obtain nutrients in the low-nutrient
of biosolids, and for Zn concentration.                                                  environments where it usually grows (Stephens et al., 2005). This
                                                                                         behavior depends as much on the environment as on the plant
                                                                                         species (Hodge, 2009). The efficacy of root foraging in increasing
DISCUSSION                                                                               plant growth was lower in the present study than in Reis et al.
                                                                                         (2017), because the patch of biosolids was further from the main
The results were consistent with L. scoparium roots having                               root, and occupied a lower percentage of the rhizobox surface,
plastic root architecture, with roots foraging and proliferating                         compared with Reis et al. (2017). Even so, when roots started to
near and/or into nutrient-rich patches in the soil. L. scoparium                         forage the NO3 − gradient, and/or patch of biosolids, plant growth
roots follow a horizontal gradient of NO3 − until they reach                             was similar to the plants which more homogeneous distribution
the source in the patch of biosolids. Roots developed more                               of biosolids. The efficacy of this foraging behavior, and low N
lateral roots and with more branching following the NO3 −                                requirement are highlighted in one of the replicates in Patch
gradient. Due to the existence of a gradient, there is no                                treatment, where roots were proliferating in the NO3 − gradient,
evidence of a signaling mechanism, although we cannot entirely                           near the patch of biosolids, but not inside (Figure 3, Rep1). This
discard this hypothesis. The preferential allocation of roots                            replicate presented a growth and nutrient status similar to the
in the top of the pots, when biosolids are surface-applied at                            other replicates, and to the other treatments with biosolids.
low doses, is consistent with the observations in the rhizobox                               Although L. scoparium naturally grows in low fertility
experiment. Higher leaching of nutrients to deeper parts of                              environments (Stephens et al., 2005), its growth is enhanced
the pots from the surface-applied biosolids at medium rate                               by the addition of nutrients (Esperschuetz et al., 2017a,b; Reis
might explain that roots were not concentrated in the top                                et al., 2017). In this experiment, N was the limiting nutrient;
3 cm of the pot, and also the extension of roots in the                                  its concentration in leaves when biosolids were added, was
treatment with biosolids applied in the surface in the rhizobox                          comparable to previous studies with this species (Esperschuetz
experiment.                                                                              et al., 2017a,b; Reis et al., 2017), and other native pioneer species

Frontiers in Plant Science | www.frontiersin.org                                     9                                                 February 2019 | Volume 10 | Article 93
Gutiérrez-Ginés et al. A Pioneering Species in Heterogeneous Low-Fertility Soil
(Dickinson et al., 2015; Gutiérrez-Ginés et al., 2017). Although Leptospermum scoparium roots response to this dose of
it was not observed in this experiment, phosphorus and sulfur biosolids reflect an avoidance behavior (as explained by Robinson
can also be limiting in other soil types (Reis et al., 2017). The et al., 2009), locating most of the root biomass in the three first cm
nutrient requirement of L. scoparium is low. In this experiment, of the pot, compared with the rest of the treatments (Figure 6).
as well as in previous ones, N and P leaf concentration, even The concentration of biosolids in the pots with the highest rate
when supplemented with biosolids, is low compared with general of application was 12.4% (w/w). This is the same concentration
plant requirements for these nutrients: 1–5% for N, and 0.3–0.5% of the patch of biosolids in the rhizobox experiment, and might
for P (Marschner, 2012). This explains the lack of response explain the response of one of the replicates in the Patch
to the medium dose of biosolids (48 t/ha) compared with low treatment, which was not proliferating its roots inside the patch
dose of biosolids (16 t/ha) in the pot experiment; the nutrient until the last weeks of the experiment (Figure 3, Rep1). Although
requirements of L. scoparium were fulfilled with the lowest dose. that concentration of biosolids was detrimental when the whole
In the rhizobox experiment, it explains that the replicate that was root system was exposed to it (like in the pot experiment), their
not proliferating roots inside the patch of biosolids but next to it presence as a patch has not produced an increase in foliar Mn,
(Figure 3, Rep1), had a growth similar to the other two replicates or decrease in foliar K, even in the replicates that allocated a big
with root proliferation inside the patch of biosolids. The root proportion of their root system inside the patch. This indicates
foraging behavior explains the similar growth and nutrient status that the patch of biosolids produce mainly positive effects in
of L. scoparium regardless the distribution of biosolids in the soil, growth and nutrient status. The proportion of roots that are
either applied in the surface, mixed in the soil, or concentrated in not in contact with the biosolids might overcome the potential
a patch. toxicity, or salinity in the patch.
The reduced growth of L. scoparium at the highest rate of
biosolids application may be due to one or more factors acting
either together, or individually. The application of biosolids CONCLUSION
increased the soil salinity (Table 1 and Figure 4). Other
authors have highlighted the risk of increasing soil salinity Leptospermum scoparium’s roots foraged biosolids patches in
with high doses of sewage sludge (Reddy and Crohn, 2012; soil with root growth following a NO3 − gradient, which was
Pérez-Gimeno et al., 2016), which can cause a depletion in the limiting nutrient in the soil. This growth pattern did not
plant survival (Fuentes et al., 2010). L. scoparium has been require a signaling mechanism. Instead, more lateral roots and
previously considered salt tolerant (Cassaniti et al., 2009). with more branching are generated in the direction of the patch,
Our experiments revealed no increase in foliar Na in higher and inside the patch. This adaptation for capturing nutrients,
doses of biosolids. This indicates that the reduced growth is and low nutrient requirement, allows L. scoparium to benefit
not caused by Na accumulation, but may be due to water (more growth and better nutrient status) from small increases in
stress (induced by the elevated salinity), toxicity effects, or nutrient availability in the soil, provided either by small doses
competition with other nutrients. Although Cl− was not of biosolids, or by the NO3 − gradient produced by a patch
analyzed, its presence is probably linked to the high Na of biosolids. Regardless the type of application (in the surface,
concentration in biosolids. Cl− is usually easily bioaccumulated mixed in the soil, or concentrated in a patch), L. scoparium grew
compared with some cations (Gutiérrez-Ginés et al., 2016), better and had higher N concentration in leaves in the presence
which might be a reason for reduced growth in the high of biosolids than in control without biosolids. However, high
dose of biosolids. The Mn concentration in the leaves were doses of biosolids (∼12% w/w) hinders the growth and vigor
highest in the highest dose treatments: above 400 mg kg−1 , of the plants, which may be due to the effect of salinity, Mn
which can be considered phytotoxic (Chaney, 1989). High toxicity or NH4 + -induced K deficiency acting either together or
Mn concentrations and the toxicity symptoms in leaves (small individually. The roots of L. scoparium roots also respond to this
necrosis spots) could explain this as a reason for toxicity of stress avoiding the proliferation of roots into areas where these
high doses of biosolids application. Since all the nutrients negative effects prevail.
and elements analyzed were supplied by biosolids in higher
concentration than in soil (Table 1), their increase in plants
exposed to biosolids cannot be attributed to either their higher
DATA AVAILABILITY STATEMENT
concentration in amended soil, or the potential synergies between Datasets are available on request. The raw data (.xls and .jpg
those elements, such as Ca and Mg, or Cu, Zn, and Mn documents) supporting the conclusions of this manuscript will
(Marastoni et al., 2019). The concentration of K, on the contrary, be made available by the authors, without undue reservation, to
significantly decreased in the high dose treatments (3T and any qualified researcher.
3M, Table 2), despite its higher concentration in biosolids.
The high extractable NH4 + concentration in the biosolids
(Table 1) would explain an induced deficiency in K, especially AUTHOR CONTRIBUTIONS
in the early stages of growth before NH4 + in the biosolids
is nitrified to NO3 − . High NH4 + concentrations have been MG-G co-designed the experiments, coordinated the
linked to reduced plant uptake of K (Maathuis and Sanders, experimental methods, analyzed the results, and wrote the
1996). manuscript. EM participated in monitoring and harvesting
Frontiers in Plant Science | www.frontiersin.org 10 February 2019 | Volume 10 | Article 93Gutiérrez-Ginés et al. A Pioneering Species in Heterogeneous Low-Fertility Soil
the experiments, analyzing the results, and writing the financial support for her work at Lincoln University, New
manuscript. NL participated in the design of the experiments, Zealand, from Program Salvador de Madariaga of the Spanish
harvesting the experiments, soil analysis, and writing the MECD.
manuscript. RM participated in the collection of soils,
experimental design, setting up the experiments, and reviewed
the manuscript. JH participated in the experimental design and ACKNOWLEDGMENTS
reviewed the manuscript. ND participated in the experimental
design and reviewed the manuscript. BR participated in the We thank Christchurch City Council for providing the biosolids.
experimental design, the hypothesis, discussion of results, and We gratefully acknowledge the work of Nicole Hippenmeyer,
writing the manuscript. who took care of the plants in the greenhouse and collaborated
harvesting the two experiments, and that of Sarah Pirikahu, who
assisted with the statistical analysis.
FUNDING
This study was funded by the Centre for Integrated Biowaste SUPPLEMENTARY MATERIAL
Research which is supported by ESR Strategic Science
Investment Funding from the Ministry of Business, Innovation The Supplementary Material for this article can be found online
and Employment, New Zealand. MG-G held a fellowship at: https://www.frontiersin.org/articles/10.3389/fpls.2019.00093/
granted by Fundación Ramón Areces. EM thanks the full#supplementary-material
REFERENCES Grime, J. P. (2001). Plant Strategies, Vegetation Processes, and Ecosystem Properties.
Chichester: John Wiley & Sons.
Arduini, I., Godbold, D. L., and Onnis, A. (1994). Cadmium and copper Gutiérrez-Ginés, M. J., Hernández, A. J., and Pastor, J. (2016). Impacts of soil-
change root growth and morphology of Pinus pinea and Pinus pinaster soluble anions on wild and cultivated herbaceous species: implications for soil
seedlings. Physiol. Plant 92, 675–680. doi: 10.1111/j.1399-3054.1994.tb0 phytoremediation. J. Soil Sci. Plant Nutr. 16, 423–437.
3039.x Gutiérrez-Ginés, M. J., Robinson, B. H., Esperschütz, J., Madejon, E., McLenaghen,
Blakemore, L. C., Searle, P. L., and Daly, B. K. (1987). Methods for Chemical R. D., and Horswell, J. (2017). Potential use of biosolids to reforest degraded
Analysis of Soils. Lower Hutt, NZ: New Zealand Soil Bureau. areas with New Zealand native vegetation. J. Environ. Qual. 46, 906–914.
Bott, S., Tesfamariam, T., Candan, H., Cakmak, I., Römheld, V., and Neumann, G. doi: 10.2134/jeq2017.04.0139
(2008). Glyphosate-induced impairment of plant growth and micronutrient Hewitt, A. E. (2010). New Zealand Soil Classification. Lincoln: Manaaki Whenua
status in glyphosate-resistant soybean (Glycine max L.). Plant Soil 312:185. Press.
doi: 10.1007/s11104-008-9760-8 Hodge, A. (2004). The plastic plant: root responses to heterogeneous supplies
Cassaniti, C., Leonardi, C., and Flowers, T. J. (2009). The effects of sodium chloride of nutrients. New Phytol. 162, 9–24. doi: 10.1111/j.1469-8137.2004.
on ornamental shrubs. Sci. Hortic. 122, 586–593. doi: 10.1016/j.scienta.2009. 01015.x
06.032 Hodge, A. (2009). Root decisions. Plant Cell Environ. 32, 628–640. doi: 10.1111/j.
Chaney, R. L. (1989). “Toxic element accumulation in soils and crops: protecting 1365-3040.2008.01891.x
soil fertility and agricultural food-chains,” in Inorganic Contaminants in the Khare, D., Mitsuda, N., Lee, S., Song, W.-Y., Hwang, D., Ohme-Takagi, M., et al.
Vadose Zone, eds B. Bar-Yosef, N. J. Barrow, and J. Goldshmid (Berlin: (2017). Root avoidance of toxic metals requires the GeBP-LIKE 4 transcription
Springer), 140–158. factor in Arabidopsis thaliana. New Phytol. 213, 1257–1273. doi: 10.1111/nph.
Clough, T. J., Stevens, R. J., Laughlin, R. J., Sherlock, R. R., and Cameron, K. C. 14242
(2001). Transformations of inorganic-N in soil leachate under differing storage Maathuis, F. J. M., and Sanders, D. (1996). Mechanisms of potassium absorption by
conditions. Soil Biol. Biochem. 33, 1473–1480. doi: 10.1016/S0038-0717(01) higher plant roots. Physiol. Plant. 96, 158–168. doi: 10.1111/j.1399-3054.1996.
00056-6 tb00197.x
Dickinson, N., Marmiroli, M., Das, B., McLaughlin, D., Leung, D., and Robinson, B. Marastoni, L., Sandri, M., Pii, Y., Valentinuzzi, F., Brunetto, G., Cesco, S., et al.
(2015). Endemic plants as browse crops in agricultural landscapes of (2019). Synergism and antagonisms between nutrients induced by copper
New Zealand. Agroecol. Sustain. Food Syst. 39, 224–242. doi: 10.1080/21683565. toxicity in grapevine rootstocks: monocropping vs. intercropping. Chemosphere
2014.967438 214, 563–578. doi: 10.1016/j.chemosphere.2018.09.127
Dimkpa, C. O., Merten, D., Svatoš, A., Büchel, G., and Kothe, E. (2009). Metal- Marschner, P. (2012). Marschner’s Mineral Nutrition of Higher Plants. Cambridge:
induced oxidative stress impacting plant growth in contaminated soil is Academic Press.
alleviated by microbial siderophores. Soil Biol. Biochem. 41, 154–162. doi: 10. McLaren, R. G., Clucas, L. M., and Taylor, M. D. (2005). Leaching of
1016/j.soilbio.2008.10.010 macronutrients and metals from undisturbed soils treated with metal-spiked
Esperschuetz, J., Anderson, C., Bulman, S., Katamian, O., Horswell, J., Dickinson, sewage sludge. 3. distribution of residual metals. Soil Res. 43, 159–170.
N. M., et al. (2017a). Response of Leptospermum scoparium, Kunzea robusta doi: 10.1071/SR04109
and Pinus radiata to contrasting biowastes. Sci. Total Environ. 58, 258–265. McNickle, G. G., St. Clair, C. C., and Cahill, J. F. (2009). Focusing the metaphor:
doi: 10.1016/j.scitotenv.2017.02.134 plant root foraging behaviour. Trends Ecol. Evol. 24, 419–426. doi: 10.1016/j.
Esperschuetz, J., Balaine, N., Clough, T., Bulman, S., Dickinson, N. M., Horswell, J., tree.2009.03.004
et al. (2017b). The potential of L. scoparium, K. robusta and P. radiata to Moradi, A. B., Conesa, H. M., Robinson, B. H., Lehmann, E., Kaestner, A.,
mitigate N-losses in silvopastural systems. Environ. Pollut. 225, 12–19. doi: and Schulin, R. (2009). Root responses to soil Ni heterogeneity in a
10.1016/j.envpol.2017.03.042 hyperaccumulator and a non-accumulator species. Environ. Pollut. 157,
Fuentes, D., Valdecantos, A., Llovet, J., Cortina, J., and Vallejo, V. R. (2010). Fine- 2189–2196. doi: 10.1016/j.envpol.2009.04.015
tuning of sewage sludge application to promote the establishment of Pinus Olsen, S. R., Cole, C. V., Watanabe, F. S., and Dean, L. A. (1954). Estimation
halepensis seedlings. Ecol. Eng. 36, 1213–1221. doi: 10.1016/j.ecoleng.2010. of Available Phosphorous in Soils by Extraction with Sodium Bicarbonate.
04.012 Washington, D.C: U. S. Dept. of Agriculture.
Frontiers in Plant Science | www.frontiersin.org 11 February 2019 | Volume 10 | Article 93Gutiérrez-Ginés et al. A Pioneering Species in Heterogeneous Low-Fertility Soil Pérez-Gimeno, A., Navarro-Pedreño, J., Almendro-Candel, M. B., Gómez, I., and Stephens, J. M. C., Molan, P. C., and Clarkson, B. D. (2005). A review of Jordán, M. M. (2016). Environmental consequences of the use of sewage sludge Leptospermum scoparium (Myrtaceae) in New Zealand. N. Z. J. Bot. 43, compost and limestone outcrop residue for soil restoration: salinity and trace 431–449. doi: 10.1080/0028825X.2005.9512966 elements pollution. J. Soils Sediments 16, 1012–1021. doi: 10.1007/s11368-015- Watson, A., and O’Loughlin, C. (1985). Morphology, strength, and biomass of 1288-y manuka roots and their influence on slope stability. N. Z. J. For. Sci. 15:12. Reddy, N., and Crohn, D. M. (2012). Compost induced soil salinity: a new Wenzel, W. W., Wieshammer, G., Fitz, W. J., and Puschenreiter, M. (2001). Novel prediction method and its effect on plant growth. Compost Sci. Util. 20, 133–140. rhizobox design to assess rhizosphere characteristics at high spatial resolution. doi: 10.1080/1065657X.2012.10737038 Plant Soil 237, 37–45. doi: 10.1023/a:1013395122730 Reis, F. V. P., Gutiérrez-Ginés, M. J., Smith, C. M. S., Lehto, N. J., and Robinson, Wicaksono, W. A., Jones, E. E., Sansom, C. E., Perry, N. B., Monk, J., Black, A., B. H. (2017). Mânuka (Leptospermum scoparium) roots forage biosolids in low et al. (2017). Indigenous bacteria enhance growth and modify essential oil fertility soil. Environ. Exp. Bot. 133, 151–158. doi: 10.1016/j.envexpbot.2016. content in Leptospermum scoparium (mânuka). N. Z. J. Bot. 55, 306–317. 10.012 doi: 10.1080/0028825X.2017.1330272 Robinson, B. H., Bañuelos, G., Conesa, H. M., Evangelou, M. W. H., and Schulin, R. (2009). The phytomanagement of trace elements in soil. Crit. Rev. Plant Sci. 28, Conflict of Interest Statement: The authors declare that the research was 240–266. doi: 10.1080/07352680903035424 conducted in the absence of any commercial or financial relationships that could Ruffel, S., Krouk, G., Ristova, D., Shasha, D., Birnbaum, K. D., and Coruzzi, be construed as a potential conflict of interest. G. M. (2011). Nitrogen economics of root foraging: transitive closure of the nitrate–cytokinin relay and distinct systemic signaling for N supply vs. Copyright © 2019 Gutiérrez-Ginés, Madejón, Lehto, McLenaghen, Horswell, demand. Proc. Natl. Acad. Sci. 108, 18524–18529. doi: 10.1073/pnas.110868 Dickinson and Robinson. This is an open-access article distributed under the terms 4108 of the Creative Commons Attribution License (CC BY). The use, distribution or Solomon-Wisdom, G., Ramsey, M. H., and John, E. A. (2015). The effects of reproduction in other forums is permitted, provided the original author(s) and the more realistic forms of lead heterogeneity in soil on uptake, biomass and root copyright owner(s) are credited and that the original publication in this journal response of two brassica species. Adv. Res. 5, 1–26. doi: 10.9734/AIR/2015/ is cited, in accordance with accepted academic practice. No use, distribution or 17975 reproduction is permitted which does not comply with these terms. Frontiers in Plant Science | www.frontiersin.org 12 February 2019 | Volume 10 | Article 93
You can also read