Assistance Tools for Operational Fuel Efficiency
←
→
Page content transcription
If your browser does not render page correctly, please read the page content below

Assistance Tools for Operational Fuel Efficiency
       Heikki Hansen, FutureShip GmbH, Potsdam/Germany, heikki.hansen@futureship.de
      Malte Freund, Germanischer Lloyd AG, Hamburg/Germany, malte.freund@gl-group.com

Abstract

In times of increasing fuel prices the operational fuel efficiency of ships is becoming more and more
important. The ECO-Assistant is a modular tool for optimising different aspects of a Ship’s
operational fuel efficiency. This paper discusses two ECO-Assistant modules; the ECO-Trim-
Assistant to allow the crew to sail the ship at optimum trim all the time by calculating the optimum
trim angle for different operating conditions and the ECO-Energy-Assistant which enables the crew
to monitor the energy consumption of the different consumers such as main and auxiliary engines,
generators and pumps. The paper shows the fuel savings potential of utilising the ECO-Assistant
onboard a ship. With assistance tools such as the ECO-Assistant the operational fuel efficiency of
ships in service can be improved significantly without making expensive modifications to the vessel.

1. Introduction

In times of increasing fuel prices and environmental awareness the fuel efficiency of ships is
becoming more and more important. For newly built ships it is becoming essential to optimise the fuel
efficiency wherever possible to ensure competitiveness in the market. Even for existing ships
modifications to increase fuel efficiency can have short payback periods. Such modifications can be
for example the main engine modernisation to increase its fuel efficiency or replacing the bulbous
bow with a new shape to reduce resistance for slow steaming operation. Although the payback period
for such modifications might be short, capital investment is required to realise the modifications.
Another option to increase the fuel efficiency without modifications to the vessel and hence requiring
much less capital investment is to consider the operational efficiency.

The operational efficiency has many aspects which can be investigated to reduce fuel consumption.
With the goal of providing the crew with one user-friendly tool to monitor and improve the
operational fuel efficiency of the vessel, the idea of the ECO-Assistant was born. The ECO-Assistant
is developed as a modular workbench environment to which modules for different functionally can be
added. It offers a flexible tool to the costumer to which modules can be added as they become
available or be configured depending on the customer’s preferences. The ECO-Assistant is a new
initiative of FutureShip GmbH, a subsidiary of Germanischer Lloyd AG offering advanced
engineering consultancy services. The tool is under development and this paper introduces the first
two ECO-Assistant modules, the ECO-Trim-Assistant and the ECO-Energy-Assistant.

The ECO-Trim-Assistant is designed to inform the crew about the optimum trim for the vessel,
considering the current operation condition. The trim has a significant effect on the resistance and
hence the fuel consumption of the vessel. The optimum trim changes depending on the operating
condition of the vessel which is taken into account by the ECO-Trim-Assistant. It is the first module
that has been delivered to customers and it is already used onboard a variety of ship types. The second
module presented in the paper is the ECO-Energy-Assistant, which is currently developed and tested.
It enables the crew to monitor the energy consumption of the different consumers such as main and
auxiliary engines, generators and pumps. Through the measured energy consumption, the efficiency
of each component can be assessed. With this information inefficient consumers can be identified by
the crew, problems can be detected and defects can be corrected.

2. Trim Assistant

The aim of the ECO-Trim-Assistant is to help the crew to sail their vessel at optimum trim for the
current operating condition. The influence of trim on fuel consumption is known for quite some time.

356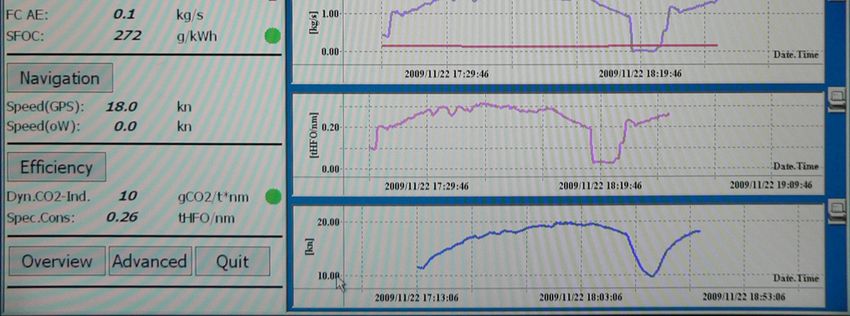
However, there is no global optimum trim for a vessel. Besides the specific hull shape the optimum
value depends on the operating parameters such as speed, displacement and water depth.

Unlike most other trim assistance tools, the ECO-Trim-Assistant does not use logged operational data
to calculate the optimum trim, but utilises a comprehensive database of ship specific resistance data
for different operating conditions to compute the optimum trim. The ECO-Trim-Assistant can be seen
as a product consisting of two parts. The first part consists of generating a comprehensive database of
ship specific data for the different operating conditions. The second part of the product is the ECO-
Trim-Assistant module within the ECO-Assistant workbench environment which makes the optimum
trim information available to the crew onboard the vessel in a simple format.

Compared to trim assistance tools based on logged operational data, the ECO-Trim-Assistant does not
require interfacing with the onboard systems and no sensors to monitor operational parameters are
required. The ECO-Trim-Assistant can be installed on any computer on the vessel so that no
additional hardware and measurement equipment is required, which makes the tool very cost
effective. The tool solely relies on the database input and the operational parameters entered by the
crew. Of the operational parameters on which the optimum trim depends, the ECO-Trim-Assistant
considers speed, displacement and water depth. Other secondary factors such as seaway are not
evaluated by the tool and are therefore not required for input. It should be kept in mind that the ECO-
Assistant provides information for the most fuel efficient sailing condition and naturally other
constraints such as bending moment and cargo issues must still be taken into consideration by the
crew and might not allow to utilise the full potential.

Vessel specific hydrodynamic data is required for the full range of operational conditions specified by
the parameters speed, displacement (mean draft) and water depth. This results in a four-dimensional
trim matrix. A typical parameter range of a trim matrix is shown in Table I. For this example 3360
data points are required to fill the trim matrix. It is therefore not economically to obtain the full trim
matrix of the ship specific performance data through towing tank tests. Instead, an advanced
automated simulation process is utilised.

2.1 Trim matrix analysis method

A trim matrix typically consists of more than 3000 data points. When choosing finer parameter
spacings, trim matrices may easily have 5000 to 10000 data points. For the parameters speed, mean
draft and water depth, the trim matrix can be defined as a rectangular domain. The feasible trim range
of a vessel changes with its displacement (mean draft) as constraints such as minimum propeller

                                                                      16

                                                                      14

                                                                      12
        Table I: Typical trim matrix
Parameter     Range           Data points                             10
                                                     Mean draft [m]

Speed            12 – 26 kn              8                            8

Mean draft       9 – 14.5 m              7
                                                                      6                                   Trim
Water depth      45 – 150 m              6                                                                Linear (Trim min)
                                                                      4                                   Linear (Trim max)
Trim             -5.5 – 7.9 m           10
                                                                      2

                                                                      0
                                                                           -6   -4   -2        0       2       4        6      8
                                                                                      Trim [m] (+ve bow up)

                                                                       Fig. 1: Trim range change with mean draft

                                                                                                                              357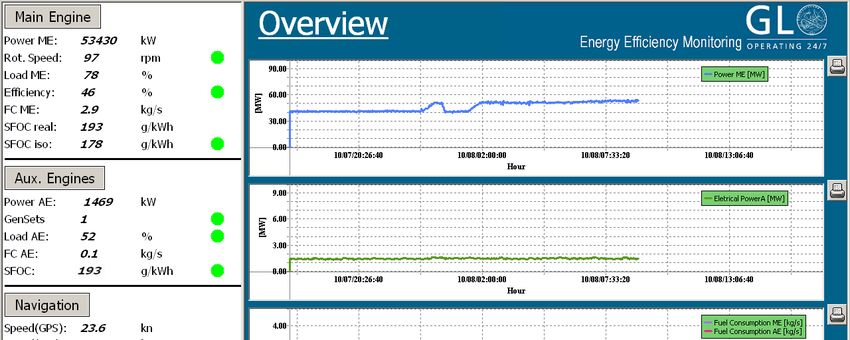
immersion and freeboard limitations need to be considered. The trim range is therefore defined as a
function of mean draft as shown in Fig. 1.

To allow large numbers of simulations to be conducted, the automated process established for the
fully parametric geometric hull shape optimisation, e.g. Hochkirch and Bertram (2009), is used.
Although no hull shape optimisation is conducted when calculating the trim matrix, the automated
process for this task interfaces an optimisation tool with CFD codes and hydrostatic calculation
software. The in-house optimisation tool FS-Optimiser is employed to drive the simulation process of
exploring the trim matrix. FS-Optimiser and the other programs employed during the automated
simulation process have a graphical interface and can also be run in batch mode for time consuming
numerical computations on main frame computers. The programs can run in unlimited threading
mode to make full use of parallel computing environments like HPC (high performance computing)
clusters.

For calculating the hydrostatic properties FS-Equilibrium, the in-house workbench for analysis of
equilibrium conditions of floating bodies in six degrees of freedom, is utilised. For this application,
only a small subset of the functionality of FS-Equilibrium is employed.

For the performance assessment two types of flow codes are applied: A general purpose Rankine
panel code, which solves the boundary value problem of potential theory and a fully viscous flow
code dealing with the Reynolds-Averaged-Navier-Stokes equations (RANSE) in the entire flow
domain. Both codes treat the flow around the ship hull establishing its dynamic equilibrium position
with respect to trim and sinkage and computing the formation of the non-linear ship wave system
while sailing. Special propeller models are implemented to simulate a self-propulsion test by
balancing longitudinal forces and simulating the propeller effects on the ship’s dynamic trim, its
suction at the aftbody and its influence on the stern wave system. Lifting surfaces like keel, rudder,
fins and stabiliser systems may be modelled as well.

The trim matrix is built primarily using the potential flow code outlined in section 2.1.1 to predict the
performance. In the vast majority of cases resilient results are obtained. However, highly viscous
effects such as an extensive recirculation zone at the stern cannot be modelled correctly. In such cases
our viscous RANSE flow code takes effect for cross-comparison, either validating the potential flow
based prediction or calibrating it. Full-scale viscous free-surface flow computations consume
computational resources of orders higher than potential flow based computations. Hence, they are so
far limited to a few prominent computational cases. Whenever available, the simulation results are
also validated against existing towing tank data of tested operating conditions.

For the numerical simulations, an electronic model of the vessel’s hull is required. In most cases the
ship owner or charterer orders the ECO-Trim-Assistant and a digital hull model might not be in the
client’s possession and might not be obtainable from the shipyard. In such cases a digital hull model is
recreated from physical drawings using the Computer Aided Engineering (CAE) system
FRIENDSHIP-Framework, Abt and Harries (2007).

2.1.1 Rankine panel code FS-Flow

A Rankine panel code is fast, robust and reliable and is the tool of choice for computation of the trim
matrix. The in-house code FS-Flow has special interfaces with the other tools discussed. FS-Flow
uses a panel representation of the hull (including lifting surfaces if applicable) and a portion of the
free water surface. The source strength on each panel is adjusted to fulfil the various boundary
conditions, namely zero normal velocity on the hull and kinematic and dynamic boundary conditions
on the water surface. Lifting surfaces like keel, rudder and fins (e.g. in case of sailing yachts or
stabiliser systems) are modelled in FS-Flow by lifting patches which carry in addition to the source
panels also a dipole distribution, enforcing a Kutta condition at the trailing edge. The ship’s dynamic
floating position and the wave formation are computed iteratively. After each iteration step, the
geometry of the free surface is updated and the sinkage, trim, heel and propeller thrust of the vessel

358
are adjusted. The calculations are considered to be converged when all forces and moments are in
balance and all boundary conditions are fulfilled. Having determined the source strengths, the
pressure and velocity at each point of the flow field can be calculated. The wave resistance can be
either computed by integrating the pressure over wetted surface of the hull or from wave cut analysis,
Heimann et al. (2008).

The viscous resistance component is considered in terms of a friction line in combination with the
wavy wetted hull surface and a form factor is determined either from integration of the local velocity
perturbations along the hull or by an accompanying boundary layer computation. Adding a correlation
or roughness component and the wind resistance, both of which are case dependent, the total
resistance is obtained. Finally, balancing the total resistance with the propeller thrust force the self
propulsion condition is established yielding the required power for a certain operation condition. The
power value, usually related to the machine or MCR power, enters the trim matrix.

2.2 Trim Assistant application

The ECO-Trim-Assistant application supplies the results of the complex analysis to the crew in an
easy to use format. The ECO-Trim-Assistant application is a stand-alone tool and does not require
interfacing with the ships systems and sensors. It can therefore be installed on any Windows based
computer and no hardware installation is required. The parameters defining the operational condition
are required by the tool as input and need to be entered by the crew.

                                                     Grey    Green     Yellow     Red

                             Fig. 2: ECO-Trim-Assistant user interface

                                                                                                    359
Fig. 2 shows the main user interface window of the ECO-Trim-Assistant application. The operational parameters required as input are the vessel’s speed, the water depth (if it is confined) and the loading condition. The loading condition can be specified by entering the displacement or the draft at the aft and forward perpendicular (AP and FP) loading marks. In practice the operational parameters are often already entered in port when planning the next journey so that entering them manually is required and measuring them through sensors would not work. Based on the input parameters the trim curve for the operating condition is displayed and the optimum trim is computed as shown in Fig. 2. The plot displays the approximate difference in power and fuel consumption for different trims relative to the optimum trim. The green plot background denotes the trim range for which the required power is less than 1% higher than at optimum trim. The yellow background indicates that the required power is between 1% and 3% higher and the red background that the difference is more that 3%. Trims in the grey background range have not been analysed for the trim matrix as they are considered to be not feasible. The optimum trim is also displayed as a value together with the corresponding aft and forward draft for the specified displacement. The draft and trim values entered and displayed are that equivalent static values for the ship at rest since they can be measured and calculated more readily onboard the vessel. The hydrodynamic analysis when computing the trim matrix is conducted considering the dynamic sinkage and trim of the vessel. To increase the crew’s economical and ecological awareness the potential fuel oil and CO 2 savings, when sailing at the optimum instead of the current trim, are calculated as well. The current trim is calculated form the aft and forward perpendicular draft input values or can be entered directly. 2.3 Optimum trim variation The variation of the optimum trim and the associated potential fuel savings are discussed in this section based on sample calculations for a container vessel. Fig. 2 shows the ECO-Trim-Assistant graphical interface for the vessel in the design condition. As can be expected the optimum trim is relatively close to level trim. Negative trim values denote bow down trim. For clarity the ship profile in the graphical interface in Fig. 2 shows the vessel’s trim. Despite of the modest difference, 1.2% power can be saved by changing from level trim to optimum trim. This corresponds to a fuel saving of approximately 2.2 t per day and a reduction in CO 2 emissions of 7.4 t per day. Even in the case of this modest trim adjustment, the payback period of the system would be less than two months. For off- design operating conditions, the potential savings are much higher. Fig. 3 shows the vessel operating at the same speed as in Fig. 2 but with 1 m more draft. The optimum trim is approximately 1.6 m further bow down. Compared to level trim this decreases the required power by 8.7%. It equates to potential fuel saving of 18 t per day and a reduction in CO 2 emissions of 59.4 t per day. For the operating conditions in Fig. 2 and 3 the trim curve shows a parabolic shape with a clear optimum trim. The shape of the trim curve can however be more complex as shown in Fig. 4 for a slow steaming operating condition. The trim curve has two trim ranges where the required power is within 1% of the minimum required power. In between the two ranges close to level trim the required power is more than 3% higher than the minimum. Two effects, which have particular influence on the vessel’s resistance, come into play here. The optimum immersion depth of the bulbous bow results in a resistance minimum for a certain bow down trim. The optimum immersion depth is primarily influenced by the vessel’s speed due to the changing wave pattern. For different displacements (mean drafts) a constant immersion depth results in different trims. For the example in Fig. 4, the optimum immersion depth cannot be achieved and the optimum trim is at the trim range boundary. From the shape of the trim curve it can be expected that more bow down trim could further reduce resistance. However, the trim range is chosen to reflect the hydrodynamically feasible trim range and more bow 360
Fig. 3: Deep water trim curve for mean draft of          Fig. 4: Deep water trim curve for slow steaming
         13.5 m and vessel speed of 24 kn                               operating condition

down trim would, for this loading condition, result in the immersion depth of the propeller becoming
too small.

The second effect producing a local required power minimum at a bow up trim of approximately 4 m
in Fig. 4 is the optimum transom height which best fits the stern wave system. Fig. 4 shows the crew
on board the vessel the optimum trim for this operating condition and that there is a second local
minimum at approximately 4m bow up trim which only requires 0.3% more power. This equates to an
approximate difference in fuel consumption of only 0.3 t per day so that either trim range could be
chosen depending on the crew’s preference due to other vessel’s particulars such us cargo distribution,
longitudinal bending and manoeuvrability. It also shows the crew that it is most inefficient to operate
the vessel between level trim and 1.9 m bow up trim.

In addition to the speed and the displacement of the vessel, the water depth is also considered in the
trim matrix to account for changes to the optimum trim due to confined water operation. Fig. 5 shows
the trim curves for six water depths for the vessel operating at design speed. The water depths are

     78
                   h/T = 3.7
     76            h/T = 5.4
                   h/T = 7.0
     74            h/T = 8.6
                   h/T = 10.3
     72            h/T = 12.0
 Power

     70

     68
   2%
    66

     64
       -3.5   -3           -2.5    -2     -1.5   Bow -1
                                                      down trim-0.5   Level0 trim   0.5Bow up trim
                                                                                                1    1.5   2

                        Fig. 5: Trim curves for different water depths at design speed

                                                                                                           361
h/T = 12.0
Reduced stern wave system due to beneficial
wave interference in shallow water
h/T = 12.0
100
98 h/T = 12.0
h/T = 3.7
96
94 h/T = 3.7
92
h/T = 3.7
Power
90
88
86 h/T = 3.7
h/T = 5.4
84 h/T = 7.0
2% h/T = 8.6
82 h/T = 10.3
h/T = 12.0
80
-3.5 -3 -2.5 -2 -1.5 -1
Bow down trim -0.5 Level0trim 0.5Bow up trim
1 1.5 2
Fig. 6: Trim curves for different water depths at maximum speed
given as water depth to draft ratios (h/T). For level trim the power requirement increases with
reducing water depth. The increase in required power between a water depth of h/T = 12 and 3.7 is
approximately 1.5%. The influence of water depth on the required power gets more significant as the
vessel trims bow up. For bow down trims the increase in required power due to a reduction in water
depth gets less significant and eventually reverses and the resistance decreases in shallow water. As a
consequence the optimum changes with water depth towards a more bow down trim. In this case
however, the influence on the required power is small.
The resistance change due to shallow water significantly depends on the operating condition. Fig. 6
shows the trim curves for different water depths at maximum speed instead of design speed (Fig. 5).
The general trends of the trim curves at the two different speeds are similar, but the resistance
reduction in shallow water for bow down trims is much more significant at maximum speed. At the
optimum trim for h/T = 3.7, the required power is 5% less compared to deep water operation at the
same trim. Fig. 6 also shows wave height contour maps for three trims at water depths of h/T = 12 and
3.7. For all three trims an increased wave trough can be seen along the hull as a result of the squat
effect. At the shown bow down trim the squat effect results in beneficial wave interference so that the
stern wave system is reduced. For this operating condition the optimum trim changes with water depth
by approximately 1.4 m. The required power can be reduced by approximately 1% if this change in
optimum trim is considered in shallow water.
3. Energy Efficiency Monitoring Tool (EEMT)
Energy efficient operation of the vessel does not end with hydrodynamic optimisation. Aside for the
savings that can be achieved through trim optimised operation of the vessel, the operation of the
machinery aboard can be considered crucial for efficient vessel operation.
As a basis for optimisation, the instantaneous energy consumption for propulsion, auxiliaries, and
other consumers has to be surveyed. The current situation aboard most commercial vessels is that fuel
362consumption is analysed over relatively long time periods, usually one voyage. As a global efficiency
metric, the International Maritime Organization (IMO) proposes the Energy Efficiency Operational
Index (EEOI) defined by
CO2
EEOI =
t ⋅ km
where
CO 2 = Total CO2 emission emitted from the vehicle within the period
t·km = Total actual t-km transported within the same period.
This long-term data is suited for high level consumption analysis, e.g. as average over one year, and
general transport efficiency evaluation. The long-term monitoring parameter has only limited
functionality for in-depth analysis of operation and consumption of main engine and auxiliaries in
different operational modes and conditions and implementation of improvements. A well loaded
vessel with inefficient machinery and operation cannot be distinguished from a highly efficient vessel,
which happens to be only partly loaded. Therefore this is only a key performance indicator for the
transported goods, but does not allow for deeper efficiency evaluation of the vessel itself. Efficiency
of the energy conversion in the systems can only be evaluated on microscopic or machinery level.
Only suitable tools for detailed analysis can be utilised for specific technical improvements. The
presented Energy Efficiency Monitoring Tool (EEMT) is integrated in the ECO-Assistant workbench
as the ECO-Energy-Assistant and gives an easy-to-use tool for quick perception of the current energy
consumption and its time history. EEMT enables the display of the propulsive and electric power
usage onboard, both instantaneous and as a time history over a given time period. The efficiency in
energy conversion of the machinery gives additional insight into how the machinery operation can be
optimised.
The EEMT is based on the simulation model of the ship machinery as presented in the COMPIT 2009
paper by Freund et al. (2009). On board, mechanical power produced by the main engine for
propulsion and electrical power generated by the auxiliary engines are measured in combination with
the ambient conditions and the ship’s navigational data. Fuel consumption and efficiency of energy
conversion are obtained from the simulation model of the machinery, using the measurement data as
input. Additional consumers can optionally be included in the simulation, enabling a deeper insight
into the operation. For example, by including the auxiliary systems of the main engine, the effects of
controllable pumps in cooling water systems can be quantified or the availability and demand of
steam from waste heat recovery can be compared. This leads to the quantification of savings through
retrofits and the potential savings in the actual operation of the vessel.
EEMT yields the consumption and efficiency time history for each energy converter. The history is
available onboard at the EEMT display for quick evaluation of changes and stored in a database for
analysis in retrospect onboard or ashore.
3.1 EEMT as short-term efficiency analysis tool
The onboard tool display is developed for graphical presentation of the current consumption,
efficiency of energy conversion, and the respective timelines over arbitrary time periods. The
graphical user interface of the pilot tool is displayed in Fig. 7. Instantaneous data are presented in the
left frame in four main categories (1) for main engine, auxiliary engine, navigational and ship
efficiency data. Each section can be called by mouse click, opening the respective timelines of
variables of that category in the right frame. Additionally, an overview over the most important
timelines can be opened in the right frame. For quick analysis of operation, traffic light symbols for
the status are initialised (2). Deviations from predefined thresholds are displayed by colour changes
from green (system OK) over yellow (attention) to red (check system for reason).
3632
1
3
Current data view Time lines of the data
Fig. 7: Pilot onboard tool display, 1: subsections for detailed view, 2: traffic lights for quick
notification, 3: Sankey diagram of energy flow
In Fig. 8 a screenshot of the pilot tool during sea passage is displayed. The overview window in the
right frame displays the timelines of main engine power, electrical power, fuel oil mass flow,
consumption per nautical mile and ship speed (from top). In the left frame, the instantaneous values
are displayed, with traffic lights indicating a warning for high main engine power demand (indicating
increased ship resistance) and low efficiency of electrical power generation. In this case, the high
resistance is caused by shallow waters. The second traffic light indicates, from an efficiency point of
view, unnecessary use of a second diesel generator, causing low load of 33% on each generator set
and therefore low efficiency. The indicator calls for the evaluation if running the second generator set
is necessary at that moment.
Fig. 8: Screenshot of the pilot installation during sea passage
3643.2 Benefits for crew and ship management
The development of awareness for energy efficient ship operation can be considered crucial for
success in consumption reduction (Cazzulo (2009)). Awareness can be developed if consequences of
actions in operation are instantly displayed and the actual, instantaneous consumption of the
machinery is clearly presented to the crew. Increases of power demand over time are visible in the
timelines. By displaying this change, the crew has a tool to evaluate if this increase is caused by a
necessary change in operation or external conditions, or by faulty operation of machinery.
Availability of consumption data in combination with cargo and navigational data enables the exact
determination of a cargo’s carbon footprint. The Energy Efficiency Operational Index can be
calculated online and displayed dynamically as variation over time, compare Fig. 9. This displays the
ship’s performance in variation of the EEOI under varying operational modes and external influences,
fluctuating by up to 20% of the mean value during the sea passage. By summing up these data, the
annual IMO EEOI is automatically acquired. By shore-based use of the measured data, ship
management and external consultants can analyse operational patterns and optimise them accordingly
if required.
4. Conclusions
There is significant potential to improve the operational efficiency of ships and assistance tools can
provide valuable information to achieve this. Two examples have been discussed in this paper; the
ECO-Trim-Assistant and the ECO-Energy-Assistant (or EEMT). Together they give the crew a
powerful tool for energy saving and direct feedback to their actions, enabling the crew to develop
awareness of the energy efficiency of the current vessel operation..
A typical operational condition has been presented where the ECO-Trim-Assistant shows that the
efficiency can be increased by 8.7% through sailing with the optimum trim instead of level trim. For
other operating conditions the savings potential can be even higher.
Operational data, collected by the EEMT, is a starting point of a knowledge database for statistical
analysis of ’best business practice’, which requires comparable ship operations. Over time the
knowledge database grows and turns into a more and more powerful tool for quick assessment of the
energy efficiency of a ship’s machinery system. Additionally, the collected data can serve as a starting
point for the re-design of the vessel’s operation and systems, including specific constraints which can
be determined in dialogue between ship operator and analyst consultant.
Fig. 9: Timeline of the dynamic EEOI during 8 days of sea passage
365Acknowledgements The authors thank there colleagues at FutureShip GmbH for their support, in particular Volker Bertram, Justus Heimann and Karsten Hochkirch. References ABT, C.; HARRIES, S. (2007), A new approach to integration of CAD and CFD for naval architects, 6th Int. Conf. Computer Applications and Information Technology in the Maritime Industries (COM- PIT 2007), Cortona, pp.467-479. CAZZULO, P. (2009), Controlling costs while maintaining performance in the face of weak markets, Shipping China Energy 2009, April 2009, Shanghai FREUND, M.; WÜRSIG, G.-M.; KABELAC, S (2009), Simulation Tool to Evaluate Fuel and Energy Consumption, 8th International Conference on Computer Applications and Information Technology in the Maritime Industries (COMPIT 2009), Hungary HEIMANN, J.; HUTCHISON, B. L.; RACINE, B. J. (2008), Application of the Free-Wave Spectrum to Minimize and Control Wake Wash, SNAME Annual Meeting & Expo, Houston HOCHKIRCH, K.; BERTRAM, V. (2009), Slow Steaming Bulbous Bow Optimization for a Large Containership, 8th Int. Conf. Computer Applications and Information Technology in the Maritime Industries (COMPIT 2009), Budapest 366
You can also read