Global Warming and Our Energy Future - Dennis Silverman Physics and Astronomy U C Irvine www.physics.uci.edu silverma/ gwenergy
←
→
Page content transcription
If your browser does not render page correctly, please read the page content below
Global Warming and Our
    Energy Future
        Dennis Silverman
      Physics and Astronomy
            U C Irvine
   www.physics.uci.edu/~silverma/
          gwenergy.ppt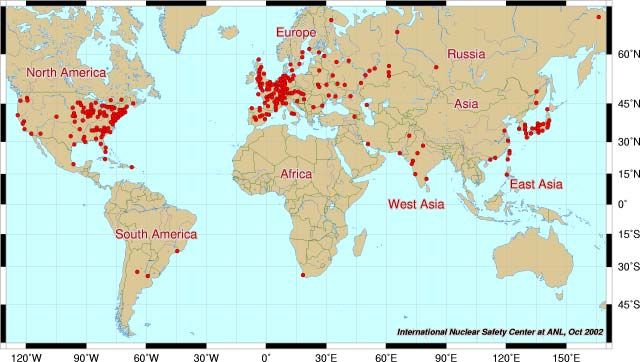
Our Energy Future
I.     Future of Fossil Fuels
II.    Alternate Energy Sources
III.   Worldwide Nuclear Power
IV.    Global Warming
I. Future of Fossil Fuels
•   Petroleum
•   Natural Gas
•   Coal
•   Oil Shale and Tar Sands
•   CO2 Emissions
U.S. 20 Year Projections of Energy Use
 in Quads (US Uses 100 Quads/year)
Petroleum Fuel Future
• US oil production peaked around 1970.
• US energy consumption is increasing at 1.5% a year.
• The US currently imports 60% of its oil.
• Proven world oil resources are about 2,000 billion barrels
  - about half of this has already been used.
• Unproven resources may boost this to 3,000-4,000
  billion barrels total.
• At the peak the price rises steeply and consumption
  must fall, perhaps leading to recession.
• However, we may see a very flat, long peak where
  prices rise, bringing in new oil resources to keep
  production flat, and efficiency and conservation setting in
  to hold demand flat to a fixed supply.
Peaking of World Oil Production
   Hirsch Report: Feb. 2005
World Oil Growth and Decline - Pessimistic
 2,000 Bbl resources (1,000 Bbl reserve)
Optimistic 3,000 Bbl of oil total resources.
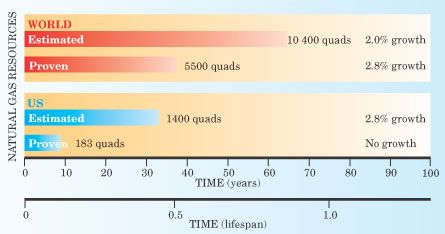
US Geological ServiceUS and World Natural Gas • US demand growth is 3% per year. • A shortage now exists in the US and plans for Liquid Natural Gas (LNG) terminals for imports exist around the country (Ventura, Long Beach, Baja California, up to 40 sites). • The Federal Government wants the final say on allowing siting of these terminals. • LNG could grow from 1% now to 20% by 2020. • The graphs are for the time the supply will last. • The lighter color is less likely than the darker part.
Natural Gas
Physics Today, July 2004,
   by Paul B. Weisz.
World Oil and
Natural Gas
Reserves
• Total reserves,
with natural gas reserves
in equivalent
billion barrels of
Oil (bbl).
• World oil consumption
is 30 bbl/year.
• Left out Canadian tar
sands at 179 bbl oil.
• US has 22 bbl oil, and
produces 2.0 bbl/year
and would last only 11
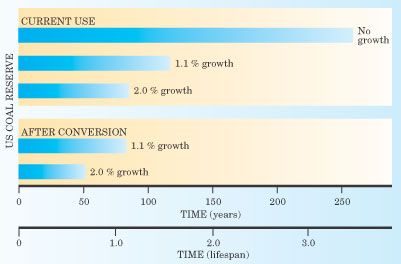
years.US Coal Supply • The total US coal reserve is 5700 Quads. • The current rate of use is about 20 Quads per year. • Population growth will reduce its longevity of 250 years with no growth • Conversion to motor fuel uses 2 Quads of coal to generate 1 Quad of fuel plus the additional CO2 emission. • Conversion to hydrogen fuel uses even more. • The graph assumes 54% of underground coal is recoverable. • Estimates are for various growth rates of use.
US Coal Lifetime
World Coal Reserves
Fossil Fuel Future Summary

• Oil, Natural Gas, Shale Oil, and Coal produce CO2.
   – Carbon sequestration requires an extra 30% of power and needs
     research. FutureGen $1 billion research plant.
• Oil is needed for transportation fuel
   – Too expensive for electricity generation
   – Total world reserve of oil is a large question, uses politically
     motivated estimates of individual countries and industry secrets
   – Reserves: About 50 years with growth in use
   – 2/3 is in the Middle East
• Coal may last 100 years with growth in usage, but only
  70 years if partly converted to replace oil
• Current rate of use of fossil fuels will increase worldwide
• U S proposed climate technology program
Short Term Optimum • The best way to hold down CO2 increases is to remove fossil fuels from electricity generation, but just use gasoline for transportation and natural gas for heating. • Since ½ of US electricity comes from coal which generates twice as much CO2 per energy unit as does natural gas, we should switch to natural gas. This, however, involves massive imports. • We need increases in alternate energy sources such as hydro, nuclear, wind and solar. • However, coal and LNG will be cheaper than nuclear, so a sacrifice is required here. • Solar cells are very expensive. Direct solar water heating is much more efficient. • We also need increases in energy efficiency and conservation. • This especially includes high mileage vehicles.
Comparative Projected Vehicle Fuel
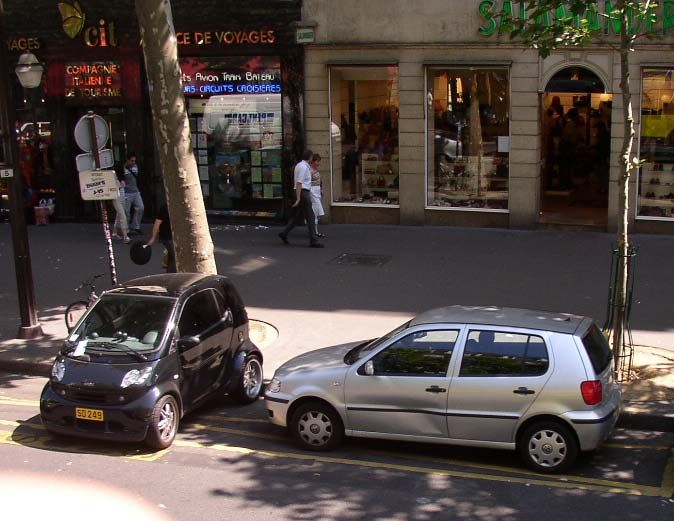
EconomiesParis: Energy efficient small car
and convenient parkingII. Alternative Energy Sources • Hydrogen Transmission • Fusion Reactors • Renewables: – Hydroelectric – Wind Power – Solar Power – Biomass, Ethanol – Geothermal
The Hydrogen Dream
•   Hydrogen is a transmitter of energy, not a source:
     – Must use fossil fuel (creating CO2 ) or high temperature reactors
       or solar or electrical power to create H2 -- needs research
     – Need fuel cell technology improvement (current $3000/kw vs
       $30/kw for a gas engine).
     – Fuel cells combine 2H2 with O2 to make 2H2O.
     – Yet fuel cells are 60% efficient compared to 22% for gas and
       45% for a diesel engine.
     – Catalysts in fuel cells are expensive and can be poisoned by
       impurities.
     – Electric cars can do similar things with cheap motors and already
       established electricity distribution. Range of 50 miles can be
       accommodated by work or shopping charging stations, or higher
       tech batteries.
California Hydrogen Dreaming – Need to establish a distribution system on as large a scale as for gasoline – California is establishing a Hydrogen highway of 200 stations for about $100 million – Current cost of hydrogen is 4 times that of gasoline – Compressed hydrogen tank has a range of only 200 miles (50 for Arnold’s Hummer demo) – H2 will probably be stored in a smaller volume molecule like NaBH4 – Won’t be practical for 30 years – Physics Today "The Hydrogen Economy"
Fusion Reactors
• Fusion easiest for Deuterium on Tritium
  in a high temperature plasma.
• Replacement Tritium created from a Lithium blanket
   around the reactor absorbing a produced neutron.
• Fusion reactors
   – International ITER in 2012 for research for a decade, costing $5
     billion
   – Current stalemate over siting in France or Japan
   – To be followed by DEMO for a functioning plant, taking another
     10 years. So not ready for building units until at least 2030.
   – DEMO will cost $50 billion for a similar capacity as a nuclear
     reactor.
• US Lithium supply would last a few hundred years.
• Still would be a radioactive waste disposal problem.
Renewable energy sources
• Hydroelectric: very useful
– At 30% – 50% of maximum use
– Effects of dams
– Variable with season and climate
• Wind power: Need high wind areas on cheap land
– 600 large turbines the equivalent of a nuclear reactor
– Would need 30 linear miles of turbines
– Already scenic protests
– Many areas far from the power grid
– Claimed to be as cheap as natural gas
– Waiting for Tax Credit law renewal
• Solar power: 80% efficient for water heating on roofs
– Only 10% efficient for rooftop electricity
– Solar cell electricity more costly by a factor of 10
– 40 square miles equivalent to one nuclear reactor
– Need more research to improve efficiency and lower
manufacturing costsSolar Reflections • Rooftop water heating elements are 80% effective. • But solar cells are only 10% effective. • Therefore during a hot summer it would be better to reflect sunlight off the roof at near 100% efficiency. • During the winter it would be better to absorb all of the sunlight, rather than just using 10% of it as electricity for inside heating or power. • Similarly in cities, which heat up because of asphalt and tarred or rocky roofs, it would be better to reflect energy during the summer by painting roads and roofs white or light colored. • Also, tree planting cools cities, as well as patio or walkway covers, and covered parking garages or stalls. • Water can also be evaporated for transpiration cooling. • California is about to waste $23 billion on a million rooftop program of solar cells, which will generate electricity equivalent to only one-half of a nuclear reactor (SB1).
Biomass, Ethanol, and Geothermal
• Biomass: Competes with farm use for food
   – Insufficient for total power by a factor of 40
   – 2,000 square miles equivalent of one nuclear reactor
   – Burns to methane and nitrous oxide, both greenhouse
     gases
   – Sea growing possibilities being researched
• Ethanol: Political Issue for Rural (Red) States and areas
   – May be forced to include in gasoline as antiknock
     preventer, but no pipelines or ships, so truck
     transportation costly, and not needed by the Blue
     States or cities. Again, generates CO2.
• Geothermal: Few sites, mostly in the west
   – Produces Sulfur and heavy element pollution
   – Drilled holes cooled after sufficient water is heated
III. Worldwide Nuclear Power • Provides 20% of the world’s electricity • Provides 7% of world’s total energy usage • Cost is currently similar to fossil fuels • Nuclear reactors have zero emissions of smog or CO2 • There are 440 nuclear power reactors in 31 countries • 30 more are under construction • They produce a total of 351 billion watts of electricity
World Nuclear Power Plants
US Nuclear Power
In the US, 20% of our
electricity is produced by
nuclear power. There are
103 US nuclear power plants.
Soviet Nuclear Weapons to
        US Reactor Fuel
• We are buying highly enriched uranium
  (20% 235U) from the former Soviet Union’s
  nuclear weapons. The delivery is over 20
  years from 1993—2013.
• We are converting it to low enriched
  uranium (3% 235U) for reactor fuel.
• It will satisfy 9 years of US reactor fuel
  demand.
• It comes from 6,855 Soviet nuclear
  warheads.
California related reactors
Diablo Canyon, two reactors
San Onofre, two reactors
⅓ of Palo Verde 1, 2, & 3 in
ArizonaCalifornia Nuclear Energy • Each 1,100 megawatt reactor can power one million homes. • Each reactor’s output is equivalent to 15 million barrels of oil or 3.5 million tons of coal a year. • The total 5,500 megawatts of nuclear power is out of a peak state electrical power of 30,000 – 40,000 megawatts. • The PUC is now faced with a decision to approve $1.4 billion to replace steam generators in San Onofre and Diablo Canyon. • The replacements would save consumers up to $3 billion they would have to pay for electricity elsewhere.
Nuclear Power Proposed Solution?
• Richard Garwin , MIT and industry propose:
• If 50 years from now the world uses twice as much
  energy, and half comes from nuclear power
• Need 4,000 nuclear reactors, using about a million tons
  of Uranium a year
• With higher cost terrestrial ore, would last for 300 years
• Breeder reactors creating Plutonium could extend the
  supply to 200,000 years
• Nonpolluting, non-CO2 producing source
• Need more trained nuclear engineers and sites
• Study fuel reprocessing, waste disposal, and safety
Conservation
• Populations of largest CO2 producing countries
  are stabilizing
• Mass transit, car pooling, cash for not parking
• Transit Villages built around transportation lines
• Fuel economy improvements
• Hybrid and Electric cars, cylinder shut down
  engines
• Transportation replaced by communications
• Smart offices, houses and buildings
• Energy cost increases will drive conservation
• CO2 production taxes and increased fuel taxes
Possibility of New Energy Solutions and
            Improved Technology
• 100 years of scientific discoveries and
  technological innovations is unpredictable.
• In the last century we created:
  –   Autos, petroleum industry
  –   Aircraft
  –   Household appliances
  –   Mechanized industrial efficiency
  –   Nuclear Age
  –   Electronics age: TV, computers, cell phones
  –   Biological Age Starting: DNA, Genomics
  –   Medical diagnosis and care
• What lies ahead?
Signs of Progress • Globally: The Kyoto Treaty went into effect in Feb. 2005, with signers reducing emissions to 5% below 1990 levels, except for developing countries which includes China. China, however, with many smoggy cities, is planning 30 nuclear reactors by 2020, and considering 200-300 by 2050, including breeder and pebble bed reactors. • Nationally: Western governors committing to 20% renewable energy sources by 2020. • The Hummer H3 will be their new model and will resemble other SUVs in gas mileage like 20 mpg on highway. • GM Gen IV V-8 with cylinder shutdown technology to 4 cylinders to give 6-20% better fuel economy. Honda will apply this to V-6 also including hybrids.
IV Global Warming Effects
• Predicted Global Warming of 5°F will affect everyone in
  most structural aspects of society and in their costs.
• We don’t realize how our present housing, business, and
  supply nets are closely adapted to our current climates.
• The major increase in temperature and climate effects
  such as rainfall, drought, floods, storms, and water
  supply, will affect household and business insulation,
  heating and cooling energy, and farming. These may
  require large and costly modifications.
• Some cold areas may benefit, and some hot areas will
  become unfarmable and costly to inhabit.
• It is very misleading to portray the problem as a purely
  environmentalist issue which affects only polar bears, a
  few Pacific islanders, and butterflies.
Global Temperature Record:
Unusual 1° F Rise in the Last Century
700

                                            CO2 in 2100
  The last 160,000                    (with business as usual)
                                                                       600
   years (from ice
                            Double pre-industrial CO2
   cores) and the
                                                                       500
  next 100 years:

                                                                             CO2 concentration (ppm)
                                    Lowest possible CO2
 temperature (red)               stabilisation level by 2100           400
tracks CO2 (green).                             CO2 now

                                                                       300
               10

 Temperature
 difference     0                                                      200

 from now °C
               –10
                                                                       100
                     160   120            80          40         Now
                           Time (thousands of years)
CO2 and the Kyoto Treaty • The treaty just went into effect in Feb. 2005 to reduce greenhouse gas emissions of developed countries to 5% below their 1990 level. • The U.S., as the largest CO2 emitter in 1990 (36%), will not participate because it would hurt the economy, harm domestic coal production, and cost jobs. • China has signed the protocol, but as a developing country, it does not have to reduce emissions. • ( In China’s defense, it only has ¼ the emissions of the US per capita, it has significantly lowered its birth rate, and it is planning a massive nuclear reactor program.)
CO2 Production Rate

• Preindustrial 275 ppm CO2 will be doubled at
  550 ppm by adding 200 ppm to the present 350
  ppm. This will happen in 65 years at the
  current rate.
• Present burning of 240 Quads of fossil fuel per
  year can increase CO2 by 3.0 ppm per year.
• Thus 200 ppm will be added by 67 years, or
  sooner if fuel use increases.
• Climate models have a mean prediction of an
  increased temperature of 5° F for this doubling
  of CO2.
Comparative World CO2 Emissions
Global Warming Scenario

•   Greenhouse gases: CO2 ,methane, and nitrous oxide
•   Already heat world to average 60° F, rather than 0° F without an
    atmosphere
•   The present radiation imbalance will cause another 1° F heating by 2050,
    even without more greenhouse gas emissions.
•   Recent cleaning of air is causing the earth’s surface to be hotter and
    brighter.
•   Doubling of CO2 projected by end of century, causing ~5° F increase in
    average temperature (most rapid change in over 10,000 years)
     –   ~2-3 foot sea level rise
     –   More storms and fiercer ones
     –   Loss of coral reefs
     –   Increase in tropical diseases
     –   25% decline in species that cannot shift range
     –   Possible removal of Gulf Stream, causing ice age in Northern Europe
     –   Warming over land expected to be greater
     –   Hot areas expect greater evaporation from hotter winds
•   Stabilizing the amount of CO2 would require a reduction to only 5% to 10%
    of present fossil fuel emissions
Global Warming Effects
• Global Warming is an average measure
• Local warming or climate fluctuations can be very significant
• Arctic is 5° warmer
– Ice cap is ½ the thickness of 30 years ago
• Antarctic is 5° warmer
– Ice shelves over the sea are melting and breaking off and may
allow the 10,000 foot thick ice sheet over Antarctica to slide off
the continent faster
– This would cause a sea level rise
• An analogous local effect is that while ozone is affected everywhere,
there is a seasonal ozone hole over Antarctica
• Rainfall is hard to predict. It could be increased or decreased.
• Drought can partly be caused by increased evaporation at the higher
temperature.CO2 Effects to Increase Over
CenturiesGW effects on California • Summer temperatures rise by 4-8° F by 2100 for low emission scenario: 8-15° F for higher emissions. • Heat waves will be more common, more intense, and last longer. • Spring snowpacks in the Sierra could decline by 70-90%, as winters will be warmer. • Agriculture, including wine and dairy, could be affected by water shortages and higher temperatures. • More forest fires. • Tree rings show that in eras of global warming, megadroughts of decades hit the southwest US.
U.S. Carbon emission sources
Energy Research
• For comparison, the European Union is
  completing a $1 billion program on renewable
  energy to end in 2006, and expects double that
  afterwards to 2010.
• In 2005, the US will spend $1 billion, but mostly
  at national labs (DOE National Renewable
  Energy Laboratory in Colorado), but university
  funding is “bleak”.
• Stanford has a Global Climate and Energy
  Project (GCEP) of $225 million over ten years
  from industry.
Climate Satellite Research Setbacks

Also, 4 years of data from the Earth Radiation Budget Satellite is unanalyzed
for lack of funds.
What can California Do?
•   California is the world’s fifth largest economy, and has led the way
    on reducing vehicle pollution before.
•   State law for utilities to increase renewable electricity to 20% by
    2017. Can increase and extend to city power.
•   BEWARE: Million solar roof initiative will spend $23 billion to create
    the power of only half a nuclear reactor.
•   Use combined heat and electricity systems in large plants.
•   Clean up older, high polluting plants.
•   Mass transit and growth planning.
•   Removing firewood in forests and increasing them as a carbon
    storage component.
•   See Union of Concerned Scientists: www.climatechange.org
•   Unfortunately, they leave out a nuclear plant option.
Signs of Progress • Nationally: US reducing off-road vehicle diesel emission 90% by 2010. • California: Committing to lower greenhouse emission fuel in new autos by 30% by 2016. • Seven northeastern states likely to follow this (NY, NJ). • Canada demanding 25% reduction in new cars by end of this decade. • CA estimates cost of $1,000 per vehicle with continuously variable transmission, alternative AC coolant, and engines that shut off cylinders. • A 20% reduction in GW gasses with existing technology would pay off in fuel cost savings in three years of driving. • Zero Emission Vehicle regulation will generate 200,000 hybrids per year by 2015.
Conclusions on Energy and GW
•   At current or increased rates of production, oil and natural gas will
    be gone in 50 years or so, and will be expensive long before that.
•   Production of oil from coal and tar sands could be somewhat
    expensive.
•   Use of coal for electricity would highly pollute smog prone areas.
•   With the high costs of fuel and of fuel conversion or substitution, the
    costs of global warming should be added in to promote alternate
    energy sources, including nuclear power.
•   Global warming will continue until we drop fossil fuel use to a small
    fraction of its present rate.
•   The costs of relocation, substitution, extreme weather, increased
    deaths, and diminishing fuel will soon exceed the costs of
    developing alternate energy sources.
•   The sooner we act in research and development, and conservation
    and conversion, the easier and less costly the transition will be.
The Invisibility of Modern Energy and
Global Warming
• In ancient times we gathered firewood and watched it burn. With steam
powered transportation we saw the coal loaded and burned, and the steam
go off.
• Today, we pump gas invisibly, and burn it with no visible emission.
• We don’t see the oil being pumped from the ground, although we can see
tankers in the harbor and refineries. We don’t see it flowing through
pipelines.
• We don’t see the electricity powering our houses except through light, and
don’t monitor its usage. We usually don’t see the power plants. We often
don’t even see power lines to our houses.
• In natural gas heating we don’t see the gas burn or the heater and we don’t
monitor it.
• The greenhouse gases are invisible to us so we can’t see their emission or
buildup.
• Their effects on temperature show up globally with careful averaging, and
often in subtle effects.
• Any particular warming area or period is hard to precisely attribute to global
warming.
• Eventually global warming effects will be more prevalent, after much of its
prevention period is gone.Cost of Conversion to Industry (and
Consumers) – Order of magnitude
• At $50/barrel for oil, we are currently sending $100 billion per year to foreign
oil sources.
• The 1st gulf war required our presence to retake Kuwait and defend Saudi
Arabia for their oil resources.
• The 2nd gulf war (Iraq) may be costing us $100 billion per year at present, to
someday make available more oil resources.
• Even if nuclear reactors cost as much as $5 billion each, we could build 40
nuclear plants a year with this money.
• Since nuclear is 20% of our electricity with 100 plants, in 10 years of such
payments we could produce 400 more plants and have 100% of our
electricity nuclear.
• Then we could start building a nuclear generated hydrogen economy for
transportation with no CO2 pollution.
• The economics is similar to the question of renting versus owning.
• The costs of building and operating U.S. plants also go to American
workers, not overseas.
• So we are already spending the magnitude of funds necessary to convert,
but not accomplishing it.You can also read