ROGER: AN ON-LINE FLIGHT EFFICIENCY MONITORING SYSTEM USING ADS-B DATA - CEADAR
←
→
Page content transcription
If your browser does not render page correctly, please read the page content below
ROGER: An On-Line Flight Efficiency Monitoring System using ADS-B Data

                         Shen Wang∗ , Aditya Grover∗ , Brian Mac Namee∗ , Philip Plantholt† ,
                               Javier López-Leonés‡ , and Pablo Sánchez-Escalonilla§
            ∗ CeADAR    Centre for Applied Data Analytics Research, University College Dublin, Dublin, Ireland
                         Email: shen.wang@ucd.ie, aditya.grover@ucd.ie, brian.macnamee@ucd.ie
           † Business Strategy and Development, Flightradar24 AB, Stockholm, Sweden. Email: philip@fr24.com
              ‡ Boeing Research and Technology Europe, Madrid, Spain. Email: javier.lopezleones@boeing.com
                § CRIDA, ATM R&D Reference Center, Madrid, Spain. Email: psescalonilla@e-crida.enaire.es

Abstract—Flight efficiency indicators reported monthly in the      (PRU)1 collects, analyses, and releases flight efficiency re-
European area by the Performance Review Unit (PRU) help            ports to ATM community actors (including airlines and
the air traffic management (ATM) community determine if            air navigation service providers (ANSP)). Two flight ef-
excessive distances are being flown (compared with the ideal       ficiency indicators are frequently used: key performance
lengths of flight routes). Recent research, however, provides      environment indicator based on actual trajectory (KEA) and
more indicators that comprehensively capture flight efficiencies   key performance environment indicator based on last filed
in terms of other factors including fuel consumption, time         flight plan (KEP). These measure the percentage of extra
adherence, and route charges. The efficacy of all of these         distance contained in the actual trajectory flown (KEA) or
indicators, however, is diminished as they are currently only      in the last flight plan trajectory (KEP) by a certain flight
available almost a month after flights take place. This is         compared to the shortest possible trajectory between the
not sufficiently timely to use these indicators for the allevi-    origin and destination airports. To study more sophisticated
ation of unpredictable hotspots (i.e. sectors with congested       measures of flight efficiency, Calvo et al [2] proposed new
air traffic), which often leads to unexpected ground delays.       indicators that capture time-adherence and fuel consumption
This paper proposes a methodology to calculate general flight      efficiency factors. [3] improved upon these and extended to
efficiency indicators on-line in near real-time using nearest      new indicators that account for overall monetary cost. How-
point search. A prototype system called ROGER (compRe-             ever, existing flight efficiency results only become avail-
hensive On-line fliGht Efficiency monitoRing) is implemented
                                                                   able for analysis after a flight’s arrival. This significantly
                                                                   delays ATM actors in making adjustments to drive more
using Apache Kafka and Spark. ROGER can digest large-
                                                                   efficient flights. For instance, short-term air traffic flow and
scale heterogeneous datasets (i.e. mainly ADS-B data, the next
                                                                   capacity management (STAM) measures (e.g. re-routing,
generation aircraft surveillance technology) to compute indi-
                                                                   level-capping, ground delay) that are taken to avoid sectors
cators every 5 seconds. Our experiments on realistic datasets
                                                                   of airspace being overloaded with flights could be more
demonstrate that the proposed on-line indicator calculation
                                                                   efficiently planned if efficiency indicators were available to
method can achieve high accuracy compared with existing
                                                                   airspace users in near real time. An on-line flight efficiency
off-line approaches, and that ROGER can achieve desirable          monitoring system is highly required.
system performance in throughput and latency. A use case is
                                                                        One of the core technologies that could enable real-
also described showing how ROGER can assist in alleviating         time ATM performance monitoring is automatic dependent
hotspots more effectively.                                         surveillance-broadcast (ADS-B) [4]. ADS-B is a surveil-
                                                                   lance technology in which an aircraft regularly broadcasts its
1. Introduction                                                    own position (calculated using on-board GPS) which, when
                                                                   received and aggregated by ground stations, can be used
                                                                   to track the aircraft. ADS-B can send richer information
    Recent years have witnessed fast growing air traffic           (i.e. location, weather, and flight) to more receivers (i.e.
demand around the world. According to a 2017 European              including ground stations and nearby aircraft) at a longer
Commission report [1], global air traffic has been increas-        range, with higher frequency, and with lower deployment
ing, on average, by over 5% annually for more than 10              cost than on-ground radar systems. Companies, such as
years—well above global GDP growth. Limited airspace and           Flightradar242 , collect ADS-B data through crowd-sourcing
slowly increasing airport capacity, mean that it is becoming       to provide a global real-time aircraft monitoring service.
challenging for air traffic controllers and airlines to achieve    ADS-B is now widely equipped on civil aviation aircraft
optimal flight efficiencies.
    To fully understand flight efficiency, in the Euro-              1. See http://ansperformance.eu/about/
pean area, the EUROCONTROL Performance Review Unit                   2. https://www.flightradar24.com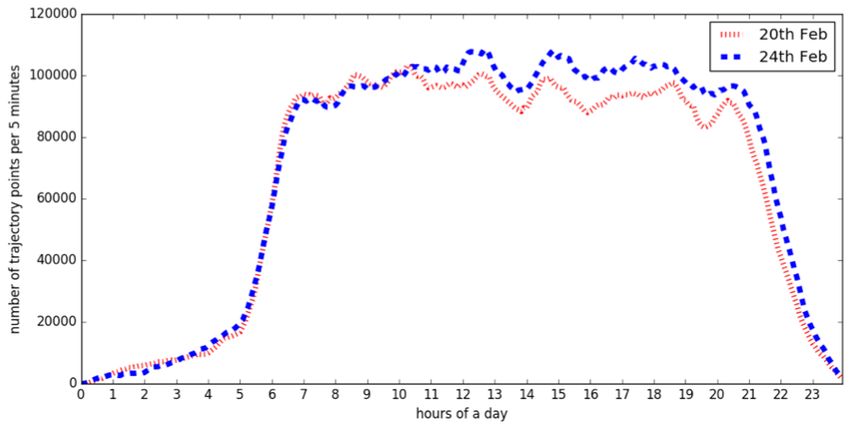
and will be mandatory in the coming years (it is compulsory 2.1. Datasets
for some aircraft in Europe from 2017 and will be so in
the USA from 2020). Recent research work on ADS-B has ROGER is underpinned by a number of key datasets that
mainly focused on the security aspects of the protocol [5], are described in this section.
methodologies for fusing ADS-B data with existing radar Surveillance: We use ADS-B surveillance data that
surveillance technology [6], and future challenges [7] for includes information such as the last updated time, location,
both manned and unmanned aircraft. To our knowledge, registration number, and speed for each aircraft tracked.
there is limited proof-of-concept work using ADS-B data to We source our ADS-B data from Flightradar24. The update
improve ATM performance at the operational level. There frequency of this data is every 5 seconds.
are three contributions made in this paper: Aircraft performance model: We use the base of air-
A methodology is proposed to calculate flight effi- craft data (BADA) 3.10 reference [8] that is provided by
ciency indicators on-line. Existing off-line efficiency indi- EUROCONTROL. It contains descriptions of aircraft per-
cators only have one value for each flight when the aircraft is formance, including the procedure model of climb, cruise,
landed at its destination airport. Using the proposed on-line and descent, along with engine parameters of major aircraft.
method, flight efficiency indicators values can be calculated Flight plan: We use the demand data repository (DDR)5
during flights approximately every 5 seconds. service provided by EUROCONTROL as the source of flight
A prototype system called ROGER (compRehensive plans. A flight plan describes the waypoints and schedule
On-line fliGht Efficiency monitoRing) is designed and that each flight plans to adhere to. The last filed flight plan
implemented. ROGER can digest large-scale heterogeneous is determined 3 hours before the departure of a flight.
datasets (e.g. ADS-B data, weather data, aircraft perfor-
Operational context: We also retrieve operational con-
mance etc.) to compute on-line indicators using the proposed
text data from the EUROCONTROL DDR service. The
method at the same frequency as the input surveillance
operational context data includes the partitions of airspace
data stream. ROGER is implemented using the state-of-the-
sectors in the European area, as well as important attributes
art big data streaming technologies from the open source
of each sector (e.g. capacity and route charge rate).
community—Apache Kafka3 and Apache Spark4 —which
Weather: We use weather data provided by the Global
ensures scalable and reliable system performance.
Forecast System (GFS)6 that has information such as tem-
A case study using realistic datasets is completed to
perature, wind, and pressure for any four dimensional point
verify ROGER. ROGER is evaluated using realistic datasets
describing date and time, latitude, longitude, and altitude.
that cover almost all flights that departed and arrived in
the European area on 20th and 24th February, 2017. The
evaluation results show that the proposed on-line indicator 2.2. System Architecture and Data Flow
calculation method in ROGER can achieve high accuracy
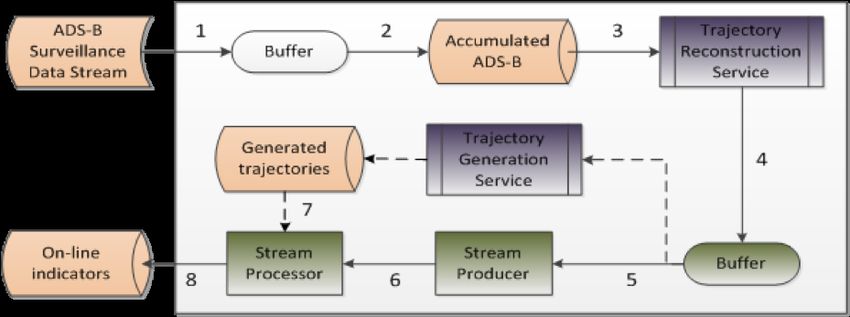
when compared with existing off-line methods. Moreover, Figure 1 illustrates the architecture of ROGER. The main
ROGER can cope with high throughput (i.e. up to 361 mes- components of ROGER are an input ADS-B surveillance
sages per second), respond with low latency (i.e. 33 seconds data stream; a trajectory reconstruction service which gen-
on average, 77 seconds for 99th percentile), and have no data erates trajectory states (e.g. instantaneous mass) given a
loss, no duplicated data, and no out-of-sequence data. A use sequence of actual surveillance points; a stream processor
case is also described to show how ROGER can assist with that calculates on-line efficiency indicators based on surveil-
the alleviation of hotspots. lance data; a trajectory generation service that computes the
ideal trajectory for each flight in various cost types (e.g.
2. System Overview distance, fuel) and updates these every 3 hours using the
latest estimated initial aircraft mass from the reconstructed
The ROGER system has been designed to meet follow- trajectory; and a data store to persist all calculated on-line
ing goals: efficiency indicator results.
1) To process heterogeneous datasets that include both
streaming (e.g. aircraft surveillance data) and non-
streaming data (e.g. weather data, aircraft perfor-
mance data, and flight plan data).
2) To calculate on-line flight efficiency indicators ef-
ficiently and accurately, given any updated flight
trajectory point.
3) To achieve satisfiable system performance (i.e.
throughput and latency) for all potential users.
This section describes the system designed to meet these
goals. Figure 1. ROGER system architecture.
3. https://kafka.apache.org/ 5. http://www.eurocontrol.int/ddr
4. http://spark.apache.org/ 6. https://data.noaa.gov/dataset/dataset/global-forecast-system-gfs-1-deg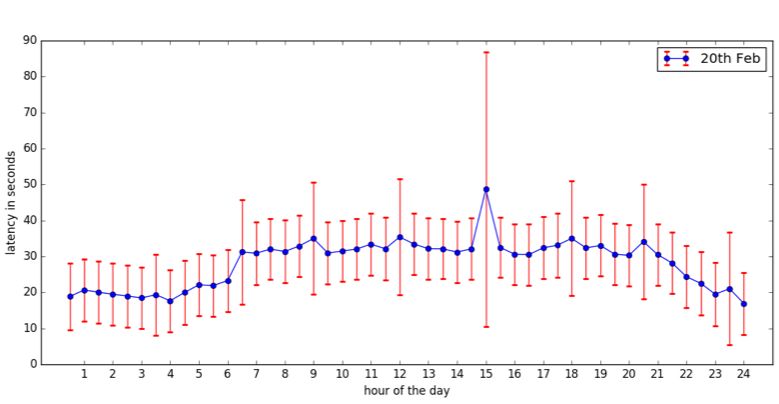
Key data flows in this architecture are labelled with
digits 1 to 8 in Figure 1. These are described below.                                                   Cti
                                                                                        IN Dti =             − 1  %
    1. The ADS-B surveillance data stream is ingested to a                                              Ct∗i
buffer to adapt the receiving rate to the subsequent process-
ing rate.                                                         where Cti defines the cost (i.e. distance d, fuel f , overall
    2. The latest surveillance data in this buffer is then        cost c) of Trec up to time ti (calculated on-line). Ct∗i repre-
moved out and accumulated with previously received ADS-           sents the corresponding optimum cost value of Tgen up to
B data to formulate a full trajectory for each flight since       the point which is geographically nearest to the trajectory
its departure, which is required by its subsequent trajectory     point in Tgen at time ti . Ct∗i can be retrieved directly from
reconstruction service. We use the “call sign number” com-        each type of generated trajectory (i.e. 4 in this study, details
bined with “departure time” to uniquely identify a flight.        shown in Table 1 ) which are pre-computed and loaded in
    3. The trajectory reconstruction service is triggered every   our system. We consider the geographically nearest point
5 seconds to derive extra states (e.g. instantaneous mass) for    (rather than “the closest time point” or other potential met-
all updated actual trajectory points. To avoid a performance      rics) in terms of the two dimensional (i.e. longitude and
bottleneck, this service is called in a multi-threaded manner,    latitude) great circle distance, as it is reasonable to define
considering each unique flight as the parallelism unit.           0% completion of a flight as when its current location is at
    4. The reconstructed trajectories are sent on to an           an origin airport, and 100% completion of a flight as when
Apache Kafka buffer. This reliable buffer can ingest data         the aircraft has geographically reached a destination airport.
with high throughput and low latency for more complicated         Table 2 lists ten on-line efficiency indicators calculated in
processing tasks afterwards.                                      this study, including their identifiers, the type of cost used,
    5. The Kafka stream producer application reads recon-         and the generated trajectory used.
structed trajectory streams from the buffer and sends them
to the stream processor. This stream producer guarantees                TABLE 1. T HE IDENTIFIERS , OPTIMISATION GOALS , AND
                                                                         CONSTRAINTS OF ALL GENERATED TRAJECTORIES Tgen
reliable message transmission with no duplication, no data
loss, and no out-of-sequence messages.                             Identifier   Constraints                Optimisation Goal
    6. The stream processor, which is implemented using            GEO FP       flight plan and weather    distance
Apache Spark Streaming, pulls the reconstructed trajectory         UP           flight plan and weather    –
streaming data every 15 seconds to aggregate a micro-              FREE CI      weather                    time and fuel
                                                                   OPT CI       flight plan and weather    time, fuel, and route charges
batch and computes the actual cost values that correspond
to all new reconstructed trajectory points, such as travelled
distance, consumed fuel, and overall cost.
    7. This stream processor also retrieves the ideal cost          TABLE 2. T HE IDENTIFIER , THE TYPE OF COST, AND GENERATED
                                                                     TRAJECTORY USED FOR THE COMPUTATION OF ON - LINE FLIGHT
value using nearest point search from pre-loaded in-memory                                 EFFICIENCY INDICATORS
generated trajectory data, then calculates required flight
efficiency indicators with the actual cost value computed                                           Generated Trajectory Tgen
by the stream processor.                                                                     UP       GEOFP FREECI           OPTCI
                                                                                distance     KEAP      KEA       KEAC1       KEAC2
    8. The stream processor outputs the calculated on-line             Cost       f uel      FEAP        –       FEAC1       FEAC2
indicator results on to a PostGIS data store for subsequent                       cash       CEAP        –       CEAC1       CEAC2
complex spatial queries. For example, the air traffic network
manager may check if in an airspace sector one indicator’s            The general steps to calculate indicators are as follows:
value is fairly distributed among airlines given a specific       1. pre compute all cost values for Tgen and load them
time range.                                                       fully on to our system; 2. as the surveillance data stream is
    It is worth noting that the aircraft instantaneous mass       ingested, all cost values of the latest updates in Trec are cal-
(including initial mass) is estimated by Boeing’s trajectory      culated on-the-fly; 3. the nearest points of the latest updates
reconstruction service as airlines do not share this confiden-    in Trec are then found in each type of the corresponding
tial data. The more surveillance data received the higher         Tgen ; 4. the indicator values can then be computed using
accuracy this estimation is, which lead to a periodically         the mappings shown in Table 2. For example, the value of
updated trajectory generation service.                            KEA should be equal to the ratio of the excessive value of
                                                                  d in Trec to d in Tgen - GEO FP.
3. On-line Indicator Calculation                                      The calculations of all cost values for both Tgen and
                                                                  Trec are given as:
    Almost all existing flight efficiency indicators [3] are          Travelled distance dti : for a given flight that departs
computed as the percentage of extra cost of an actual flight      at time t0 , at a given time, ti , the travelled distance is
trajectory (i.e. reconstructed trajectory Trec ) compared with    calculated as:
its corresponding cost in an ideal trajectory (i.e. generated
trajectory Tgen ). We extend this idea to the on-line scenario                    (
over the course of a flight. Specifically, the indicator value                        0,                              if ti = t0
                                                                          dti =
at the current time step ti can be computed using:                                    dist(Tti , Tti−1 ) + dti−1 ,    otherwise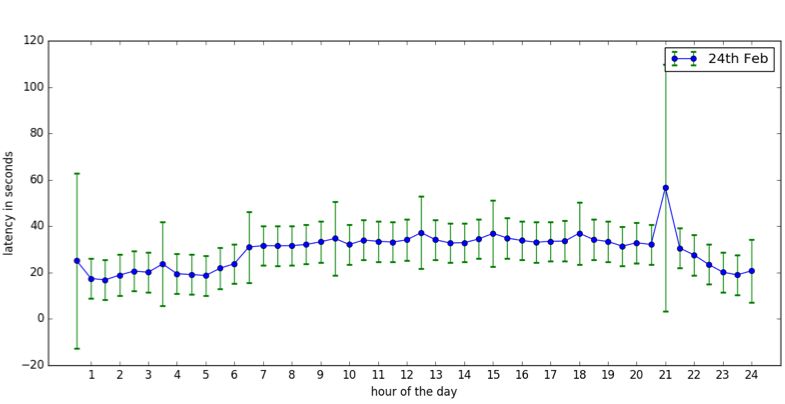
where dist(Tti , Tti−1 ) defines the geographic distance be-
tween two consecutive trajectory points (Tti and Tti−1 )                                       (
calculated using Vincenty’s formulae [10].                                                      prev rcti−1 + cur rcti−1 ,          if zti−1 6= zti
    Consumed fuel fti : Using the trajectory reconstruction                        prev rcti =
                                                                                                prev rcti−1 ,                       otherwise
service, the instantaneous mass mti can be estimated for all
trajectory points. Thus, the consumed fuel is computed as:
                                                                                       Specifically, as new trajectory points are coming in, we
                          fti = mt0 − mti                                          compare the existing charging zone of each consecutive
                                                                                   trajectory point pair zti−1 and zti . If zti−1 = zti , then a
    Overall cost cti : The overall cost in euros (e) at ti                         flight has not finished its journey in its current zone and
includes time, fuel, and route charges. Cost index, CI , is                        only cur rcti needs to be updated. If zti−1 6= zti , then the
a constant value that reflects airline’s perspective towards                       flight has just finished its journey in the previous zone zti−1 ,
the proportion of time and fuel that should contribute to a                        and has started another journey in a new zone zti and so
flight’s total cost. This is used with the fuel price, P , (in                     prev rcti should be updated, and cur rcti should be reset
euros/kg) to merge and convert the cost of time and fuel                           to 0. We also mark this point-pair as the exit Tti−1 and entry
into euros, then added it to the route charge, rcti :                              point Tti pair of zones they belong to respectively.
                                                                                       We use the cost index from flight plan, maximum take-
           cti = P ∗ (fti + CI ∗ (ti − t0 )) + rcti                                off weight (MTOW) from aircraft performance data, and
                                                                                   the partition of airspace in Europe with its route charge rate
                                                                                   from operational context dataset.

                                                                                   4. Evaluation

                                                                                       We perform evaluation experiments to measure the ac-
                                                                                   curacy of the on-line indicator calculations implemented in
                                                                                   ROGER and the efficiency with which they are calculated.
                                                                                   This section describes the setup of these experiments and
                                                                                   their results.

                                                                                   4.1. Experiment Settings
Figure 2. An example showing how route charge grows as new recon-
structed trajectory points ingested.                                                   We evaluate ROGER using an ADS-B dataset covering
                                                                                   flights that depart and arrive in European airspace on 20th
    The route cost rcti is calculated as the summation of                          and 24th February 2017. This dataset contains about 30,000
the route charge in the current zone cur rcti and the route                        flights and around 38 million cleaned ADS-B surveillance
charge in all previously flown zones prev rcti since a                             points evenly split across each day. We have access to
flight’s departure:                                                                GEO FP and UP generated trajectories for all of these
                                                                                   flights. As the trajectory generation service used in this
                  rcti = cur rcti + prev rcti                                      study has not been optimized for FREE CI and OPT CI,
                                                                                   we calculated these cost-based trajectories for a subset of
    We denote Tti as the current trajectory point, and Tti−1                       flights (around 1,200 for each type), which depart between
as the trajectory point at the previous time step. Given Tti we                    12:00 and 14:00 on each day. It takes about 1 second for
find its current airspace zone zti (e.g. Germany or France,                        Boeing’s trajectory reconstruction service to reconstruct a
as shown in Figure 2) using a point-in-polygon query. We                           single flight’s trajectory. Currently this service does not
also denote M as maximum take-off weight (MTOW) which                              support fully parallel computing for streaming context and
is the constant value for each aircraft, R(zti ) as the charge                     so we simulate the latency of trajectory reconstruction using
rate in zone zti , and Ttentry as the entry trajectory point                       a randomly selected positive value, from a normal distri-
in the current airspace zone zti . As shown in the off-line                        bution with mean value of 1.0 and standard deviation of
indicator calculation [11], the distance considered in route                       0.1. This simulated service reconstructs each trajectory in
charges only depends on the entry and exit trajectory point                        parallel. The parallelism capacity is set as 144 = 1 (the
in each flown airspace zone. We extend this calculation to                         number of servers) * 24 (the number of CPU processors)
the on-line scenario using the following equations:                                * 6 (the number of cores per CPU processor). All tests
                                                                                   are performed on a single machine equipped with Intel
             (                                                                     Core i7K 8700K (6-Core/12-Thread) 3.7 GHz, 32GB DDR4
                 0,                                              if zti−1 6= zti
cur rcti =       dist(Ttentry ,Tti )
                                           q                                       RAM,2TB 7200RPM SATA 6Gb/s disk, and the Ubuntu
                                               M
                        100            ∗       50   ∗ R(zti ),   otherwise         16.04LTS operating system.
4.2. Accuracy of on-line calculation as the number of data records processed by ROGER per
10 minutes from the ADS-B surveillance data source. The
The accuracy of our proposed on-line indicator calcula- throughput in the whole system is shown in Figure 4. The
tion method is measured in absolute error between offline peak traffic over two testing days is equivalent to about 361
(accurate) and online (approximate) indicator values. We records per second. Considering a lot of subsequent spatial
obtain offline results from ATM experts in CRIDA as the computations (e.g. great circle distance calculation, near-
ground truth data. These offline results contain 10 efficiency est point search, point-in-polygon query), which are more
indicator values for over 1,000 verified flights in total for computationally expensive than typical map and reduce
both 20th and 24th Feb, 2017. For each flight, we choose operations in most big data applications, this throughput can
the last point of its on-line results to compare to the offline still be considered heavy.
calculations. Under such throughput, the average latencies that
As shown in Figure 3, most of the on-line indicator ROGER achieves is shown in Figure 5 and Figure 6. This
values are very close to the accurate off-line values, with the latency accounts for the time spent for each message, from
median absolute error less than 0.5 percentage points. The when a surveillance trajectory point is received by ROGER,
maximum absolute error occurs in indicator FEAC2 which is to the moment when a corresponding updated set of ef-
still less than 3.5 percentage points. The difference between ficiency indicators is written in the sink data store. This
on-line and off-line results could be because the nearest includes the 5 seconds batch interval for the buffer between
point of the last reconstructed trajectory point, might not ADS-B data stream source and trajectory reconstruction
be the last point of its corresponding generated trajectory. service, the delay when reconstructing the trajectory, and
Moreover, the last reconstructed point might not always be the 15 seconds batch interval for Spark Streaming. A panel
exactly at a flight’s destination. Besides, the on-line results of expert airspace users, has recently set an update frequency
are calculated using several approximations (e.g. they do (and so maximum allowed latency) target on efficiency
not distinguish between flight stages such as taking off, indicator calculation of 5 minutes. Our results show per-
cruise, and landing, of a flight) for obtaining good system formance much better than this target. The mean latency
performance. for messages processed by ROGER is about 33 seconds,
while the 99th percentile latency observed for a message
in our current dataset is less than 77 seconds. Besides, the
longer latency generally occurs when generated trajectories
are being updated, a process which occurs every 3 hours.
Figure 3. A boxplot of absolute error of 10 consolidated on-line flight
efficiency indicators (based on ECAC traffic on 20th and 24th Feb 2017).
4.3. System performance
We measure the performance of the ROGER system Figure 5. The error bar (standard deviation) plot of latency every 30 minutes
in terms of throughput and latency. We define throughput over the full day traffic scenario on 20th Feb
4.4. ROGER-assisted STAM
The main motivation of building ROGER for monitoring
flight efficiency on-line is to enable better planning of STAM
measures, which air traffic controllers (ATC) can use for
re-routing, level-capping, or ground-delay to alleviate any
detected hotspots (i.e. in a certain airspace sector the aircraft
counts during a time interval is beyond its upper limit)
in the tactical stage (i.e. day of operations), rather than
pre-tactical (i.e. 1 to 6 days before operation) or strategic
stages (i.e. longer than 7 days before flight operation). We
show an example of using the output of ROGER to facili-
Figure 4. System throughput. tate STAM decision-making. Assume that German airspaceimplemented a prototype system, ROGER, using Apache
Kafka and Spark Streaming. We showed that the calculated
on-line indicator results using our proposed method have
high accuracy when compared with off-line results. The ex-
periments also demonstrate that ROGER can achieve desired
performance in terms of throughput and latency. In the future
we intend to fully integrate the trajectory generation and
reconstruction services and evaluate use cases for taking
advantage of real-time efficiency indicators. We will also
explore ways in which the performance of the system could
be improved.
Figure 6. The error bar (standard deviation) plot of latency every 30 minutes Acknowledgments
over the full day traffic scenario on 24th Feb
This research was performed as part of the European
(ICAO code: ED) is detected as a hotspot at 3pm. An Union’s Horizon 2020 AURORA project7 (Grant Num-
ATC can perform spatio-temporal queries on the ROGER ber: 699340) and supported by Enterprise Ireland and IDA
efficiency indicator data store to get up to date efficiency Ireland under the Technology Centres Programme (TC
indicators for each flight within this region. The average 20130013).
efficiency indicators for each airline with flights in the
hotspot can be calculated and hotspot alleviation measures References
can be applied to only flights from those airlines that are
currently running efficiently so as to minimise the impact [1] “Annual analyses of the eu air transport market 2016,” European
of hotspot alleviation measures. Figure 7, shows the median Commission: Mott MacDonald, 2017.
CEA-C2 value for each of the 5 airlines that have flights [2] E. Calvo, J. M. Cordero, L. D’ Alto, J. López-Leonés, M. Vilaplana,
and M. La Civita, “A new method to validate the route extension
in this region calculated at 30-minute intervals in the time metric against fuel efficiency,” in Eleventh USA/Europe Air Traffic
leading up to the hotspot arising. From this figure, a primary Management Research and Development Seminar, 2015.
conclusion can be seen that if ATC intends to do STAM [3] J. López-Leonés, M. Polaina Morales, P. Sánchez-Escalonilla, D. Fer-
for some airlines, airline4 and airline1 (real airline names rer Herrer, M. Sanz Bravo, F. Celorrio Cmara, and A. Martnez Mateo,
are hidden for confidentiality) between in 13:30-14:00 is “User-centric cost-based flight efficiency and equity indicators,” in the
definitely not a fair option as they have already sacrificed a 7th SESAR Innovation Days (SIDs), 2017.
lot in overall cost in this airspace. [4] P. R. Drouilhet Jr, G. H. Knittel, and V. A. Orlando, “Automatic
dependent surveillance air navigation system,” Oct 1996, US Patent
5,570,095.
[5] D. McCallie, J. Butts, and R. Mills, “Security analysis of the ads-
b implementation in the next generation air transportation system,”
International Journal of Critical Infrastructure Protection, vol. 4,
no. 2, pp. 78 – 87, 2011.
[6] J. L. Da Silva, J. F. Brancalion, and D. Fernandes, “Data fusion
techniques applied to scenarios including ads-b and radar sensors for
air traffic control,” in Information Fusion, 2009. FUSION’09. 12th
International Conference on. IEEE, 2009, pp. 1481–1488.
[7] M. Strohmeier, M. Schafer, V. Lenders, and I. Martinovic, “Realities
and challenges of nextgen air traffic management: the case of ads-b,”
IEEE Communications Magazine, vol. 52, no. 5, pp. 111–118, May
2014.
[8] A. Nuic, “User manual for the base of aircraft data (bada) revision
3.10,” Atmosphere, vol. 2010, p. 001, 2010.
[9] J. A. Besada, G. Frontera, J. Crespo, E. Casado, and J. López-
Leonés, “Automated aircraft trajectory prediction based on formal
intent-related language processing,” IEEE Transactions on Intelligent
Transportation Systems, vol. 14, no. 3, pp. 1067–1082, Sept 2013.
Figure 7. The evolution of CEA-C2 (median value for each airline) by [10] T. Vincenty, “Direct and inverse solutions of geodesics on the ellip-
airlines, 180minutes before Germany is detected as a hotspot at 3pm. soid with application of nested equations,” Survey review, vol. 23, no.
176, pp. 88–93, 1975.
[11] L. Castelli and A. Ranieri, “Air navigation service charges in eu-
5. Conclusions rope,” in Seventh USA/Europe Air Traffic Management Research and
Development Seminar, 2007.
To dynamically monitor flight efficiencies, we propose 7. http://aurora-er.eu/; Advanced User-centric efficiency metRics for air
a methodology to calculate efficiency indicators on-line and traffic perfORmance Analytics (AURORA)You can also read