Interactive Multi-User 3D Visual Analytics in Augmented Reality
←
→
Page content transcription
If your browser does not render page correctly, please read the page content below
Interactive Multi-User 3D Visual Analytics in Augmented
Reality
Wanze Xie2 , Yining Liang2 , Janet Johnson2 , Andrea Mower1 , Samuel Burns1 , Colleen Chelini1 , Paul D’Alessandro1 , Nadir Weibel2 ,
Jürgen P. Schulze2
1 BodyLogical team
2 University of California San Diego, La Jolla, CA, USA
arXiv:2002.05305v1 [cs.HC] 13 Feb 2020
Abstract Related Work
There are two main areas of prior work our project is built
This publication reports on a research project in which we
upon. One is real-time, multi-user augmented reality data visual-
set out to explore the advantages and disadvantages augmented
ization, the other is visual analytics.
reality (AR) technology has for visual data analytics. We devel-
The release of the Microsoft HoloLens [3] in 2016 defined
oped a prototype of an AR data analytics application, which pro-
a point in the history of augmented reality from which on it was
vides users with an interactive 3D interface, hand gesture-based
possible to build augmented reality applications which could run
controls and multi-user support for a shared experience, enabling
directly on a headset, did not require an external computer, and
multiple people to collaboratively visualize, analyze and manip-
they allowed the programmer to focus on the user facing part of
ulate data with high dimensional features in 3D space. Our soft-
the software application because the HoloLens had built-in inside-
ware prototype, called DataCube, runs on the Microsoft HoloLens
out tracking which was very good, as well as a built-in spatial
- one of the first true stand-alone AR headsets, through which
user interface. It even has its own finger tracking parser, which
users can see computer-generated images overlaid onto real-
allows for simple but effective interaction with AR applications
world objects in the user’s physical environment. Using hand ges-
by interpreting the user’s head direction as a cursor while finger
tures, the users can select menu options, control the 3D data visu-
gestures trigger events.
alization with various filtering and visualization functions, and
Since the release of the HoloLens, researchers and applica-
freely arrange the various menus and virtual displays in their
tion developers around the world have developed numerous AR
environment. The shared multi-user experience allows all par-
applications and wrote academic publications on them. Standout
ticipating users to see and interact with the virtual environment,
areas of particular interest are medical visualization, molecular
changes one user makes will become visible to the other users
science, architecture and telecommunication. The AR applica-
instantly. As users engage together they are not restricted from
tion OnSight which allows scientists to virtually walk on planet
observing the physical world simultaneously and therefore they
Mars, a collaboration between Microsoft and JPL, even received
can also see non-verbal cues such as gesturing or facial reactions
NASA’s 2018 Software of the Year Award [4]. It allows multiple
of other users in the physical environment. The main objective of
users, each with a HoloLens, to explore the surface of Mars.
this research project was to find out if AR interfaces and collabo-
Trestioreanu [11] created a collaborative medical data visu-
rative analysis can provide an effective solution for data analysis
alization system for the HoloLens which can visualize CT data
tasks, and our experience with our prototype system confirms this.
sets in 3D, but it is not designed to do general data visualization.
And it requires an external computer for the actual rendering task,
Introduction as opposed to rendering directly on the HoloLens headset.
Visual data analytics in 3D is not a novel concept. It doesn’t
The goal of this project was to design an augmented reality
require AR but can just as soon be done on a regular monitor or in
data visualization tool for population health management, which
virtual reality (VR). Millais et al. [5] compare 3D data visualiza-
uses the biomedical simulation tool Bodylogical [2] to predict the
tion in VR to traditional 2D visualization and found that 3D visu-
population’s future health by scientifically simulating each indi-
alization increases the accuracy and depth of insights compared to
vidual’s health based on dozens of biomarkers such as blood pres-
2D. To us, the collaborative aspect of AR data visualization is also
sure, cholesterol, glucose levels, etc. In this article we will report
very important, because it allows groups of experts to brainstorm
on how we created our augmented reality prototype system, along
together while viewing the data in front of them.
with the challenges we encountered and the insights we gained
along the way.
Implementation
Bodylogical is a simulation tool, which for each member of On the pathway to our final HoloLens application, we devel-
the simulated population, creates a digital twin with simulated oped two separate prototype applications.
values for many of the human biomarkers and bodily functions.
By giving lifestyle choices, such as the amount of calories taken Prototype 1: Bar Charts
in, the amount of exercise or the amount of sleep, the simulation The first prototype is an AR application which renders a 3D
tool can predict the future health of each simulated individual, and bar chart in the AR environment, and places it on a physical table
thus the entire population. in the room that the user chooses within the application. The pur-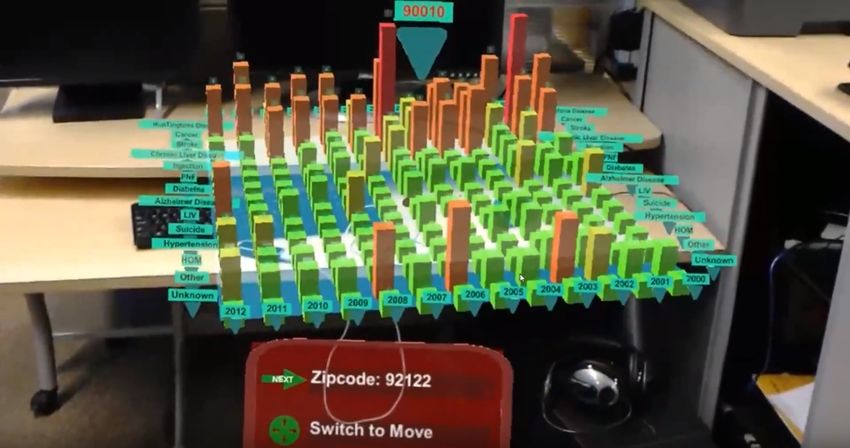
pose of this is that multiple users can be standing around the visu- Prototype 2: DataCube
alization and independently view it from their respective viewing Our second prototype is a group data visualization tool, and
directions, just as if there was a physical model on the table be- it is much more sophisticated than our initial 3D bar chart appli-
tween them. This early version of the visualization tool already cation. We used the lessons we learned from the first prototype,
had basic features such as loading data files, selecting data points, such as positioning 3D data sets on a physical table in the room,
and the selection of viewing and filtering parameters of the 3D bar or menu items that are attached to the data visualization object
chart. Figure 1 shows an image of what this application looks like to build a multi-user application which allows an analyst to ana-
from the user’s point of view, as seen through the HoloLens. lyze data in truly novel ways. The core component of this design
is a multi-dimensional scatter plot, displayed inside of our Dat-
aCube, which can display six dimensions of data by making use
of the three spatial coordinate axes, as well as color, sphere size
and trace lines. Figure 3 shows what our DataCube application
looks like when two people are in a collaborative session.
Figure 1: A 3D bar chart in augmented reality on the HoloLens.
This approach has some advantages of identifying standout
data groups by looking at taller bars, and also provides a quick
reference to the data group of a certain year for a specific region,
selected by zip code. In addition to bar height, we use a color gra-
dient from cool colors (blue, green) to warm colors (yellow, red) Figure 3: Our AR data visualization tool DataCube with two
to emphasize the differences between bar heights, because they users (one looking at the other).
are otherwise sometimes difficult to discern due to occlusion ef- Another component of our visualization tool is the analysis
fects when the user looks at the data from a low viewpoint, or lack wall, see Figure 4. It is placed on one of the walls of the room the
of discernible bar heights when the user looks from the top down. users are in, so that anyone can walk up to it to take a closer look
But it turns out that there are many limitations to this kind of vi- and analyze subsets of the data with 2D diagrams and statistical
sualization, primarily that it does not provide much information information. The user can also choose to create a snapshot of
in addition to what a typical Excel chart on a 2D display would what they are viewing inside the DataCube. The snapshots are
show. 2D scatter plots based on the face of the DataCube the user looks
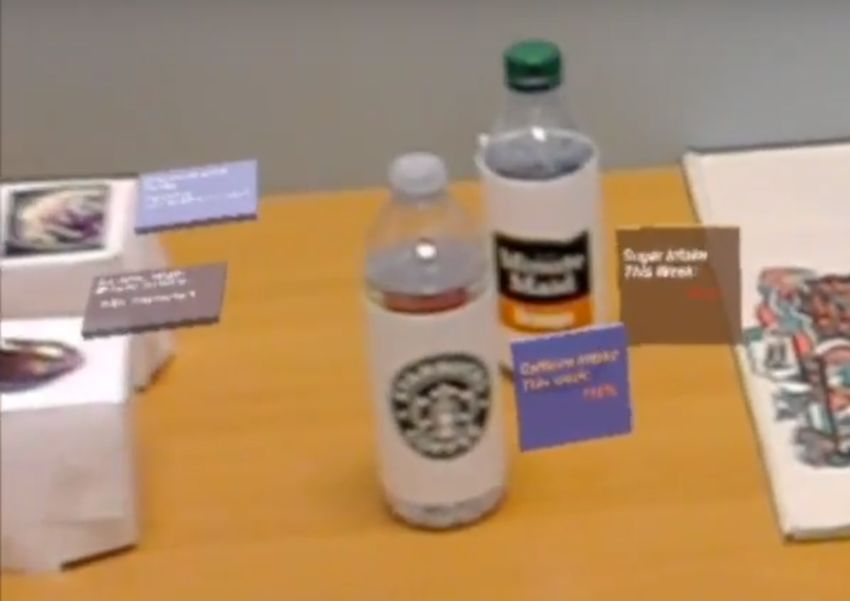
Within this prototype, we also explore ways to make better at, allowing the user to isolate crucial aspects of the data or the
use of the environment provided by the augmented reality system. visualization.
Instead of laying out all the data on a flat surface, we followed
Bach et al.’s concept of “Embedded Visualization” [9] (see Fig-
ure 2). As a result, our AR application targets individual users’
health data, rather than aggregate health information averaged
over larger amounts of people. Our visualization tool provides
Embedded Visualization based on image and object recognition
to show data relevant to the health of a user.
Figure 4: The analysis wall is placed on one of the walls of the
physical room.
File System
The DataCube application uses comma-separated value
(CSV) files to store the population health data. These files are
Figure 2: Embedded Visualization based on image recognition.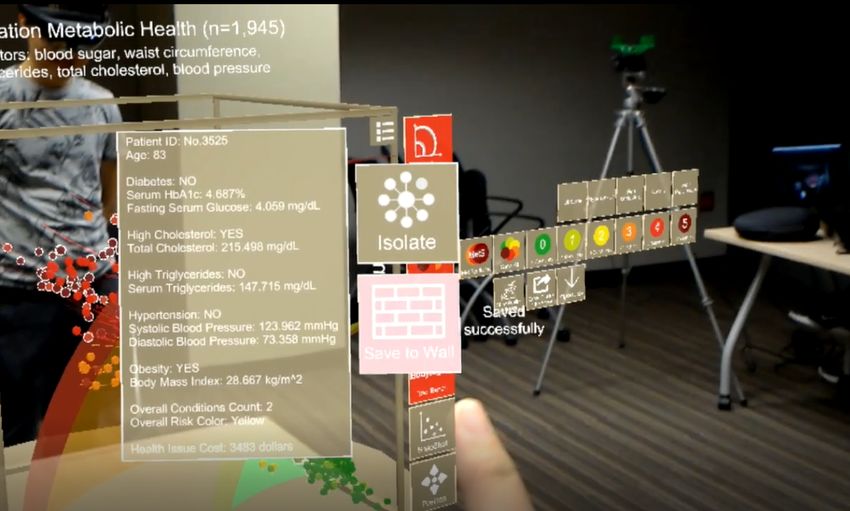
stored in a OneDrive data directory in the cloud, linked to the         in the same room.
HoloLens’s Microsoft account. The authentication process is se-               We keep track of user interactions and synchronize the in-
cure and managed by the HoloLens at the operating system level.         teractions that are applied to the shared objects. This include the
      To import a data file, the user clicks on the import button on    transformation matrices of movable objects and users, any change
the virtual console and the HoloLens will open up the ”Load from        of states of the data analysis cube and the analysis wall, etc. The
OneDrive” menu for the user to select a file. The data file needs to    menu of the data cube does not have a shared transformation ma-
be uploaded by the user to their OneDrive and is required to fol-       trix, but we design it in a way so that regardless of the direction the
low our custom CSV file format to work with our data importer.          user faces with respect to the cube, the main menu always faces
During or at the end of an analysis session, the user can take snap-    to the user to make it as easy as possible to select menu items.
shots of the data and export them to a file for further investigation         One limitation of the HoloLens shared experience is the
by clicking the ”Export” button in the main DataCube menu, and          number of participants in the same session due to the potential
the HoloLens will open up the ”Send as email” window and attach         interference across multiple HoloLens devices. According to the
the current data visualization converted to a file as an attachment.    official Microsoft HoloLens documentation [8], the recommended
In this window, the user can enter the recipient’s email address        maximal number of HoloLenses in the same shared experience
and click send. All of this happens within the HoloLens applica-        session is six. We tested up to five users in the same session and
tion, interactions are done via the standard HoloLens interface of      were able to achieve a stable connection between all users and
pointing by head orientation and finger pinching to trigger actions.    the server for the duration of typical user sessions, which can ex-
                                                                        ceed one hour. In case of temporal network disconnections, when
Shared Multi-User Experience                                            a HoloLens re-joins the session, it registers as a new client and
      Another feature of our DataCube prototype is the shared           automatically downloads the shared anchor information to syn-
multi-user experience. Up to five people, each wearing a                chronize with the current transformation matrices and states of all
HoloLens, can connect into the same session and analyze, dis-           the shared objects in the scene.
cuss and manipulate the visualization together in the same place
at the same time (see Figure 5).                                        Data Inspection
                                                                              Each user can select data points in the data cube by clicking
                                                                        on them. This brings up detailed information about the data point,
                                                                        which represents a specific individual of a population. If a profile
                                                                        that needs further concern is identified, the user can choose to save
                                                                        it to a list that can be exported to the OneDrive folder and studied
                                                                        at a later point. A number of menu items allow changing visual-
                                                                        ization modes, activating data filters, and many more functions to
                                                                        change how the data is presented to users, as shown in Figure 6.

Figure 5: Third person view of two users using the application in
                     a collaborative session.
      To set up the shared experience, we implemented a socket-
based communication protocol within the local area network
(LAN) based on the MixedReality Toolkit provided by Microsoft.
The sharing mechanism is server-based. We set up the sharing
server on a separate PC and require all participating HoloLens
users to be connected to the same LAN as the PC. When the Dat-
aCube application is launched, each HoloLens will automatically
search for the server PC’s host name within the LAN and connect         Figure 6: First person view of the HoloLens application with 3D
to it. Since all HoloLenses are required to be on the same wire-                                  menu panels.
less LAN, all users will need to be able to log in to the same wifi
network, which ensures that all parties in the session are trusted      Dual-language Support
users.                                                                       To allow non-English speakers to use our DataCube appli-
      The sharing is also session-based. The first user defines the     cation in Japan, we added dual language support for English and
3D coordinate system the participants will be sharing by sending        Japanese to our application. We used this feature very success-
its spatial coordinate system’s common points of reference (an-         fully in demonstrations to Japanese users in Tokyo. We currently
chors) to the server. When subsequent users join the session, they      only support two languages, but given a translator we could easily
will automatically download the anchor information stored on the        support additional languages.
server and try to match the anchor points with their own spatial co-         With the support for multiple languages, when users with
ordinate system. Eventually, each party in the same session will        different language backgrounds join the same shared experience
share the same coordinate space, provided that they are physically      session, each user can change their own language settings in the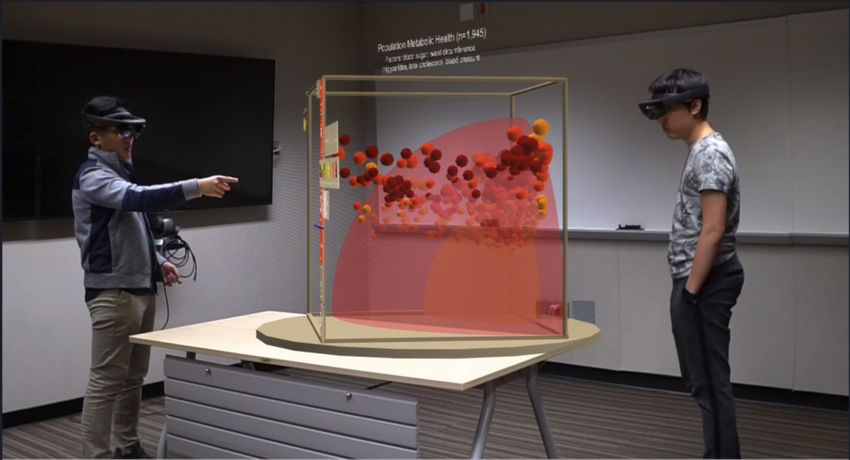
menu with the language icon. Since the language configuration is
not a shared setting, speakers with different language preferences
can see all text in the application in their preferred language. In
this way, the app ensures a smooth user experience and facilitates
communication when used in an international meeting.
This is a fascinating feature of AR, which we would love
to see more generally used in AR applications, ideally supported
on the operating system level. Our multi-language system is im-
plemented with a database which allows each text element in the
app to query the corresponding translation when it is created. The
database could potentially be adapted to use an online translation
service, such as Google Translate to support more languages au-
tomatically.
Google Daydream Controller
Finger taps in the air can get tiring rather rapidly when us-
ing a HoloLens application for a longer duration. The HoloLens Figure 7: The spectator view camera setup.
comes with a simple clicker, which helps alleviate this issue, but
it still requires head orientation to select objects on the screen. We for blending HoloLens and camera video streams. The procedure
wanted to add an interaction concept which resembled more that for our Spectator View is implemented as follows:
of VR headsets with 3D controllers. Therefore, we integrated a
Google Daydream [6] controller into our HoloLens application.
It allows for pointing in 3D, but the controller does not know its 1. The PC launches the simulated application via Unity.
location in 3D space. Our application allows the user to switch 2. The HoloLens transmits real-time position and orientation
switch between hand gestures and the Daydream controller upon information to the PC and the simulation app uses it to com-
request. pute the correct transformation matrices for all virtual ob-
The integration of the Daydream controller extends the user jects in the scene.
interactions for our application in the following ways. Clicking 3. The DSLR camera transmits high-resolution images through
the button on the Daydream controller is more intuitive and less the capture card to the PC and the simulation app blends the
tiring than the air tap gestures [10]. Air taps require a learning camera-captured view with the virtual objects to generate
curve and have a greater chance of recognition errors than a button the output image.
click. The orientation tracking of the controller allows for more 4. We project the output image via a projector to show the real-
precise pointing and selection with a virtual laser pointer, which time AR experience from the camera’s perspective to the
follows the orientation of the controller. This mechanism works people in the room who are not wearing HoloLenses.
much like in actual Google Daydream VR applications.
The mechanism of switching between air taps and the Day-
dream controller is done automatically. If the user’s hand is within We choose to use a separate DSLR camera instead of the
the HoloLens’s field of view, the app will expect air taps. If the HoloLens’s built-in RGB camera for two reasons. First, we want
Daydream controller is linked to the HoloLens, and an action is to present the entire on-going session for the spectators, so we
detected from the controller, the app will switch to the Daydream need a camera that has a wider field of view than the HoloLens to
controller. This allows user to seamlessly switch between the two capture as much of the room as possible. Second, we need high
modes without having to use a menu item. resolution images to create a video stream of high quality for the
projector. In our experience, the spectator view is a very useful
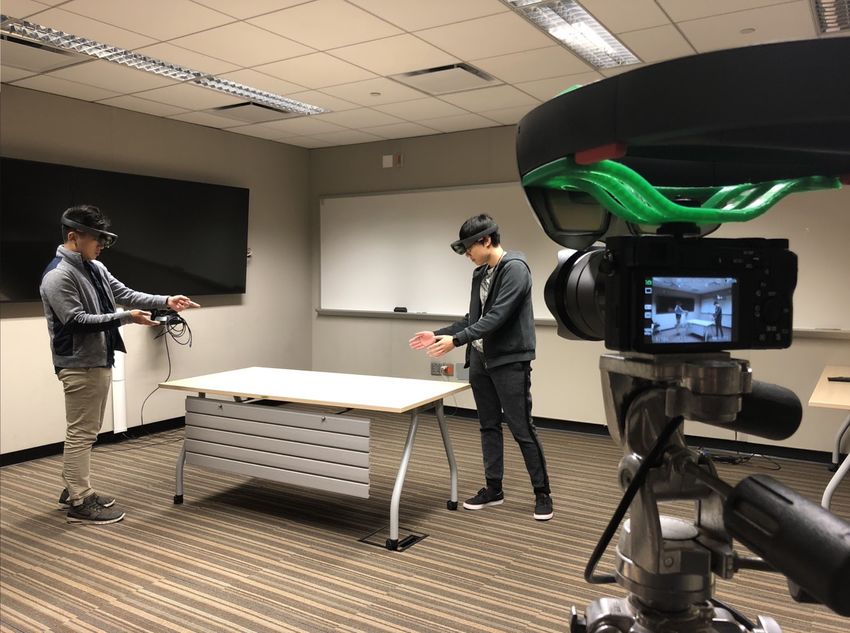
Spectator View feature to allow everyone in a conference setting to follow a data
One typical limitation of augmented reality experiences is analysis session.
the lack of a sense of presence for local observers who are not
wearing an AR headset. We help solve this problem by offering Conclusions
a Spectator View [7]: a real-time view of a multi-user HoloLens Designing an interactive data visualization tool is always a
session from a fixed viewpoint, using a Digital Single Lens Re- challenge, especially when trying to make the best use of an AR
flective camera (DSLR). Figures 3 and 5 were created with our system. At the time of our research, the Microsoft HoloLens was
Spectator View system. In comparison, Figure 6 is an image taken the best self-contained AR platform available to us. We created a
directly from the HoloLens system. Figure 7 shows the setup of multi-user application for the HoloLens, which can visualize pop-
the DSLR camera with the attached HoloLens which we use for ulation health data with a 3D data cube, as well as a 2D wall dis-
capturing the Spectator View. The HoloLens is attached to the play, designed to be used in a conference room. This application
flash mount on the top of the camera via a custom 3D printed has been successful enough that it has been used in a commer-
bracket. cial environment for well over a year. In the future, we hope to
Our spectator setup includes a DSLR camera (Sony alpha- port our application to the new HoloLens 2 or other devices with
6500), a video capture card (Elgato HD60-S), the 3D printed greater fields of view, higher resolution displays, and better hand
bracket for mounting the HoloLens onto the camera, and a PC gesture recognition.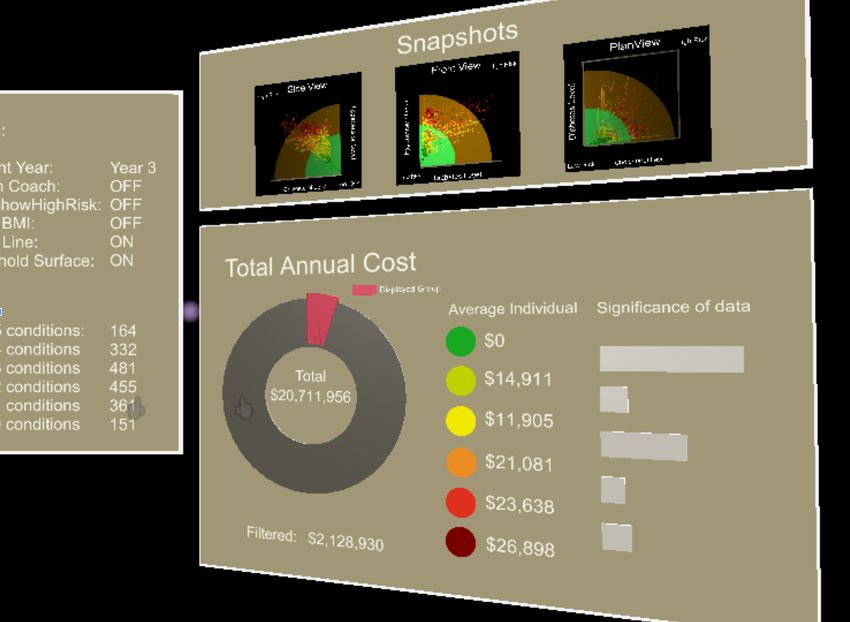
References                                                                         Dr. Samuel Burns, Colleen Chelini and Paul D’Alessandro are mem-
 [1] Simon Butscher, Sebastian Hubenschmid, Jens Mueller, Johannes          bers of the BodyLogical team.
     Fuchs, Harald Reiterer; ”Clusters, Trends, and Outliers: How Im-              Dr. Nadir Weibel is an Associate Professor in the Department of
     mersive Technologies Can Facilitate the Collaborative Analysis of      Computer Science and Engineering at UC San Diego, and a Research
     Multidimensional Data”, In Proceedings of ACM CHI 2018, New            Health Science Specialist in the VA San Diego Health System. His work
     York, NY, USA, URL: https://dl.acm.org/citation.cfm?id=3173664         on Human-Centered Computing is situated at the intersection of computer
 [2] Bodylogical health simulator, https://www.pwc.com/us/en/industries/    science, design and the health sciences. He is a computer scientist who
     health-industries/library/doublejump/bodylogical-precision.html        investigates tools, techniques and infrastructure supporting the deploy-
 [3] R. Furlan, ”The future of augmented reality: Hololens - Microsoft’s    ment of innovative interactive multi-modal and tangible devices in con-
     AR headset shines despite rough edges”, Resources Tools and Toys,      text, and an ethnographer using novel methods for studying and quanti-
     IEEE Spectrum, June 2016.                                              fying the cognitive consequences of the introduction of this technology to
 [4] JPL: Mars Virtual Reality Software Wins NASA Award, URL:               everyday life. His research interests range from software engineering to
     https://www.jpl.nasa.gov/news/news.php?feature=7249                    human computer interaction, particularly mobile health, computer sup-
 [5] Patrick Millais, Simon L. Jones, and Ryan Kelly. 2018. ”Ex-            ported cooperative work, medical informatics and mobile and ubiquitous
     ploring Data in Virtual Reality: Comparisons with 2D Data Vi-          computing.
     sualizations”. In Extended Abstracts of the 2018 CHI Confer-                  Dr. Jürgen Schulze is an Associate Research Scientist at UCSD’s
     ence on Human Factors in Computing Systems (CHI EA ’18).               Qualcomm Institute, and an Associate Adjunct Professor in the computer
     ACM, New York, NY, USA, Paper LBW007, 6 pages. DOI:                    science department, where he teaches computer graphics and virtual real-
     https://doi.org/10.1145/3170427.3188537                                ity. His research interests include applications for virtual and augmented
 [6] Google Daydream, URL: https://arvr.google.com/daydream/                reality systems, 3D human-computer interaction, and medical data visu-
 [7] Spectator View URL:                                                    alization. He holds an M.S. degree from the University of Massachusetts
     https://docs.microsoft.com/en-us/windows/mixed-reality/spectator-      and a Ph.D. from the University of Stuttgart (Germany).
     view
 [8] Microsoft HoloLens Official Document URL:
     https://docs.microsoft.com/en-us/windows/mixed-reality/shared-
     experiences-in-mixed-reality
 [9] Bach, Benjamin and Sicat, Ronell and Pfister, Hanspeter and
     Quigley, Aaron, ”Drawing into the AR-CANVAS: Designing Em-
     bedded Visualizations for Augmented Reality”. Workshop on Im-
     mersive Analytics, IEEE Vis, 2017
[10] Markus Funk, Mareike Kritzler, and Florian Michahelles. 2017.
     HoloLens is more than air Tap: natural and intuitive interac-
     tion with holograms. In Proceedings of the Seventh International
     Conference on the Internet of Things (IoT ’17). Association for
     Computing Machinery, New York, NY, USA, Article 31, 1–2.
     DOI:https://doi.org/10.1145/3131542.3140267
[11] Lucian Trestioreanu, ”Holographic Visualisation of Radiology Data
     and Automated Machine Learning-based Medical Image Segmenta-
     tion”, Master’s Thesis at Universite du Luxembourg, August 2018.

Author Biography
      Wanze (Russell) Xie was an undergraduate student in the computer
science department of UCSD when he wrote most of the software for this
project. He graduated from UCSD in June of 2019 and is currently a
graduate student at Stanford University.
      Yining Liang was an undergraduate student at UCSD when the work
for this paper was being done, and has since graduated with a B.Sc. de-
gree in computer science.
      Janet Johnson is a graduate student in UCSD’s department of Com-
puter Science and Engineering and is advised by Dr. Weibel. Her work
focuses on human-centered interaction design for augmented reality ex-
periences.
      Andrea Mower helped support the Bodylogical and UCSD teams in
their experimentation with augmented reality for data visualization and
storytelling. She holds a BS from Brigham Young University in Technology
and Engineering Education. Her area of specialization is helping com-
panies explore adoption of emerging technology for business use. Other
research areas include comparing the effectiveness of training in virtual
reality to traditional learning modalities.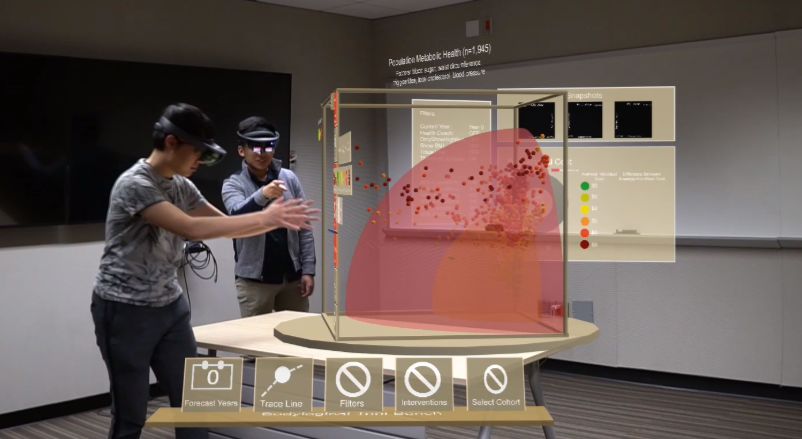
You can also read


