Wildfires and Air Quality - Part 1 - AirNow Maps and Sensors for Community Smoke Monitoring - US Environmental ...
←
→
Page content transcription
If your browser does not render page correctly, please read the page content below
Wildfires and Air Quality – Part 1
AirNow Maps and Sensors for Community Smoke Monitoring

                                           9/15/20 9:48am ET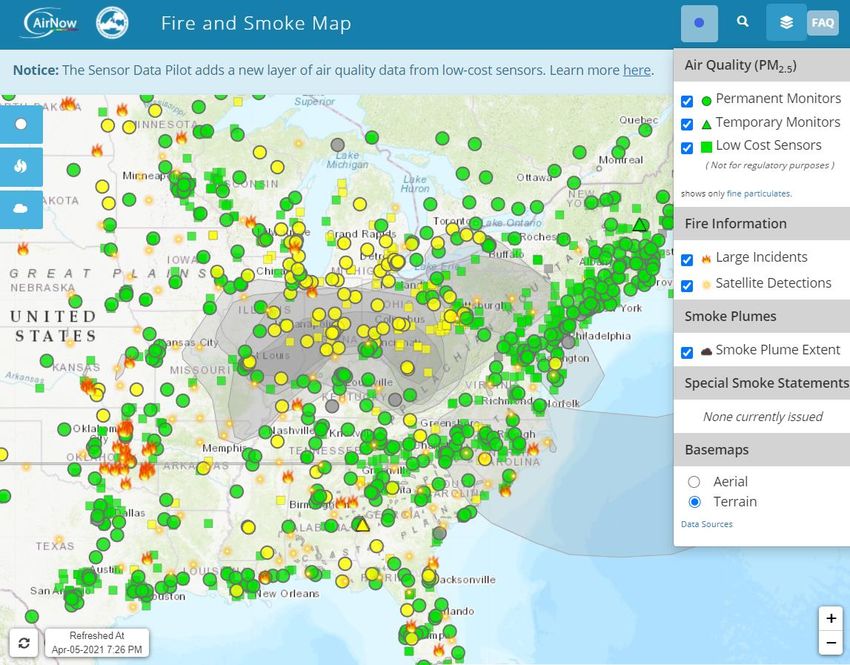
Introductions

   Brian McCaughey        Andrea Clements, Ph.D.      Amara Holder, Ph.D.
                             U.S. EPA Office of        U.S. EPA Office of
      Hoopa Valley             Research and              Research and
       Tribal EPA              Development               Development
                            clements.andrea@epa.gov   holder.amara@epa.gov
    brian4epa@gmail.com                                   919-541-4635
                                 919-541-1363

                                                                             2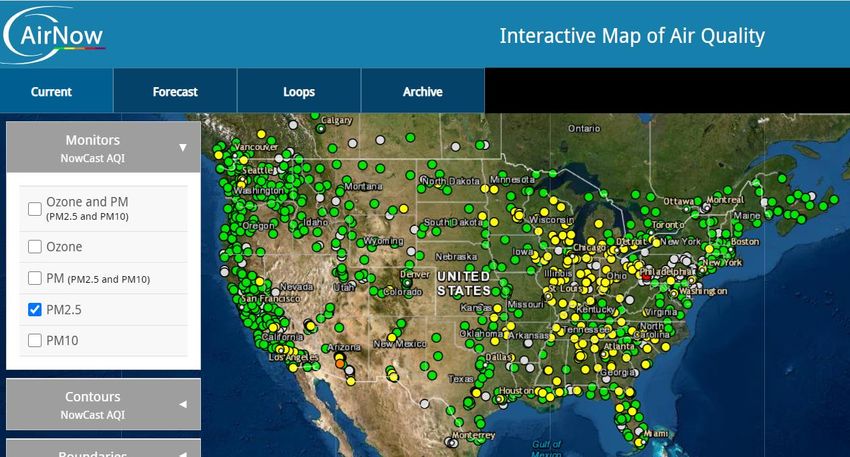
Overview of Today’s Presentation
We’ll discuss…
• The motivation and background for this work
   – Challenges of air quality monitoring in tribal areas
• How PurpleAir sensors are increasingly being used for air monitoring
   – PurpleAir primer
• The integration of sensor data onto the AirNow Fire and Smoke Map
   – Comparison with the PurpleAir Map
• How PurpleAir sensors can facilitate community air monitoring
   – Factors to consider
   – Hoopa Valley Tribal PurpleAir Monitoring Network
• ORD’s research on improving indoor air quality during smoke episodes
• Where to find helpful resources
                                                                         3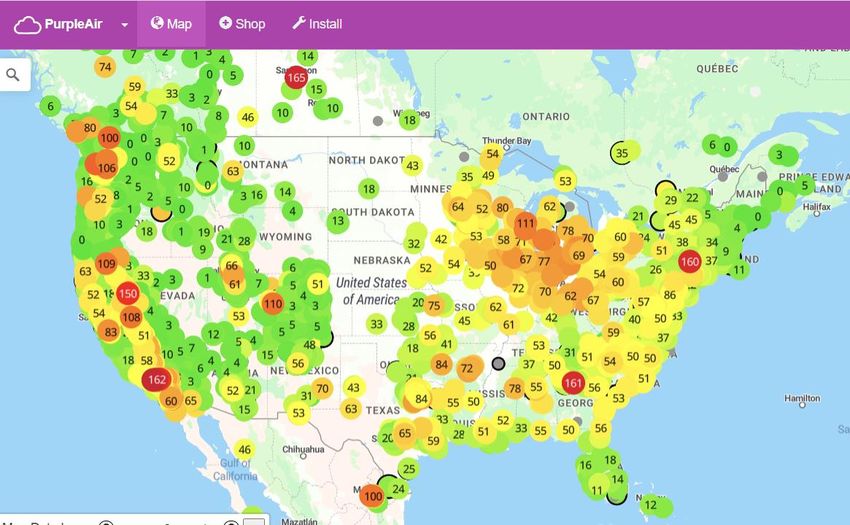
Many parts of the U.S. have significant air quality impacts from
wildfire smoke

                                                           9/15/20 9:48am ET

                                                                           4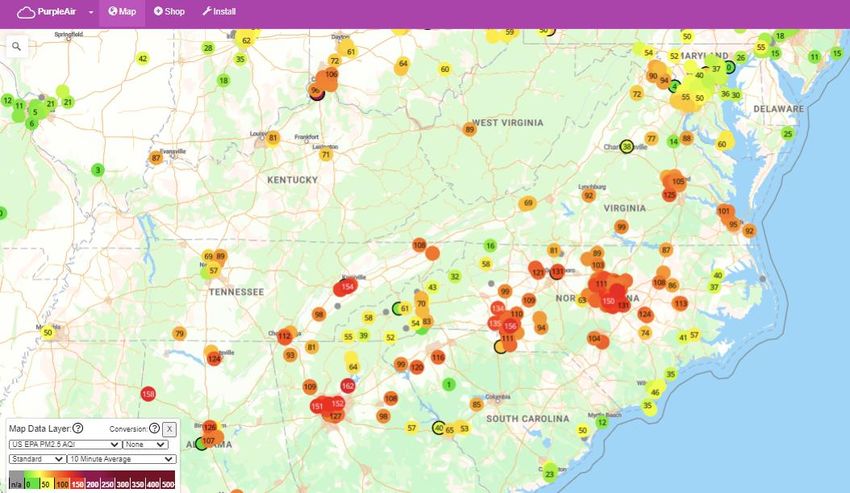
The Hoopa Valley Tribe in CA
     Pre-Fire

                               5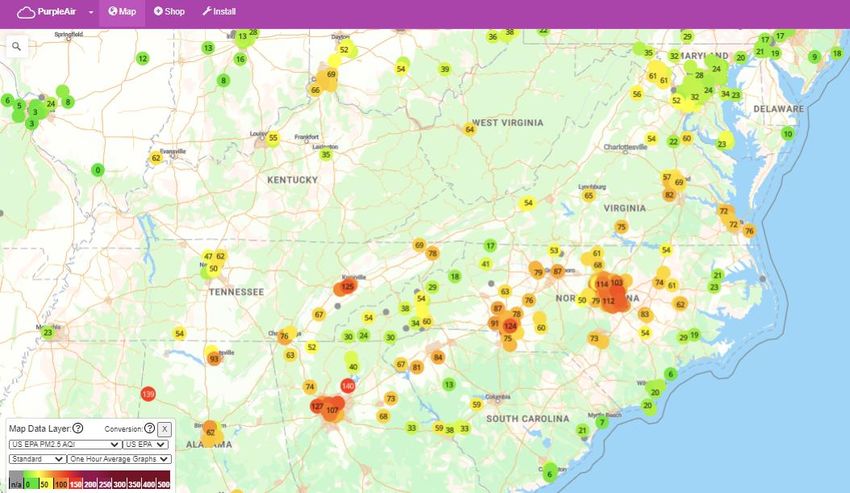
The Hoopa Valley Tribe in CA has experienced severe smoke episodes

        Red Salmon Complex Fire
        August 2021
        AQI: Unhealthy of Sensitive Groups

                                                                     6
The Hoopa Valley Tribe in CA has experienced severe smoke episodes

        Red Salmon Complex Fire
        September 2021
        AQI: Unhealthy

                                                                     7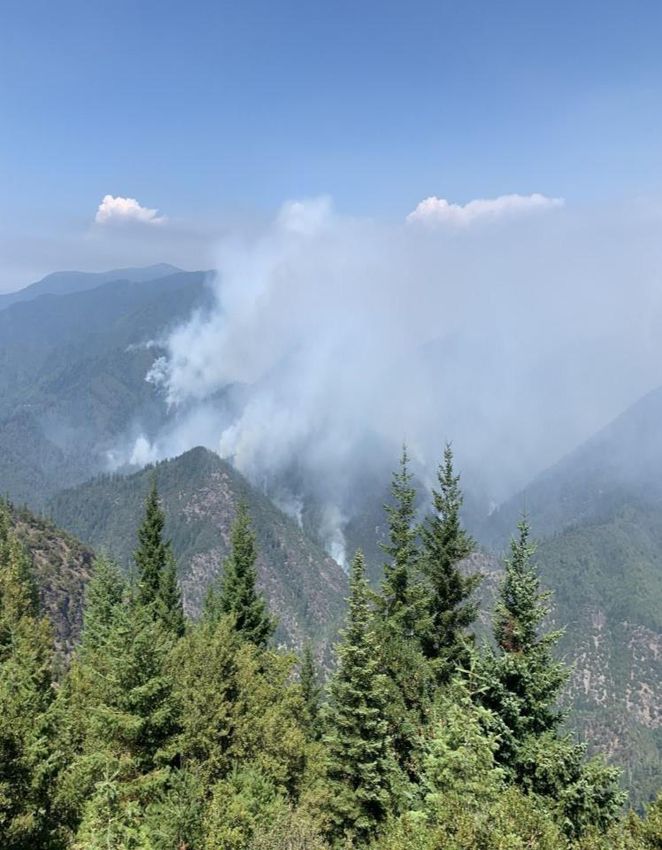
The Hoopa Valley Tribe in CA has experienced severe smoke episodes

        Red Salmon Complex Fire
        October 2021
        AQI: Hazardous

                                                                     8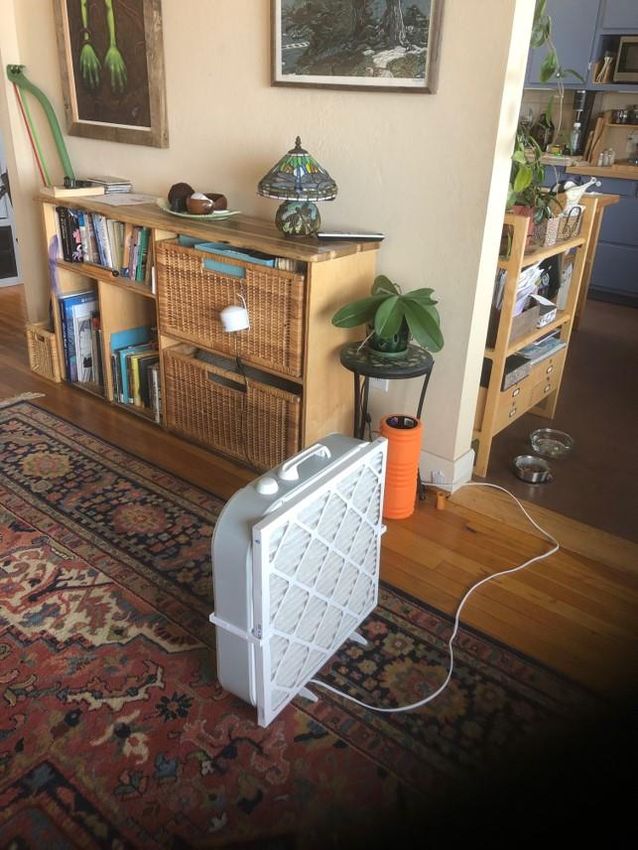
Many areas impacted by wildfires have few or no air quality
 monitors
               Burned Area          Populated Area                Monitored Area

https://maps.nwcg.gov/sa/    https://www.eia.gov/state/maps.php             https://fire.airnow.gov   9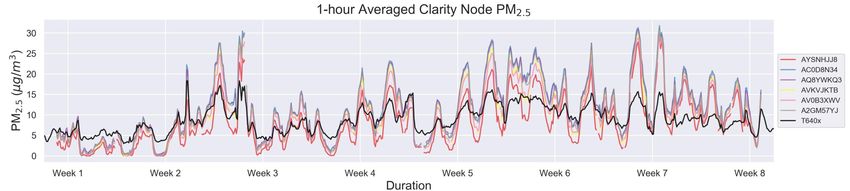
Challenges to using sensors to inform public health guidance
• Air sensors can fill in the gaps
  • Less expensive and more portable than traditional
    monitoring technologies                            Red Salmon   Complex fire,
  • Especially important in rural areas and during smoke
    impacts
                                                       CA, 2020
• PurpleAir sensors are widely used
   • PurpleAir data is reported on by media outlets
   • PurpleAir data does not agree with regulatory
     monitoring network
   • Contradicting data leads to confusion by the public
• Indoor air is also impacted by wildfire
  smoke
   • Can sensors be used to evaluate indoor air quality?
   • What approaches are needed to make clean air
     spaces during wildfires?
                                                                                    10
PurpleAir Primer
11Primer on PurpleAir Sensors: Hardware and Outputs
PurpleAir Data Hardware
• 2 Plantower PMS5003 PM sensor (channels A & B)
• BME280 pressure, temperature, humidity sensor
• Sample for alternating 10-second intervals A & B channels
• Generate 2-minute averages
• Previously 80-second averages
PurpleAir Data Outputs
• Reports PM1, PM2.5, PM10, particle count PurpleAir underside view
• Reports internal temperature
and relative humidity (RH)
User supplies information at
PurpleAir Data Storage
registration
• Streamed to the PurpleAir cloud via WiFi • Name
• Public – displays on the public PurpleAir map • Location
• Private – displays only when the owner is logged in; data • Indoor/Outdoor
can be download/viewed only with owner permission • Public/Private
• Stored locally on a microSD card (PA-II-SD model only)
12Primer on PurpleAir Sensors: Correction Factors
PurpleAir provides PM data directly from the Plantower
sensors with two correction factors (cfs)
• cf=atm described on the PurpleAir website as “outdoor”
• lower concentrations
• Currently displayed on PurpleAir map for outdoor
PurpleAir, Plantower cf=1 [Higher]
sensors
• cf=1 described on the PurpleAir website as “indoor”
• higher concentrations
• Currently displayed on PurpleAir map for indoor sensors
Two important take-aways
• Both cfs typically report concentrations that are higher than
collocated regulatory monitors
• Comparing indoor/outdoor sensors on the PurpleAir map may
be confusing at concentrations above 25mg/m3
Previously, PurpleAir had these labels switched PurpleAir, Plantower cf=atm [Lower]
• Easy check: cf=1 is higher
• Helps create confusion in the literature about which cf was
used
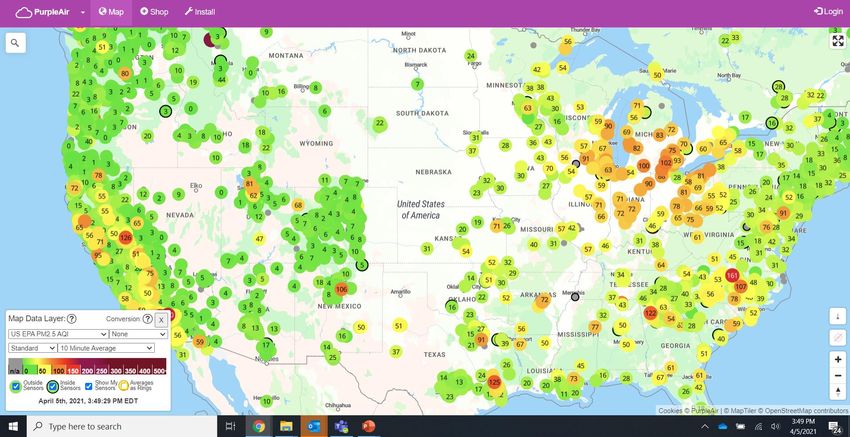
13Primer on PurpleAir Map: Data Display
PurpleAir’s Map allows users to view sensor data in multiple ways
Image source: PurpleAir.com/map 14Primer on PurpleAir Map: Data Display
Conversions can be applied to the
This first drop-down menu can be used to select what data data with this drop-down menu
is displayed • The default is “none” or no
• The default is the “US EPA PM2.5 AQI” which directly Conversion conversion applied
Info Button
relates the sensor data to the Air Quality Index (AQI)
• Can use the menu to look at “Raw PM2.5 in mg/m3”
• Other options exist including T and RH
This drop-down menu can be used to select how
the data is averaged
• The default is to look at 10-minute averages
• Users can choose to view real-time data
• Other averaging options are also available These radio buttons can be used to select
(30-minute, 1-hour, 1-day) which sensors are displayed on the map
• The styles used show how the sensors
can be distinguished on the map
Image source: PurpleAir.com/map 15Primer on PurpleAir Map: Online Conversions
PurpleAir’s Map allows users to apply a conversion (or
correction equation) to the data too
• Currently, 4 different conversion factors can be applied to
data on the map
• The conversion information page provides more
information about the available options
• Each conversion is based on a body of research with
links and equations provided
• “US EPA” was developed using data from across the
US for both everyday and smoke impacted times
• “AQ and U” was developed by U. Utah during
wintertime in Salt Lake City
• “LRAPA” was developed by Lane Regional Air
Protection Agency for woodsmoke dominated times
• “Woodsmoke” was developed by UNE during smoke
from domestic wood heating in Australia
• Currently, converted data cannot be downloaded
Image source: PurpleAir.com/map 16Integration of Sensor Data onto the
AirNow Fire and Smoke Map and
PurpleAir Map
17Information about the data sources
Image source: PurpleAir.com/map
• Trusted source of high-quality air quality information • Extensive collection of crowdsourced
collected by certified instruments and trained staff participatory air quality measurements
• Multiple pollutants are measured • High-time resolution – 2-minute data
• Citing protocols to avoid hyper-local sources • Measurements may be more local to the
• Data is quality checked by trained professionals consumer
• Website reports air quality hourly, using the • Uncertain sensor citing and maintenance
NowCast AQI, and provides health-based messaging • Uncertain data quality
Although both sources of information are valuable, this is not an apples-to-apples comparison
18Integration on the Fire and Smoke Map
Image source: PurpleAir.com/map
Fire
Information
• Incident
Reports
• Fire detects
• Smoke
plume
extents
• Select only PM2.5 measurements • Select only outdoor sensors • Includes ground
– Include permanent monitors • Average data to 1-hour and satellite
– Include temporary monitors • Use the A&B channels to remove observations
questionable data • Includes reports
• Apply a correction equation to from specialists
address over-estimation of
A lot of work goes into making these data concentration
sources comparable and it will all be done • Apply the NowCast AQI
behind the scenes on the map
19opens search data layer April 2021
Fire and Smoke Map In Your Area location controls
sidebar
Help
• user guide
• FAQ
• feedback
opens
• legend
In Your
Area
sidebar
The pilot version
map was launched
before the 2020 fire
season.
An update is
expected in July
2021.
refreshes zoom
data 20Comparison between AirNow Fire and
Smoke Map and PurpleAir Map
21Dec 2020
Differences between PurpleAir AQI Map and the AirNow AQI Map
Map Averaging Sensors Temporary Regulatory Pollutant(s) QA Procedures
Time Smoke Monitors
Monitors
NowCast Preliminary data
AirNow ✓ PM2.5 and/or O3
(~3 hr) quality assessment only
Cleaning steps (slide
AirNow Fire
NowCast 20)
and Smoke ✓ ✓ ✓ PM2.5
(~3 hr) Manually flagged
Map
sensors removed
outdoor
PurpleAir
(CF=atm) 10 – min
Default ✓
Indoor Modifiable
(CF = 1) A-B disagreement
downgraded and
PurpleAir LRAPA PM2.5
10 – min hidden behind other
correction AQ&U ✓
Modifiable data points
options Woodsmoke
U.S. EPA 2-min, NOT
✓
correction modifiable
22Dec 2020
AirNow Fire and Smoke Map vs. PurpleAir Map
AirNow Fire and Smoke map displays • PurpleAir defaults to indoor (cf=1) and
PurpleAir outdoor data that has been outdoor (cf=atm) sensors 10-minute
cleaned, averaged, and corrected with the averaged data
NowCast algorithm applied • Sensors with A & B disagreement are
displayed behind other sensors 23Dec 2020
AirNow Fire and Smoke Map vs. PurpleAir Map
On PurpleAir Map you can select to:
• Remove the indoor sensors
• Use U.S. EPA correction, but it only applies to
outdoor sensors and 2-minute data
24Dec 2020
AirNow Fire and Smoke Map vs. PurpleAir Map
AirNow shows discrete colors PurpleAir displays a continuous
corresponding to the AQI range of colors in between AQI
categories categories
25Key Considerations about PurpleAir
Sensors and Crowdsourced Data
26Issues with PurpleAir Sensors and Crowdsourced Data
1. Sensors can fail
• Air sensors do not have status codes to indicate failures
• Most failure captured by A & B channel cleaning steps
• Lifespan unknown, drift hard to identify
2. Sensors can be mislabeled, mislocated, or poorly sited
3. Sensors can saturate at high concentration
• ≥ 250 µg m-3 nonlinear correction under development
4. Sensors may not respond the same to all sources
• Light scattering-based sensors are sensitive to PM optical properties
and may not respond the same to all sources (e.g., dust)
Frequent sensor data review will be necessary until algorithms are developed
to detect malfunctioning, improperly sited, or mislabeled sensors
27Consideration 1: Sensors can fail
• Most PurpleAir failures are captured by A & B channel cleaning steps.
Mazama Science developed a list of example failure modes that can be found here:
https://mazamascience.github.io/AirSensor/articles/articles/purpleair_failure_modes.html
Briefly:
• Single channel noise
• Large jump in single channel data
• Single channel tracks RH or T
• Single channel stuck at a number or zero
• Sensor drift with age is not easy to identify.
• Sensor lifespan under different PM2.5 concentrations or ambient conditions is
still unknown.
28Consideration 2a: Sensors Can Be Mislabeled or Mislocated
Example of outdoor
PM2.5 map Temperature map sensor that disagrees
with neighbors
• Compare T and PM
from surrounding
sensors to identify
sensors indoor
• Diurnal trends can
be used to identify
mislabeled sensors
PM – Mislabeled Sensor T – Mislabeled Sensor
Currently, sensor data
review will be necessary to
identify these issues
29Consideration 2b: Sensors may be poorly sited
Sensors operated by the public may be poorly sited. We investigated a few
suboptimal siting scenarios to identify the impact.
Next to strong Close to the Obstructed
air flow ground air flow
40
Close to ground
By AC unit
Obstructed air flow
Nearby PAs PM2.5 (µg/m )
1:1 line
3
30
20
Siting Regression R2 RMSE (µg m-3) MBE (µg m-3)
Ground Y = 0.98x +0.31 0.98 0.69 0.09
10
AC Unit Y = 0.96x + 0.51 0.98 0.71 0.03
Obstructed Y = 0.86x + 0.14 0.88 2.30 -1.32
0
0 10 20 30 40
Most siting scenarios provide acceptable data! Post Mounted PA PM2.5 (µg/m )
3
30Consideration 3: Sensors Can Saturate at High Concentrations
• PurpleAir has a linear response up to
⁓200 mg m-3
• Lab studies have shown:
• Polynomial fit may be better at higher
concentrations (Sayahi et al. 2019)
• PurpleAir stops responding at about 11,000
– 13,000 mg m-3, depends upon PM
composition and size (Zou et al. 2019)
• New high concentration correction
developed from crowdsourced CA and
OR wildfire collocated data at very high
concentrations
• We are working to finalize and include
an updated equation on the AirNow
Fire and Smoke map
31Consideration 4: Sensors may not respond the same to all sources
• Sensors respond to
PM light scattering
• Large dust particles
scatter much less
light than small
particles per unit
mass
• Sensor low bias
compared to
reference monitors
• U.S.-wide correction
is not applicable to
some PM sources
June 26,2020 3:37 PDT
Image source: Duc Nguyen BAAQMD 32Value of the Sensor Data Pilot and the
AirNow Fire and Smoke Map for
Communicating Air Quality Information
to the Public
3334
An Example of Community
 Monitoring in Hoopa, CA

                           35
What can communities do to reduce their exposure to wildfire smoke?
EPA partnered with Missoula, MT and the Hoopa
Valley Tribe in CA to develop research to meet
their needs to protect public health from wildfire
smoke
Partner discussions led to these research
questions:
• What interventions are effective for reducing wildland fire
smoke exposures and risks?
• What science is available to support recommendations for
communities to develop clean air spaces in larger buildings
(e.g., schools, community centers)?
• How effective are portable air cleaners (PACs) during smoke
Winnacker
events?
36Used a general sensor monitoring development framework to design a
monitoring plan for Hoopa
✓ Define your monitoring goals
Monitor across the community and indoors in
public spaces
✓ Select a sensor
Desired to smoke monitor in multiple
locations, needed a precise, low-cost PM
sensor, selected PurpleAir
✓ Monitoring sites and setup
Ensured sites had power, WiFi, and secure
location to install PurpleAir
✓ Collect and maintain data
Data transmitted through WiFi and stored on
SD card
✓ Evaluate data
Data displayed privately on PurpleAir map to
study partners only, used to diagnose sensor
issues in remotely in real-time
Basic steps of any monitoring plan
37Indoor Outdoor
How to setup a sensor indoors and outdoors
• Identify monitoring sites with air quality
significance
• Places with sensitive or vulnerable populations
• Places with community concerns
• Places with outdoor workers
• Places without monitors
• Near roadways
• Ensure site can support sensor deployment When mounting sensor consider placing the
• Meets infrastructure requirements sensor:
─ Onsite power or sun exposure for solar • At least 180° free air flow
• Near breathing height indoors
─ WiFi/Cell/Satellite signal • At least 1 meter above ground outdoors
• Secure from tampering • Upwind of any nearby structures
• Supportive host – e.g., schools, fire stations, • Away from vegetation
libraries, community centers • Away from PM sources or strong air flows:
- Exhaust vents
• Safe to access – e.g., no fall or shock hazards - AC units
- Dusty roads
• Install sensor for optimal data quality - Cooking appliances (stoves/grills)
Adapted from Code of Federal Regulations Title 40 Part 58 Ambient Air Quality Surveillance
- Fire pits/fireplaces
Appendix E Probe and monitoring Path Siting Criteria for Ambient Air Quality Monitoring 38Description of the Hoopa, CA monitoring network
• Initial collocation at central monitoring platform to quality
control the sensors and develop site specific correction
equation
• Deployed sensors at multiple outdoor locations and in
multiple buildings
• Sampling started in November 2019
and is ongoing
• Mid-study collocation check planned
for spring 2021
• Continue to sample year-round to
observe impacts of woodsmoke during
winter and spring and wildfire smoke
during summer and fall
Photograph courtesy of Hoopa Valley Tribe
39Sensor monitor site setup and building characteristics
• Measured at 10 outdoor locations across the valley and nearby
• Measured in 14 public buildings, targeted buildings where people
may stay for extended durations and those that may be used as a
clean air shelters:
• Workplaces
Land Management, Wildland Fire,
Forestry, Radio Station
• Places with Sensitive/Vulnerable
Populations
Hoopa Elementary & High Schools, After
School Program, Early Childhood
Development Center, Senior Nutrition Center
• Potential Clean Air Centers
Neighborhood Facility, K’ima:w Medical
Center, Baptist Church
• COVID adaptation Private Residence
Brian’s house
Photographs courtesy of Hoopa Valley Tribe 40Preliminary results from 2020 Wildfire Season
Indoor PurpleAir sensor measurements demonstrated the effectiveness of high-efficiency
particulate air (HEPA) filter use during extreme smoke events.
• Building has central air
PurpleAir PM2.5 at Daycare
conditioning (AC)
(US-wide correction 223 μg/m3)
system
• 1- 3 people occupy the
building daily
During this
smoke episode,
doors and
windows were
kept closed and
an industrial
rental air
cleaner was
used
41Preliminary results from 2020 Wildfire Season
Some indoor sites were able to maintain consistent indoor concentrations, even when
outdoor concentrations were extremely high.
PurpleAir PM2.5 at Local Agency Building • Building has no central
(US-wide correction 223 μg/m3) air conditioning (AC)
system
• Cooling is achieved
with a window AC unit
• 30 – 40 people occupy
the building daily
• During this smoke
episode, doors and
windows were kept
closed and borrowed
air filters were used
(filter type not
specified)
42Preliminary results from 2020 Wildfire Season
Some indoor sites saw little-to-no reduction of PM2.5 indoors
PurpleAir PM2.5 at High School Classroom • Building has a central
(US-wide correction 223 μg/m3) air conditioning (AC)
system with unknown
MERV* rating
• 1 - 4 people occupy the
building occasionally
• During this smoke
episode, doors and
windows were kept
closed and no
additional air filtration
was used
*MERV 43
= Minimum Efficiency Reporting ValueLessons learned from a Community Sensor Network
1. Initial batch sensor collocation can identify defective sensors and improve sensor precision with
individual sensor corrections
2. Long term sensor collocated with reference useful to ensure correction equation is accurate for
your location
3. Power strips help prevent unplugging indoors and data loss
4. Sensor installation at an inaccessible, secure site is recommended to prevent tampering or theft
5. Online data reporting is useful to rapidly identify sensors that have gone offline or are failing
44Indoor/Outdoor measurements are paired with HVAC evaluations
Preliminary data from Missoula, MT study
20
Onsite inspection of building HVAC
Number of Buildings
56%
condition: 15
▪ Air handling settings/schedules 10
▪ Use of portable air cleaners
5
▪ HVAC system and filter conditions 19%
13% 3%
9%
▪ Gaps and seals around filters, doors, 0
Like New Lightly Used Time to Past
and windows Used Change Service
▪ Door and window inspections Life
▪ Building age and construction type
Polyester
▪ Room pressure Media
▪ Notes of potential indoor sources (e.g.,
cooking, tobacco smoke, vacuuming/sweeping)
▪ Building open/close hours Pleated
Filters
▪ Door counters to estimate occupancy
45Work in Progress: Development of a building checklist to HVAC identify
issues
✗ Right Sized Filters ✗ Unobstructed Air Outlets ✗ Clean Filters
Dirty Filters
Credit: Tom Javins
Obstructed air outlets
Crushed filter (too large for
filter rack) 46Under Development: ASHRAE* Guideline 44 – Protecting Commercial
Building Occupants During Wildfire Events
• How to make buildings with air handling units
for heating ventilation and air conditioning
(HVAC) smoke ready
– Upgrade to MERV 13 filters and have extra filters
on hand for frequent replacement
– Maintain HVAC system, identify and repair broken
dampers and controls
– Test and optimize HVAC flows to ensure positive
building pressure and sufficient ventilation
– Limit smoke intrusion by weatherizing building,
closing windows, limiting door openings
– Monitor PM2.5 levels indoors
– Identify indoor sources of PM2.5 and limit activities
during smoke episodes
– Use portable air cleaners if necessary
https://www.ashrae.org/file%20library/technical%20resources/covid-
*ASHRAE = American Society of Heating, Refrigeration, and 19/guidance-for-commercial-building-occupants-from-smoke-during-wildfire-
Air-conditioning Engineers events.pdf
47Work in Progress: Evaluating the safety and effectiveness of do-it-yourself
(DIY) air cleaners
DIY Air cleaner = Box fan + furnace filter DIY operated
indoors in San
• Low-cost and accessible approach to air cleaning Francisco during PM2.5
Sensor
2020 smoke
• How to instructions from Confederated Tribes of the episode
DIY Air
Colville Reservation Cleaner
https://www.cct-enr.com/box-fan-filter
• Partnering with UL for safety evaluations expect results
this year Fan
turned on
• For now, recommend using only new (since 2012) box 120
Outdoor
fans with added safety features 100 Indoor
PM2.5 (µg/m )
80
3
• Currently evaluating effectiveness in the lab and in
60
homes
40
• Preliminary data show DIY air cleaner is as effective as 20
small size commercial air cleaners (clean air delivery 0
rate 40 on low, 110 on high) 2:00 PM
10/1/2020
4:00 PM 6:00 PM 8:00 PM
48Prize-based Challenge to Create Low-Cost
Devices to Clean Indoor Air
• Encourages development of new, effective, low-cost approaches to
remove PM2.5 from indoor air, particularly high concentrations due
to smoke events or high pollution episodes
• Identifies approaches that provide cooling and can operate during
a power outage as desirable
• More information on the challenge can be found on these sites:
▪ EPA webpage
▪ Press release
▪ InnoCentive page
▪ Challenge.gov
49Take Home Summary
AirNow Smoke Map
• A significant amount of research has been done by EPA,
local agencies, and academia to better understand Uncorrected PurpleAir
PurpleAir performance giving us more confidence in
reported measurements
• EPA’s PurpleAir correction equation improves the accuracy
of PM2.5 measurements for many different cases including
during smoke conditions
• PurpleAir sensors provide additional spatial variation of
PM2.5 on the AirNow Smoke map
• Air sensors are useful tools for making indoor/outdoor
measurements and in demonstrating the effectiveness of
interventions aimed at reducing smoke exposures
• Work continues to develop methods to clean indoor air
during wildfire smoke episodes Corrected PurpleAir
50Project Publications & Websites
EPA Air Sensor Research Overview
https://www.epa.gov/air-sensor-toolbox/epa-air-sensor-research-overview
Wildfire ASPIRE Study
https://www.epa.gov/air-research/wildfire-study-advance-science-partnerships-indoor-reductions-smoke-exposures
Project Publications:
• Holder, A., A. Mebust, L. Maghran, M. McGown, K. Steward, D. Vallano, R. Elleman, and K. Baker, 2020. ‘Field Evaluation
of Low-Cost Particulate Matter Sensors for Measuring Wildfire Smoke’, Sensors, DOI:10.3390/s20174796
• Barkjohn (Johnson), K, B. Gantt, A. Clements, 2020 ‘Development of a United States Wide Correction for PM2.5 Data
Collected with the PurpleAir Sensor’, Atmospheric Measurement Techniques Discussion, DOI:10.5194/amt-2020-413
• Davison, G., K. Barkjohn (Johnson), G. Hagler, A. Holder, S. Coefield, C. Noonan, B. Hassett-Sipple, 2021 ‘Creating Clean
Air Spaces During Wildland Fire Smoke Episodes: Web Summit Summary’, Frontiers in Public Health,
DOI:10.3389/fpubh.2021.508971
• Barkjohn (Johnson), K, A. Holder, S. Frederick, A. Clements, (in preparation) ‘PurpleAir PM2.5 U.S. Correction and
Performance During Smoke Events’
51Acknowledgements
AK: State of Alaska, Citizens for Clean Air OH: Akron Regional Air Quality Management District
AZ: Maricopa County Air Quality Department OK: Quapaw Nation, Oklahoma Department of Environmental Quality
CA: Hoopa Valley Tribe, San Luis Obispo County Air Pollution Control UT: University of Utah, Utah Department of Environmental Quality
District, Mojave Desert Air Quality Management District, Antelope
Valley Air Quality Managment District, California Air Resources Board, VA: Virginia Department of Environmental Quality
Santa Barbara County Air Pollution Control District, Air Quality Sensor
Performance Evaluation Center, Ventura County Air Pollution Control VT: State of Vermont
District, Bay Area Air Quality Management District
WA: Washington Department of Ecology, Puget Sound Clean Air
CO: Colorado Department of Public Health and Environment Agency
DE: Delaware Division of Air Quality WI: Wisconsin Department of Natural Resources
FL: Sarasota County Government Federal: Forest Service, Wildland Fire Air Quality Response Program,
National Park Service, EPA Region 9, EPA Region 10, Lauren Maghran,
GA: EPA Region 4, Georgia Environmental Protection Division Ed Brunson, Mike McGown, Sam Frederick, Brett Gantt, Ian Vonwald,
Heidi Vreeland, Gayle Hagler
IA: Iowa Department of Natural Resources, Polk and Linn County Local
Programs, and the State Hygienic Laboratory at the University of Iowa
MT: Missoula County, Montana Department of Environmental Quality Contact:
NC: Forsyth County Office of Environmental Assistance & Protection, Holder.Amara@epa.gov
Clean Air Carolina, UNC Charlotte, North Carolina Department of Clements.Andrea@epa.gov
Environmental Quality
Although this work was reviewed by EPA and approved for publication, it may not necessarily reflect official Agency
policy. Mention of trade names or commercial products does not constitute endorsement or recommendation for use. 52Wildfire Smoke Resources
AirNow Fire Page https://www.airnow.gov/fires/
• AirNow fire and smoke map
• Factsheets
• Current Smoke Advisories
• Smoke Ready Toolbox
• Wildfire Smoke Guide for Public Health Officials
• For questions about AirNow Sensor Data Pilot Contact:
Sensordatapilot@epa.gov
Air Sensor Resources
Air Sensor Toolbox http://www.epa.gov/air-sensor-toolbox
• Air Sensor Guidebook
• Air Sensor Loan Programs
• Sensor Evaluation Results
• Technical Information about U.S.-Wide Correction
Indoor Air Quality Resources
Wildfires and Indoor Air Quality (IAQ)
https://www.epa.gov/indoor-air-quality-iaq/wildfires-and-indoor-air-quality-iaq
• Smoke infiltration information
• Exposure reduction information (HVAC, Respirators, Portable Air Cleaners)
53Supplemental Slides
54Quality Assuring and Correcting Other Sensor Types
Corrections for different sensors
• Many PM sensors show similar trends to reference 60
1:1
instruments 50 AQY
Clarity
• Sensor data must be corrected to be more comparable 40 RAMP
Maxima
Sensor PM2.5
– May be dependent on make/model even if similar internal components 30 PA
• Data cleaning methods also dependent on make/model 20
– PurpleAir is unique with duplicate PM measurements 10
• Good agreement between sensors of the same 0
make/model is necessary for fleet-wide corrections -10
0 10 20 30
Reference PM2.5
55You can also read