SMART STEEL Investor Presentation - July 2018
←
→
Page content transcription
If your browser does not render page correctly, please read the page content below

SMART STEEL

    Investor Presentation
    July 2018

1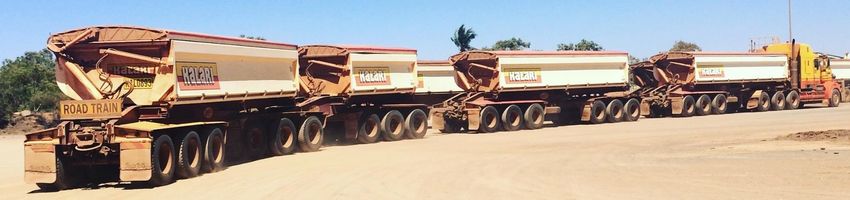
Agenda
Company set-up and business model
Market trends
Financials
Company outlook
Takeover V.Orlandi S.p.A.
Takeover York Transport Equipment (Asia) Pte. Ltd.
Appendix
2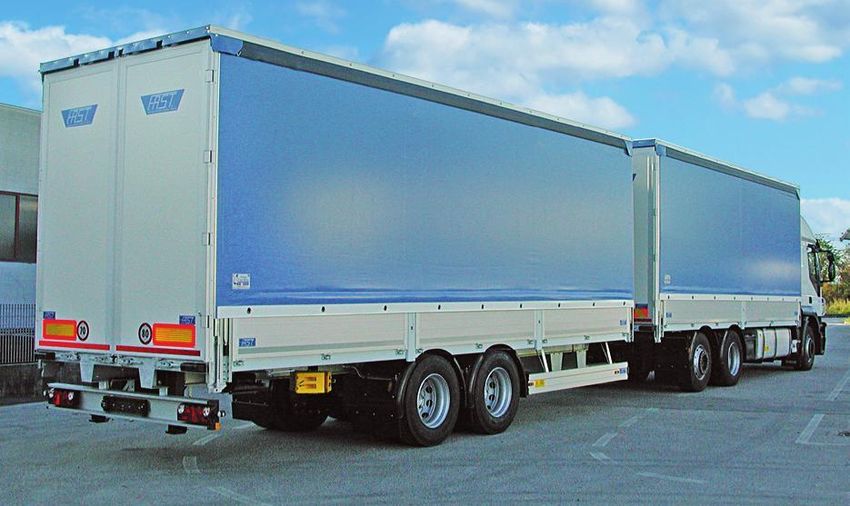
Company set-up and business model 3
SAF-HOLLAND: Europe’s largest listed commercial vehicle supplier

    Facts & figures                                         Key components and systems
     • One of the leading global producers of key
                                                                                          Kingpins
       chassis systems and components for mostly the
       trailer but also the truck, bus and vocational                      Fifth wheels                         Trailer OEM
                                                                                                               ~62 % of sales
       vehicle industry
     • 41 subsidiaries featuring 22 manufacturing sites
       on six continents
     • Approx. 4,400 employees
     • Network of approx. 10,000 aftermarket spare
       parts and service stations around the world

                                                           Truck OEM
                                                          ~13 % of sales
    Key financials FY 2017
                                                                     Suspensions
     •   Sales: € 1,138.9 mn                                          for specialty
     •   Adjusted EBIT: € 91.2 mn                                        trucks     Landing gear
     •   Adjusted EBIT margin: 8.0%                                                                  Axle and suspension systems
     •   EPS (undiluted): € 0.95
     •   Free cash flow: € 29.7 mn (py: € 67.7 mn)
                                                           Aftermarket
     •   Equity ratio: 30.2%                                                          Spare parts
                                                          ~25 % of sales

4
SAF-HOLLAND: Product portfolio

      Trailer axles and                    Truck and bus            Fifth wheels, kingpins and landing gear
      suspension systems                   suspensions

      SAF-HOLLAND offers a comprehensive product portfolio for one-stop shopping also covering the
      aftermarket.
5
Key OEM customers: Trailer, truck and bus manufacturers

       Almost every major truck, trailer and bus OEM is a SAF-HOLLAND customer.

6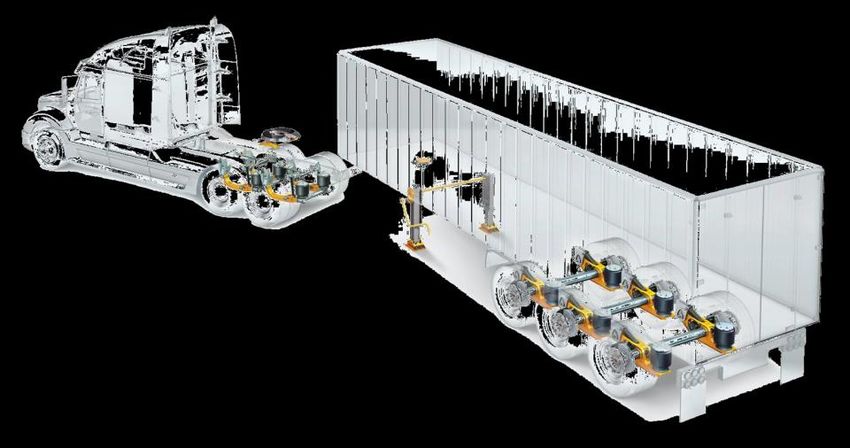
End customers: The fleets

       SAF-HOLLAND focuses on fleet operators (infrastructure, logistics, specialty, heavy duty, port, etc.).

7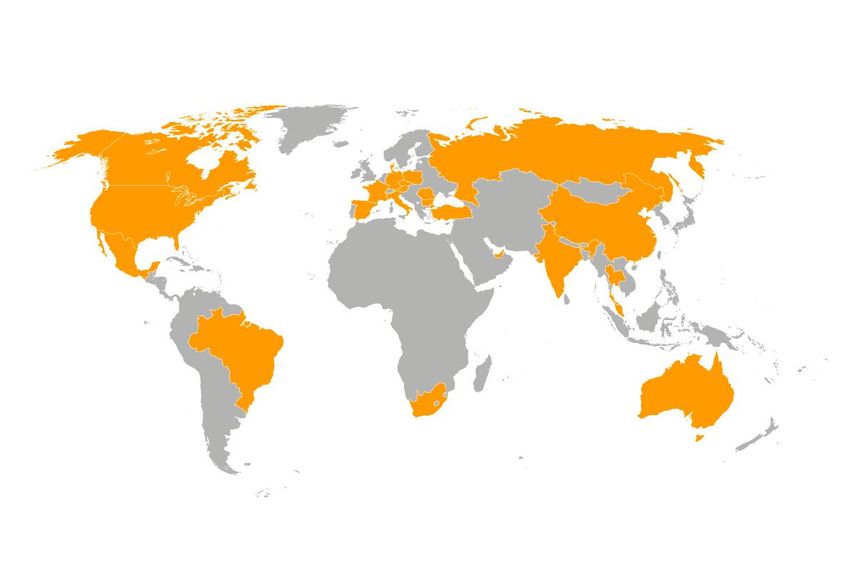
Unique business model in a 4% CAGR growth industry featuring a
    strong competitive position

    1. Balanced structural and regional set-up with varying regional market trends and
       replacement cycles in trailers versus trucks or buses

    2. Strong position in oligopolistic markets driven by product innovation and
       applicational engineering excellence

    3. Unique selling model featuring direct access to broad end customer base

    4. High share of high-margin Aftermarket business counterbalancing cycles in the
       truck and trailer OEM industry

    5. Well positioned in a 4% CAGR industry (mega trend) supplemented by structural
       technological growth drivers

    6. Solid financial profile and cash generation as a basis for financing further growth
       and dividend payouts

8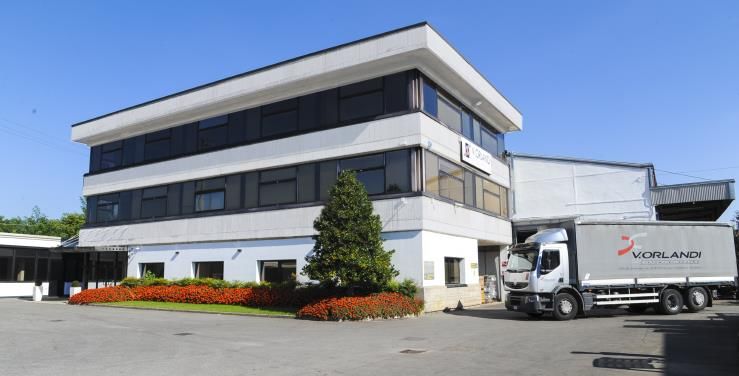
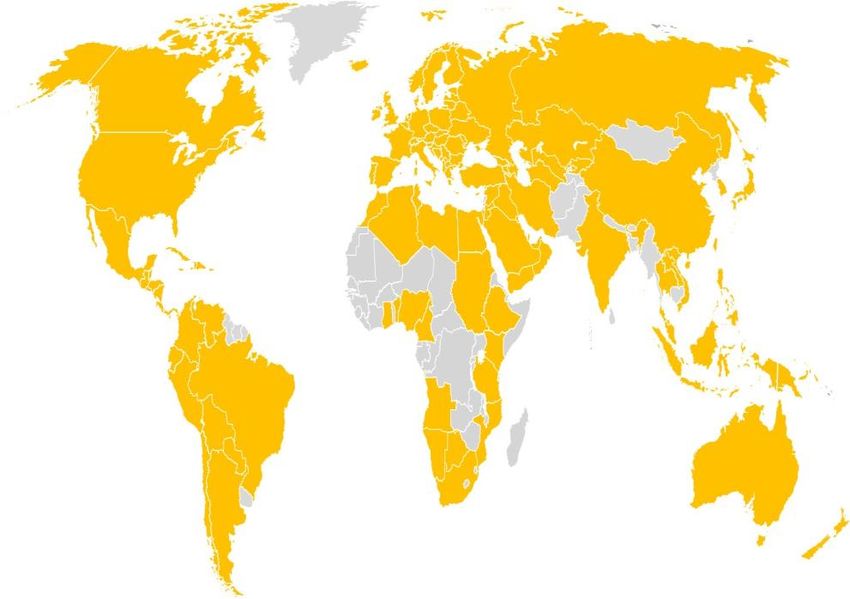
1     A multinational company expanding globally
    Sales regions: 90% of sales in Europe and North America
    22 production sites
                                                                         Turkey
                            Italy             Germany                    Duzce-Istanbul
     Canada                                   Bessenbach / Keilberg
                            Flero (Brescia)
     Woodstock                                Bessenbach / Frauengrund
                            Nave
                                              Singen                                              United Arab Emirates
                                                                                                  Dubai

                                                                                                                China
                                                                                                                Bautou
                                                                                                                Xiamen
                                                                                                                Qingdao

     USA
     Cincinnati                                                                                                 Singapore
     Dumas
     Warrenton South
     Warrenton North
     Wylie
                                                                                                                 Australia
                                                                                                                 Melton

                                                                                          India
                       Brazil                                                             Pune
                       Alvorada
                                                       South Africa
                                                       Johannesburg                       Sriperambadur Taluk

9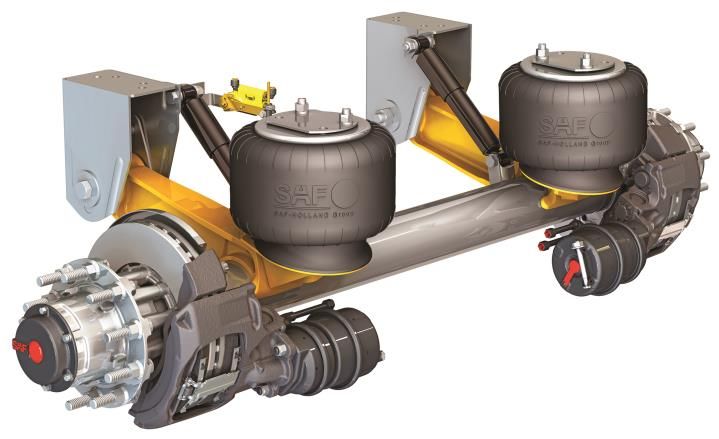
2       Strong position in oligopolistic European and North American markets

           Trailer axles and                Truck and bus         Fifth wheels, kingpins        Aftermarket service
          suspension systems                 suspensions              and landing gear                points

           Among Top 2                     Among Top 2                Among Top 2                        No. 1

            Among market leaders in every product area supplemented by the largest aftermarket network
            worldwide.
10 Source: L.E.K. Consulting, April 2015
3 Unique selling model based upon direct access to broad
end customer base
Customer feedback with regard to technical
and market requirements
Brand stands for Push Pull
superior product
performance and OEM End customer
aftermarket
excellence
Sales Sales
Sales focusing on fleet managers
> 80% of purchasing decisions taken by the fleets
114 The most comprehensive aftermarket spare parts and service network
worldwide
Approx. 10,000 spare parts dealers and service stations • # 1 Network in Europe and North America: Key asset for
in more than 80 countries guarantee spare parts fleet customers and huge barriers to market entry
availability
• Narrows down volatility from OEM industry cycles and
generates growth based on increasing product
population in the field (“razor and blade” business
model)
• Growth potential from expanding PDC network as well
as GoldLine/Sauer Quality Parts secondary brands
In 15 years axle population in EMEA/I has more than tripled
4,000,000
3,000,000
2,000,000
North America Europe RoW 1,000,000
60% 36% 4%
0
2003 2005 2007 2009 2011 2013 2015
125a Structural growth drivers in North American markets
From basic axle to fully dressed Trend towards disc brake technology
Instead of “naked” beams, customers
15 years of experience in disc brake
technology integration in Europe
increasingly order fully-dressed axle and
suspension systems Safe, efficient and durable technology
Content per trailer grows significanly Higher value sold-in & AM potential
135b China legislation has opened new doors
GB 1589 “overload ban“ legislation New car carrier law
强制性国家标准《汽车、挂车及汽车列车外廓尺寸、
轴荷及质量限值》(GB 1589-2016) 正式发布实施
As of January 2017 no vehicles heavier than
From overload to at least 20% under capacity
49 tons allowed Regulates overall truck-trailer dimensions in
China and eliminates car transporters with
Light weight products become a noticeable double rows until June 2018
selling proposition
Expanding premium segment
Maximum length limit for truck and trailer
combinations in phase 2
145b China legislation has opened new doors: Going premium
GB 7258 legislation Hazardous goods transporters
Disc brake technology mandatory for all Many OEMs start building vehicles complying
wheels of trailers and trucks with new standards before formal implement-
as of January 1, 2019 tation date
Air suspension mandatory for trailers and 10 to 15% of trailer market affected
truck rear axles
as of January 1, 2020 Opportunities also in truck and bus air
suspensions
Legislation extends to sidewall and fence
trailers
156 Strong FCF generation allows for solid dividend payments
Free cash flow after tax, pre-dividend and pre-M&A Dividend payments
in € mn in € per share
80 0.60
70 67.7
0.44 0.45
60
0.40
0.40
50
0.32
40 35.0 0.27
30.8 29.7
30
0.20
20
11.3
10
0 0.00
2013 2014 2015 2016 2017 2013 2014 2015 2016 2017
Sustained strong cash returns (cash conversion of 81%) providing for 2.5 to 3.2% dividend yields in recent
years; SAF-HOLLAND dividend policy in general is to distribute 40 to 50% of net income.
16 Market trends 17
Market trends 2018

     Global trailer forecast in thousand                                                                                          Change                            Change            Change    Share in group
                                                                                    2014           2015          2016            in % yoy                 2017     in % yoy   2018   in % yoy   sales FY2017*
                                        ACT Trailer Shipm.1)                         296           334           313               -6.4                  316        +1.0      352    +11.1
      North America                                                                                                                                                                              approx. 20 %
                                        FTR Trailer Build2)                          292           331           309               -6.6                  314        +2.0      340     +8.4
                                                                                                                                  Change                            Change            Change    Share in group
                                                                                    2014           2015          2016            in % yoy                2017      in % yoy   2018   in % yoy   sales FY2017**
      Western &                                                                                                                                                               319     +1.3
                                        Trailer Production4)                         261           279           304               +8.7                  315        +3.8                         approx. 40 %
      Eastern Europe

     Global truck forecast in thousand                                                                                            Change                            Change            Change    Share in group
                                                                                    2014           2015          2016            in % yoy                 2017     in % yoy   2018   in % yoy   sales FY2017*

      North America                     ACT Truck Build1)                            297           323           228              -29.4                  256       +12.0      324    +27.0
                                                                                                                                                                                                 approx. 11 %
      Class 8                           FTR Truck Shipment2)                         295           320           227              -29.1                  250        +9.5      330    +31.9
                                                                                                                                  Change                            Change            Change    Share in group
                                                                                    2014           2015          2016            in % yoy                 2017     in % yoy   2018   in % yoy   sales FY2017**
      Western, Central
                                        LMC3)                                          403           427           445             +4.3                  470        +5.5      490     +4.3       approx. 4 %
      & East. Europe

                End of 2016 NA class-8 truck production was projected to decrease by around 8% and trailer to fall by 14%;
                Instead both segments picked up in 2017. For 2018 NA class-8 truck and trailer production are projected up,
                European trailer market is expected to consolidate at a high level.

18   Sources:   1) ACT N.A. Commercial Vehicle Outlook, June 2018, published monthly by Americas Commercial Transportation Research Co., LLC, Columbus, Indiana.
                2) North American Commercial Truck & Trailer Outlook, June 2018, published monthly by FTR Associates, Nashville, Indiana.
                3) LMC/Global Commercial Vehicle Forecast Q3 2017
                4) CLEAR May 2018, Western Europe and Eastern Europe
                * Figure relates to OEM business of the Americas region; not only North America
                ** Figure relates to OEM business of the EMEA/I region; not only Western & Eastern Europe
A long-term growth industry driven by mega trends: Continued increase
of global trailer axle production until 2025
Global trailer axle production
in thsd.
5,000
4,549
4,349 40
4,153 40
4,000 3,782 3,964 39
3,610 38
3,449 37
3,302 36 2,063
3,167 35
34 1,946
1,833
3,000 33 1,725
1,623
1,528
1,361 1,440
1,292
2,000 1,083
1,028 1,056
974 1,001
922 948
875 898
254 272 291
1,000 206 221 237
169 180 193
859 892 927 963 999 1,035 1,072
798 827
0
2017e 2018f 2019f 2020f 2021f 2022f 2023f 2024f 2025f
North America Latin America Europe APAC MEA
Source: Persistence Market Research, Global Trailer Axle Market, December 2017
19 Financials 20
Group sales, adj. EBIT and adj. EBIT margin (2010 to 2017)

 Sales in € mn                                                          Adj. EBIT in € mn and adj. EBIT margin in %

 1250                                                                   120
                                                              1,138.9                                                                   14%
                                                1,060.71,042.0
                                        959.7                           100                                        94.0          91.2
 1000                                                                                                                     90.4          12%
                   831.3 859.6 857.0
                                                                         80                                        8.9 % 8.7 %          10%
                                                                                                           70.7
     750                                                                                                                         8.0%
           631.0                                                                      58.0   58.2   59.3                                8%
                                                                         60
                                                                                                           7.4 %
     500                                                                              7.0 % 6.8 % 6.9 %                                 6%
                                                                         40   37.1
                                                                              5.9 %                                                     4%
     250
                                                                         20
                                                                                                                                        2%

       0                                                                  0                                                             0%
           2010    2011   2012   2013   2014     2015   2016   2017           2010    2011   2012   2013   2014    2015   2016 2017

           Solid sales and adj. EBIT increase in the past 7 years; CAGR sales +9% and adj. EBIT +14%;
           adj. EBIT margin improvement from 5.9% in 2010 to 8.0% in 2017.

21
Group sales and adjusted EBIT by quarter
Sales in € mn Adj. EBIT in € mn
400 35
14%
350 30
26.3 26.7 12%
300.3 294.9
300 287.3 25.1
273.7 277.1 274.2 25
259.9 255.8 22.7
252.6 21.6 10%
250 20.9 20.3
19.8
20 9.6% 18.5
8.7% 8.9% 8%
200 8.4% 8.7%
7.8%
7.5%
15 6.7% 6.9%
6%
150
10 4%
100
50 5 2%
0 0 0%
Q1 Q2 Q3 Q4 Q1 Q2 Q3 Q4 Q1 Q1 Q2 Q3 Q4 Q1 Q2 Q3 Q4 Q1
2016 2017 2018 2016 2017 2018
Q1 2018 top line grew 2.6 % yoy to € 294.9 mn featuring strong organic growth of 8.8% to € 312.6 mn.
Adj. EBIT margin of 6.9 % sequentially higher due to lowered add-on operating expenses in the US.
22US plant consolidation from 7 to 5 sites completed – realignment of new
production network and MAP to reduce operating expense level
Maine
Washington
North Vermont
Montana Dakota
New
Hampshire
New
Oregon Minnesota Wisconsin York Massachusetts
Michigan
South ConnecticutRhode
Dakota
Idaho
Muskegon Island
Wyoming
Holland Pennsylvania New
Jersey
Iowa
Nebraska
Illinois Cincinnati Maryland Delaware
Nevada Ohio West
Indiana
Missouri Virginia
Utah Virginia
California
Colorado Warrenton North Kentucky
Warrenton
Kansas
South North
Carolina
Tennessee
Arkansas South
Oklahoma Carolina
New
Arizona Mexico
Georgia
Alabama
Wylie Dumas Mississippi
Texas
Louisiana
Florida
SAF-HOLLAND production locations
Transition of production to plant
Sequential improvement of the additional operating expenses required in the context of aligning the new production network and
start-up of production at the enlarged plants for expedited freight cost, customer debits and production inefficiencies from € 6.3 mn
(Q4 2017) to € 3.9 mn (Q1 2018); Industry supply chain issues and soaring steel prices (+ € 2.0 mn in Q1 2018) also impacted.
23Share of group sales by channel and region in 2017
8.6%
(py: 6.8%)
24.4%
53.7%
(py: 25.9%)
(py: 54.6%)
37.7%
(py: 38.6%)
75.6%
(py: 74.1%)
OEM business Aftermarket business EMEA/I Americas APAC/China
Share of OEM business increases due to well-above trend line sales growth; Well-balanced geographic
exposure in the EMEA/I and Americas regions with clear growth strategy until 2020 in APAC/China and
EMEA. In 2017 highest growth rate percentage-wise in APAC/China.
24Key financial figures: Net income and EPS undiluted (2010 to 2017)
Net income in € mn EPS in €
60 1.40
51.7
1.20 1.14
50 43.5 0.98
41.0 0.95
1.00
40
32.7 0.80 0.73 0.72
28.4* 0.68*
30 26.6
24.4 0.60 0.54
20 0.40
10 0.20
0.18
7.4 0.00
0
0 2010 2011 2012 2013 2014 2015 2016 2017
2010 2011 2012 2013 2014 2015 2016 2017 -0.20
-10
-0.40
-8.3 -0.40
-20 -0.60
-0.60
Solid net income development from 2010 to 2017; EPS influenced by higher number of shares.
25 * adjusted for one-time effects from the early redemption of bank loans of € 9.3 mn and swaps of € 3.1 mn as well as unrealized foreign exchange
losses on foreign currency loans in an amount of € 1.2 mn.Inventories and net working capital (NWC)
Inventories in € mn and days of inventories Summary
180 75 Inventories due to strong organic sales growth and
151.8
160 145.7 138.9 139.3
133.7
seasonal patterns increased to € 151.8 mn until the
127.2 123.7 124.6 131.0 65
140 end of Q1 2018 (Dec. 31, 2017: € 133.7 mn)
120
100 58 57
55 Compared to March 31, 2017 (€ 145.7 mn), inventories
55 56
80 51
54
51
54 53 recorded only a relatively small increase
45
60 As a result, days of inventory outstanding came in one
40 35 day less at 56 days (March 31, 2017: 57 days)
20
0 25
Q1 Q2 Q3 Q4 Q1 Q2 Q3 Q4 Q1
2016 2017 2018
Net working capital in € mn and as % of sales
180 20% Summary
158.3
160 144.8 142.8 142.7 NWC amounted to € 158.3 mn in absolute terms
140 125.2 120.6 15% Strong sales increase and seasonal effects contribu-
120 110.3
ted to the pick-up in net working capital driven by
100 12.6% 12.9% 13.4%
12.2%
10.3%
11.9%
11.00%
10% trade receivables, which increased by € 42.0 mn to
80
60
€ 177.7 mn when compared to Dec. 31, 2017
40 5% Besides regional mix had an elevating effect with
20 regard to receivables
0 0%
Q3 Q4 Q1 Q2 Q3 Q4 Q1
Thus, as of March 31, 2018, NWC ratio amounted to
13.4%, slightly higher than Q1 2017 (12.6%)
2017 2018
26Free cash flow by quarter profile
in € mn
40
29.3
30 26.8
19.4
20
10.9
10 13.0 7.5
6.1
0
-10 Q1 Q2 Q3 Q4 Q1 Q2 Q3 Q4 Q1
-15.6 -29.5
-20
2016 2017 2018
-30
Seasonally Q1 free cash flow (net cash flow from operating activities less investments in property, plant and
equipment and intangible assets) is weaker and came in at € -29.5 mn in 2018 (py: € -15.6 mn) caused by
growth-related increase in NWC, stepped up capex, lower result before tax and higher income taxes paid.
27Net debt at € 142.6 mn - Equity ratio still reflecting strong cash position
Net debt Equity ratio
in € mn
Σ 105.5* Σ 142.6*
500
400
300 30.2%
29.4%
200 442.6 444.7
100
0
-100
-337.1 -302.2
-200
-300
-400
Dec 31, 2017 Mar 31, 2018 Dec 31, 2017 Mar 31, 2018
Cash Debt
* Net debt including cash and cash equivalents and other short-term investments sequentially increased to
€ 142.6 mn (Dec. 31,2017: € 105.5 mn); Cash and cash equivalents and other short-term investments
amounted to € 302.2 mn (Dec. 31, 2017: € 337.1 mn). The equity ratio as of March 31, 2018 was 29.4%.
28 Company outlook 29
Outlook: Financial targets 2018 and mid-term planning 2020

                                                                                   FY 2018*                                                  Strategy 2020

                                                                   Organic increase of 5 to 7%                                          Organic: € 1,250 mn
                                                                  assuming stable FX rates and
                                                                unchanged scope of consolidation
                           Sales
                                                                 + contribution from V.Orlandi and                            + M&A: Coops, JVs, acquisitions
                                                                    York takeovers (~ € 60 mn)
                                                                                                                                          Total: € 1,500 mn
                                                                         + potential further M&A

                  Adj. EBIT margin                                                 7 to 8.0%                                                       ≥ 8%

            Net working capital ratio                                                   12%                                                          12%

                                                                           € 38 to 40 mn
                                                                                                                                     € 26 mn to € 28 mn p.a.
                         CAPEX                                    incl. high single-digit Euro mn
                                                                amount related to new China plant

30 * Projections assume that there is no significant deterioration of the political, economic or industry-specific environment; organic projections do not
   include potential sales and earnings contributions from acquisitions or JVs
SMART STEEL provides for add-on business
opportunities in a digitized transport world
1 2 3 4 5
Upgrade to Digitize New business
Integrate &
Mechanics Electro- Information & models & Digital
Connect
mechanics Data solutions
Predictive Maintenance
RECOLUBE SAFH Connect App Big Data Analytics
SAF-HOLLAND combines mechanics with sensors and electronics.
The Company‘s integration and data interpretation know-how enables smart/autonomous drive systems.
31Green SAF-HOLLAND – We acknowledge sustainability!
Our own sustainable business model in transport and
SAF-HOLLAND acting as a sustainability enabler
logistics
SAF-HOLLAND’s innovative sustainable
Think Ahead program: Environmentally pro-
active strategies and community support
solutions enable customers to reach their
sustainability targets
Appropriate handling of resources
SAF-HOLLAND engineering is a trendsetter in Group-wide CSR reporting process
light-weight products established, complying with GRI Standards
First stand-alone Sustainability Report published
Legislation and tightened safety, weight and
in April 2018
emissions resductions standards are driving
Winner of the 2017 European Transport Award for
Sustainability, category “ Best Overall Entre-
China: “Overload ban” preneurial Concept"
Hazardous good transporters: Disc brake and
air suspension required by new legislation
32 Takeover V.Orlandi S.p.A. 33
Takeover of V.Orlandi S.p.A.: The specialty fifth-wheel and coupling
specialist
Headquarter in Flero (Brescia), Italy
Supplier of couplings for trucks and
specialty fifth-wheels
Specialty business with couplings and
drawbar eyes for trailers and specialized
commercial vehicles systems
Serves the industrial, agricultural, forestry
and mining segments
Two production sites in Northern Italy,
currently employing around 60 people
Well-established international sales
network for OEM and Aftermarket
SAF-HOLLAND is strengthening its position as the number 2 in fifth-wheels and couplings in the European
market by taking over the number 3 player.
34V.Orlandi S.p.A.: Fully complementary product range
AGRICULTURAL AUTOMOTIVE
DUAL INDUSTRY USE MINING
SAF-HOLLAND is complementing and strengthening its position in coupling systems and specialty fifth
wheels for trucks, trailers, semi-trailers and agricultural vehicles. Significant cross-selling potential of
Orlandi products to be realized within the worldwide set-up of the SAF-HOLLAND Group network.
35V. Orlandi S.p.A.: Sales turnover by region and business unit in 2017
19%
28%
41%
81%
31%
Overseas Europe Italy Automotive Agricultural
Almost two thirds from overseas sales originate from the APAC region besides Russia, South America, the
Middle East and Africa.
36Impressions: A very specialized product range 37
Terms and key financials
SAF-HOLLAND acquires 70% stake in V.Orlandi S.p.A.
Call option for SAF-HOLLAND for the remainder
Expected full year sales: approx. € 22 million
Expected annual growth rate: 3 to 5%
Margin accretive: Adj. EBIT margin in the mid teens
Pro rata tempore inclusion in the SAF-HOLLAND Group scope of consolidation
Closing of transaction expected no later than in Q2 2018
After the takeover, V.Orlandi S.p.A. will continue to operate under its strong, well-established brand. As part
of the SAF-HOLLAND Group, V.Orlandi S.p.A. will benefit from additional growth prospects and attractive
cross-selling opportunities worldwide.
38 Takeover York Transport Equipment
(Asia) Pte. Ltd.
39York Transport Equipment: Company Overview and Highlights
York is engaged in manufacturing and
distribution of trailer axles, trailer
suspensions and trailer components
York employs 220 staff and 90 contract
workers
Manufacturing facilities in India and China;
assembly lines in Singapore and Australia
Market leader in Asia, Africa and Australia
Strong service and spare parts network in
India
Research and development centers in
India, Australia and Singapore
SAF-HOLLAND will become one of the market leaders in trailer axle and suspension systems in India, one of
the fastest growing transportation markets in the world with an excellent set-up in the APAC/China region.
40York Transport Equipment: Core products and market shares
Axles Mechanical Air Fifth Landing
suspensions suspensions wheels gears
Acquisition of York rapidly expands SAF-HOLLAND’s position in the fast-growing Indian and APAC/China
transportation markets.
41York Transport Equipment: Geographic footprint
Next to India, York also has
significant operations in
other fast-growing
Southeast Asian markets,
such as Thailand, Indonesia
and Vietnam besides
Australia.
Turkey
York Group has a strong
China service and spare parts
network in India with more
Thailand than two hundred service
Middle India
East Singapore points.
This network will effectively
strengthen the aftermarket
Manufacturing Indonesia
business of the SAF-
HOLLAND Group in the
Warehousing region.
Sales Representative
South Africa
Australia
York has a wide regional sales and a strong service and spare parts network which perfectly fits into SAF-
HOLLAND’s network. York will also strengthen the position of SAF-HOLLAND in the Middle East and Africa.
42Estimated significant growth in APAC fits with Strategy 2020
Global Trailer Market Attractiveness Strategy 2020
The world‘s growing population and increase
in purchasing power are the key drivers for the
expected increase in consumption.
Market growth is mainly seen in the emerging
economies, particularly in the Asia Pacific,
Middle Eastern and Africa markets.
The objective of the Strategy 2020 is to
expand SAF-HOLLAND‘s presence in the
emerging markets by entering new regional
markets outside of the core markets.
A further objective is the expansion of the
aftermarket business.
43 Appendix 44
Strong financial profile supporting further growth & dividend payments
Strong financial profile*
Revolving Credit lines Convertible Bond Promissory note (SSD) Non-current loan
€ 155.5 mn € 100.2 mn € 200 mn € 50 mn
due 10/2021 with option due 09/2020 € 140 mn due in 11/2020 € due 06/2026
of renewal until 10/2022 17 mn due in 11/2022
€ 43 mn due in 11/2025
Diversified financing structure
Access to institutional and private investors with
reduced dependency from banks
High flexibility with increased financial headroom and
optimized financing cost
Financing of “Strategy 2020” targets secured
Dividend policy
Dividend payment of € 0.45 per share (py: € 0.44) for FY
Consistent dividend policy:
2017; € 20.4 mn (py: € 20.0 mn) distribution in total In general distribution of 40 to 50% of net income
representing a 49% (py: 46%) share of net income
45 * as of May, 2018Disclaimer
Not for general release, publication or distribution in the United States, Australia, Canada or Japan.
By attending this presentation you agree to be bound by the following limitations:
This presentation has been prepared by SAF-HOLLAND S.A. (“SAF-HOLLAND”) and comprises written materials concerning SAF-HOLLAND. It is furnished to you solely
for your information and may not be reproduced or redistributed, in whole or in part, to any other person. It contains summary information only and does not purport to be
comprehensive and is not intended to be (and should not be used as) the sole basis of any analysis or other evaluation. No representation or warranty, express or implied,
is made as to, and no reliance should be placed on, the fairness, accuracy, completeness or correctness of any information, including projections, estimates, targets and
opinions, contained herein, and no liability whatsoever is accepted as to any errors, omissions or misstatements contained herein, and, accordingly, neither SAF-HOLLAND
nor any of its directors, officers, employees or advisors nor any other person shall have any responsibility or liability whatsoever (for negligence or otherwise) arising,
directly or indirectly, from the use of this presentation, or its contents or otherwise in connection with this presentation.
This presentation contains certain statements related to our future business and financial performance and future events or developments involving SAF-HOLLAND and/or
the industry in which SAF-HOLLAND operates that may constitute forward-looking statements. These statements may be identified by words such as “believes,” “expects,”
“predicts,” “intends,” “projects,” “plans,” “estimates,” “aims,” “foresees,” “anticipates,” “targets,” and similar expressions. Forward-looking statements are not historical facts,
but solely opinions, views and forecasts which are based on current expectations and certain assumptions of SAF-HOLLAND’s management or cited from third party
sources which are uncertain and subject to risks. Actual events may differ significantly from the anticipated developments due to a number of factors, including without
limitation, changes in general economic conditions, changes affecting the fair values of the assets held by SAF-HOLLAND and its subsidiaries, changes affecting interest
rate levels, changes in competition levels, changes in laws and regulations, environmental damages, the potential impact of legal proceedings and actions and the Group’s
ability to achieve operational synergies from past or future acquisitions. Should any of these risks or uncertainties materialize, or should underlying expectations not occur
or assumptions prove to be incorrect, actual results, performance or achievements of SAF-HOLLAND may (negatively or positively) vary materially from those described,
explicitly or implicitly, in the relevant forward-looking statement.
The information contained in this presentation, including any forward-looking statements expressed herein, speaks only as of the date hereof and reflects current legislation
and the business and financial affairs of the SAF-HOLLAND which are subject to change and audit. Neither the delivery of this presentation nor any further discussions of
SAF-HOLLAND with any of the recipients thereof shall, under any circumstances, create any implication that there has been no change in the affairs of SAF-HOLLAND
since such date. Consequently, SAF-HOLLAND neither accepts any responsibility for the future accuracy of the information contained in this presentation, including any
forward-looking statements expressed herein, nor assumes any obligation, to update or revise this information to reflect subsequent events or developments which differ
from those anticipated.
This presentation is not directed to, or intended for distribution to or use by, any person or entity that is a citizen or resident or located in any state, country or other
jurisdiction where such distribution, publication, availability or use would be contrary to law or regulation or which would require any registration or licensing within such
jurisdiction. This presentation is for information purposes only and does neither constitute an offer to sell securities, nor any recommendation of, or solicitation of an offer to
buy, any securities of SAF-HOLLAND in the United States, Germany or any other jurisdiction. In the United States, any securities may not be offered or sold absent
registration or an exemption from registration under the U.S. Securities Act of 1933.
46Investor Relations
SAF-HOLLAND GmbH
Stephan Haas
Hauptstraße 26
63856 Bessenbach
Phone +49 6095 301-617
Telefax +49 6095 301-102
Mobile +49 170 306 64 97
Stephan.Haas@safholland.de
www.safholland.com
47You can also read