Outlook for Japanese Economy & Stock Market - Monthly comments & views by Sumitomo Mitsui DS Asset Management (SMDAM)
←
→
Page content transcription
If your browser does not render page correctly, please read the page content below

Outlook for
Japanese Economy & Stock Market

Monthly comments & views by
Sumitomo Mitsui DS Asset Management (SMDAM)

-February 2020-
Executive summary
Japanese Economy
Japanese real GDP growth is expected to have declined by 4% in Oct-Dec 2019 quarter (QoQ %, annualized) due mainly
to negative effects from consumption tax hike in October 2019. This decline will be short-lived. Japanese government is
going to make large fiscal spending measures with the announced size of JPY 26 trillion, among which JPY 9.4 trillion is
spent from government budget. The largest part of the package is for infrastructure spending in order for preventing &
reducing natural disasters. Positive effects on GDP will become visible from Apr-Jun quarter this year.(Page 8)
• SMDAM is monitoring trade activity momentum of Japan, which is composed of various related statistics supposed to work as leading
indicators. This momentum shows that bottoming pattern is getting clear. (Page 4)
• Total wage payment in Japan keeps growing due mainly to increasing number of employees even in such a tight labor market.
Number of female workers are further increasing and also elder people are extending retirement age. Strong demand for workers is
encouraging people, who once gave up finding jobs, to start seeking again. (Page 10)
Japanese Stock Market
Downward earnings forecast revision for Japanese stocks has ended and economic recovery in 2020 is getting more
certain by large fiscal spending plan. Japanese stock markets are expected to move in a solid undertone weaving in
expected earnings recovery in FY2020. A matter of concern is an epidemic of a new pneumonia causing virus spreading
in China and possibly spilling out globally, which could hamper the consumer activities and also bullish sentiment of the
global stock market in the short term. (Page 18)
• PE ratio (PER) for TOPIX rose slightly over 14 times based on 12m forward EPS forecast, which assumes about 8% EPS growth in
coming 12 months.15 times PER has been the upside of the historical core range since PM Abe started expansive policy mix in 2013,
and 16 times PER was the upper limit for extreme bull run such as observed in 2015. (Page 24)
Notes: Macro and market views are as of 27h Jan. 2020, and subject to updates thereafter without notice.
1
Outlook for
Japanese Economy

                   2
Outlook for the global economy
SMDAM maintained GDP growth forecast for 2020 and 2021 from the previous month. Important events such as US-
China trade negotiation and also global economy have been mostly moving in line with SMDAM’s main scenario.
Global economic growth is forecast to recover from 2020 supported by such factors as monetary easing, fiscal
expansion and cyclical recovery in manufacturing industries, especially IT related ones.
Global GDP forecast and contribution by
(YoY %)
countries & regions (Main scenario)
Notes: Data is from 2008 to 2021 and forecasts by SMDAM. (Year)
(Source) IMF, National statistics of each country, compiled by SMDAM.
3Japanese export is expected to make mild recovery
SMDAM is monitoring trade activity momentum of Japan, which is composed of various related statistics supposed to
work as leading indicators. This momentum shows that bottoming pattern is getting clear.
Total export volume in December showed recovery after declining for two consecutive months.
Total export volume
(seasonally adjusted, yen billion)
(yen billion)
7400
7200
7000
6800
6600
6400
6200
6000
5800
5600
5400
Jan-10 Jan-11 Jan-12 Jan-13 Jan-14 Jan-15 Jan-16 Jan-17 Jan-18 Jan-19
(Month/Year)
Note: Data is from Jan. 2010 to Dec. 2019.
(Source) Ministry of Finance, Bank of Japan, compiled by SMDAM.
4Global quantitative easing is progressing
FRB is expanding its balance sheet as a reserve management in order for containing volatility of FF rates, which has
worked positively for the global financial markets. This expansion is expected to end in 2020.
BOJ will keep current easing pace. Large fiscal stimulus measures in Japan amounting to JPY 26 trillion will be able to
support economic growth in Japan even without extra monetary easing.
(USD bil.) YoY change (%) of assets in central banks' B/S
Forecast
(Year)
Note: Data is from Jan 2012 to Nov 2019 and SMDAM's forecasts to Dec 2020.
Assumes that ECB restarts monthly EUR 20 bil. bond purchases from Nov. 2019 and increase the purchasing to EUR 30 bil. from
Mar. 2020. FED expanse B/S as reserve management. BOJ maintains current purchasing pace.
(Source) Bloomberg, each central bank, compiled by SMDAM.
5Global capital has been flowing into US fixed income markets
In 2019, global economy significantly slowed down and FRB and ECB cut short term interest rates. Capital flowed out
from equities and into fixed income. US has almost solely attracted this huge capital inflow, for which comparatively high
real interest rate was a driver in the background, which also supported strength of US dollars.
Outflow from equity stopped lately and we need to watch if this turn-around of capital flow into equity continues.
(%) Comparison of 10Y real interest rates Global cumulative capital flow for Unit trust / Investment trust funds
(USD bil.)
(Year) (Year)
Note: Data is daily from 1st Jan 2013 to 22nd Jan 2020. Note: Data is weekly from 4th Jan 2017 to 15th Jan 2020.
Real interest rate = government bond yield – inflation rate implied by inflation linked (Source) EPFR, compiled by SMDAM Economic Research Department
government bond.
(Source) Bloomberg
6SMDAM Japanese economic outlook for FY19-21
SMDAM maintained GDP forecast for FY2019, FY2020 and FY 2021 from the previous month.
Japanese economy is forecast to keep solid growth going into FY2020, for which new large fiscal spending makes
significant contribution.
( YoY %)
FY16 FY17 FY18 FY19E FY20E FY21E
Real GDP growth 0.9% 1.9% 0.3% 0.9% 0.6% 0.8%
Private Consumption Expenditure 0.0% 1.1% 0.1% 0.3% 0.3% 0.7%
Private Housing Investment 6.3% -1.4% -4.9% 1.7% -1.6% 0.0%
Private Capital Investment -0.4% 4.3% 1.7% 2.0% 1.0% 1.3%
Public Consumption Expenditure 0.7% 0.3% 0.9% 2.3% 0.8% 1.0%
Public Capital Investment 0.6% 0.5% 0.6% 3.0% 3.7% 2.5%
Net Exports (contrib. to GDP growth) 0.8% 0.4% -0.1% -0.3% -0.0% -0.1%
Exports 3.6% 6.5% 1.6% -1.6% 0.4% 1.0%
Imports -0.9% 3.9% 2.2% -0.2% 0.5% 1.8%
Nominal GDP 0.8% 2.0% 0.1% 1.5% 1.2% 1.2%
GDP Deflator -0.2% 0.1% -0.2% 0.6% 0.6% 0.4%
Industrial Production 0.8% 2.9% 0.3% -3.0% 0.3% 1.9%
CPI (excl. fresh food) -0.2% 0.7% 0.8% 0.5% 0.5% 0.6%
Note: E=SMDAM forecasts. SMDAM views are as of 27th Jan. 2020 and subject to updates thereafter without notice (%, YoY except Net Exports)
(Source) Cabinet Office, Bank of Japan, Ministry of Economy, Trade and Industry, Ministry of Internal Affairs and Communications, SMDAM forecasts
7New fiscal stimulus measures to support economic growth in Japan
Japanese real GDP growth is expected to have declined by 4% in Oct-Dec 2020 quarter (QoQ %, annualized) due
mainly to negative effects from consumption tax hike in October 2019. This decline will be short-lived.
Japanese government is going to make large fiscal spending measures with the announced size of JPY 26 trillion,
among which JPY 9.4 trillion is spent from government budget. The largest part of the package is for infrastructure
spending in order for preventing & reducing natural disasters. Positive effects on GDP will become visible from Apr-Jun
quarter this year.
Note: E=SMDAM forecasts. SMDAM views are as of 27th Jan. 2020 and subject to updates thereafter without notice
(Source) Cabinet Office, Bank of Japan, Ministry of Economy, Trade and Industry, Ministry of Internal Affairs and Communications, SMDAM forecasts
8Daily sales data shows milder impact of this time’s tax hike
Nikkei CPINOW provides daily sales data derived from POS system of retailers nationwide in Japan.
This time, rush demand purchases happened only just before the tax hike, and contraction of sales after the tax hike
has been milder this time compared to the previous hike in 2014. New year sales from 2nd January 2020 seems to have
made a good start.
Not included in this POS data are some big ticket items such as auto mobiles, which has been showing larger negative
impact.
9Total wage payment keeps growing due mainly to expanding workforce
Total wage payment in Japan keeps growing due mainly to increasing number of employees even in such a tight labor
market. Number of female workers are further increasing and also elder people are extending retirement age. Strong
demand for workers is encouraging people, who once gave up finding jobs, to start seeking again.
Despite a marginal wage increase per household, feeling of job security is going to support consumers’ sentiment.
(%) Real wage payment (YoY %)
5
4
3
2
1
0
-1
-2
Inflation
-3 Number of employees
Nominal wage
-4
Real wage payment
-5
(Month/Year)
Note: Data is from Jan. 2013 to Nov. 2019.
(Source) Ministry of Health, Labour and Welfare
10Appetite for CAPEX stays strong despite deteriorating business sentiment
BOJ’s “TANKAN” business survey in December showed deterioration in business sentiment of manufacturing and small
enterprises meanwhile sentiment of non-manufacturing enterprises showed resilience.
FY2019 capital expenditure plan for software stayed at robust 10.1% YoY increase as the right end chart shows.
Even excluding software, FY 2019 capital expenditure plan showed further 3.3% increase from the robust CAPEX in
FY2018 as the middle chart shows.
CAPEX plan, excluding software and R&D CAPEX plan for software
(YoY %) (all size, all industries) (all size, all industries)
(YoY %)
Note: The chart shows history of the CAPEX plan for each fiscal year. Mar estimate is at each fiscal year end and Jun
actual results are surveyed after the end of each fiscal year.
(Source) Bank of Japan
11Japanese companies have reasonably large buffer to stay profitable
Japanese companies have reasonably large buffer to stay profitable despite recent contraction in revenue.
Breakeven point is quite low in more than 30 years of history exhibited. Companies are still profitable even if sales
decline by 40%. Also, labor share has been kept low despite robust revenue growth.
Labor cost is mildly increasing due to labor shortage. From labor’s side, household income could be sustained even if
Japan experiences mild recession, which will be supportive for private consumption.
Corporate Financial Statement Statistics (Sep 2019, all size, all industries, seasonally adjusted)
(trillion yen) Recurring profit (trillion yen) Labor cost
(Year) (Year)
(%)
(%)
Breakeven sales (%) Labor’s share
Note: Data is
quarterly from 1Q
1985 to 3Q 2019.
(Source)
(Year) (Year) Ministry of Finance
12Presidential election year will bring in various motives for investors
Diplomatic uncertainties receded as US-China made a partial deal and Brexit became certain.
US presidential election is going to be the biggest scheduled event for the global financial markets.
Upcoming key events
Month Region/Country Events Notes
2020 28-29 FOMC meeting
US
US President Impeachment Trial begins
UK 31 UK is going to exit EU. How fast trade treaties can be made?
January US-Japan US-Japan Trade Agreement becomes effective
JPY 26 trillion fiscal stimulus package to
Ordinary National Diet Session begins
Japan go through
20-21 BOJ Monetary Policy Committee Meeting & Perspective Report
US Presidential Primary Election Campaigns to begin
February US US President's Budget Plan
FRB chairman's testimony at US congress
Japan 18-19 BOJ Monetary Policy Committee Meeting
March
China 5 National People's Congress
Work style reform legislations. (overtime limit for mid-small businesses,
same job same wage principle for large businesses)
April Japan
Wavering education costs, such as for universities, for low income
households.
End of the government led incentive program for cash-less payments.
June Japan
15-16 BOJ Monetary Policy Committee Meeting
Jul-Aug Japan Tokyo Olympic Games
November US US presidential election
(Source) Various publications, assembled by SMDAM
13Japan is still competitive in innovation, but has some weaknesses
According to World Economic Forum, Japan was ranked 8th in innovation among 137 economies, which is still
competitive, however on a moderate declining trend. As a strength, R&D in Japan is largely led by companies and
producing the largest number of patents in this ranking.
On the weak side, however, this company led R&D tends to be “progressive” rather than “innovative” and often lacks in
global collaboration. Government initiative on innovation is stronger in economies such as US, Germany Singapore and
China.
Facing with strong global competition in developing key technologies such as AI or Autonomous Driving Technology,
Japanese companies are changing approach to more open and more collaborating with global partners.
Global Competitiveness Ranking of Innovation among 137 economies
Switzerland U.S. Israel Finland Germany Netherlands Sweden Japan Singapore Denmark China
Innovation total 1st 2nd 3rd 4th 5th 6th 7th 8th 9th 10th 28th
Capacity for
a) 1 2 3 7 5 6 4 21 23 16 44
innovation
Quality of scientific
b) 1 5 3 8 11 4 13 14 12 16 36
research institutions
Company spending
c) 1 2 3 7 4 8 6 5 17 16 21
on R&D
University-industry
d) 1 2 3 4 7 5 10 23 8 21 28
collaboration in R&D
Gov't procurement of
e) advanced technology 37 2 11 20 6 19 17 23 5 39 10
products
Availability of
f) scientists and 12 2 6 1 11 19 20 8 9 44 29
engineers
g) PCT patents 3 10 6 4 7 9 2 1 12 8 30
Note: All numbers are rankings among 137 economies. Top 10 rankings are highlighted in green. Japan's relative weakness is highlighted in orange.
(Source): World Economic Forum, The Global Competitiveness Report 2017–2018
14Japanese society is changing slowly but steadily
It may look slow or even stagnant from outside, but Japanese society is making necessary reforms.
Many problems are stemming from deep rooted Japanese culture & social practice, which became apparent in the face
of “aging population” and “innovative disruption”.
Change of the deep rooted culture & practice should take time, however, it is making progress, and will eventually put
Japan in an advantage over other advanced economies, which also have aging population lagging Japan.
Hurdles for
Aging population
achieving business reform
Lifetime employment
Forcing Japanese Seniority based compensation
reform companies Rising social insurance costs
Inefficient working practice
Insufficient entrepreneurship
Innovative Shortage of new technology
disruption professionals, etc.
15Japanese society is changing slowly but steadily
Examples of long-term social challenges and progressing solutions
Source of problems Challenges Solutions
Unconventional "macro-slide" has been implemented to curb
pension payment increase referring to "low birth rate" and so on.
a) Pension system reform
Encourage people to continue working into 70's.
Encourage people to shift saving to investments. (NISA*, DC)
1. Aging population Capital investment for enhancing labor efficiency. (FA, AI, IoT,
autonomous driving car, renovating software, etc. )
b) Labor shortage Allowing more foreign workers.
Encourage people to delay retirement.
Support female workers. (increase nursery, etc.)
Pension system reform.
2. Weak Gradual adjustment of seniority based wage system to shift
c) Clearing peoples worry for the future
consumption compensation from elderly to younger workers.
life
propensity Increase of new generation companies.
Increase of young people working with non-seniority wage system.
Elder people to retire or continue working at lower wage.
3. Rigid Gradual adjustment of seniority based wage system.
d) Encouraging business structure
employment More fluid labor market enabling companies to make restructuring.
reform
practice Young people are not expecting lifetime employments and focusing
on building own career (already progressing).
4. Inefficient
e) Enhancing labor efficiency Work style reform to progress.
working practice
5. Insufficient
Increase of successful new generation companies.
entrepreneurship
f) Enhancing “challenge spirit” Increase of young people with skills of new technologies.
6. Shortage of new
g) Education reform Young and talented people choose new generation companies
technology
rather than old & large firms (already progressing).
professionals
Note: *NISA is “Nippon Individual Savings Account”. (Source) SMDAM
16Outlook for
Japanese Stock Market
17Japanese stock markets are expected to try upside
SMDAM short-term view
Downward earnings forecast revision for Japanese stocks has ended and economic recovery in 2020 is
getting more certain by large fiscal spending plan. Japanese stock markets are expected to move in a solid
undertone weaving in expected earnings recovery in FY2020. A matter of concern is an epidemic of a new
pneumonia causing virus spreading in China and possibly spilling out globally, which could hamper the
consumer activities and also bullish sentiment of the global stock market in the short term.
Longer-term outlook (6-months and beyond)
US presidential election is expected to keep supplying motives for investors as well as volatility in the global
financial markets. Inflation is expected to stay at extremely low level and continuing easy monetary policy will
support the financial markets. Positive sentiment is likely to continue for the Japanese stock market in the 1H
of 2020. JPY 26 trillion economic stimulus package and robust domestic capital investment are going to
support the Japanese economy and corporate earnings even if economic recovery in China remains mild.
Cautiousness could be back around summer waiting for the result of the US presidential election.
Note: SMDAM’s projection is as of 27th Jan. 2020 and subject to updates without notice.
18Base scenario & Upside / Downside risks for our forecasts
Our Base Scenario is assuming the following views:
• Severe tensions between US and China go on, however, US is going to avoid making a fatal blow to the
global economy.
• US economy keeps growing despite possible mild slowdown.
• Consumption tax hike in Japan in October will make a limited impact on private consumption.
• Japanese yen does not get extremely stronger beyond 100 yen against US$.
• Tension in the East Asia or Middle East does not get out of control.
• Central banks continue easing monetary policies.
Upside Risks include:
• US and China make significant concessions in the trade negotiations.
• Stronger-than-expected global growth.
• Denuclearization in Korean peninsula makes a visible progress.
• Japanese economy gets stronger than expected boosted by large fiscal spending.
Downside Risks include:
• US economy significantly slows down and puts global economy into a recession.
• Chinese economy falls into a significant slowdown spreading negative shock globally.
• Trade negotiation between US and China completely breaks up igniting a decades of power struggle.
• Seriously escalating geo-political tensions in Middle East & East Asia.
• Political turmoil flares up in US running up to US presidential election in 2020.
• Populism gains in Europe further destabilizing EU.
• Japanese Consumption Tax Hike in October makes unexpectedly severe impact on private consumption.
Note: SMDAM’s projection is as of 27th Jan. 2020 and subject to updates without notice.
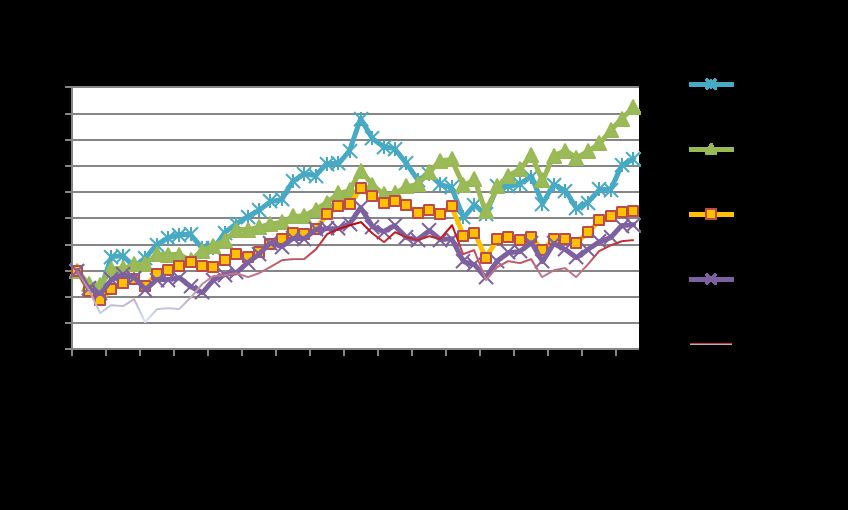
19Rebounds in global stock market continue
US stock market continues to rally recording new historical highs.
Epidemic of a new virus causing pneumonia is spreading from China, and pulled back stock prices mainly in Asia
and Japan lately.
20Relative stock valuation remains attractive for the Japanese stocks
ROE gap between Japan and Europe and also between Asia got narrower in the last five years, which is exhibited on the
left chart.
However, this improvement in ROE has not been reflected on PBR (Price to Book Ratio), which stays at low level
compared to other markets, which is shown in the middle chart.
PE ratio for Japan rose to a level just below Europe, and Asia is now the lowest, which has been a normal picture in the
recent history.
21Profit is forecast to come back to a solid growth in FY2020
Recurring profits for 227 companies in SMDAM’s research coverage are forecast to contract by -4.6% in the current
FY2019 (ending in March 2020) and then come back to a solid grow of 6.1% in FY2020.
Manufacturing industries are forecast to show robust profit recovery in FY2020 growing by 13.9%.
Non-manufacturing industries are forecast to show negative -3.1% growth in FY2020. However, this is due to large
negative effect coming from telecommunication sector, for which investment portfolio of a company makes a large swing
in profits. When excluding telecommunication sector, non-manufacturing industries are forecast to show mild 2% profit
growth in FY2020.
SMDAM Corporate Earnings forecasts (227 Companies research coverage excl. financials)
Fiscal year FY 2017 FY 2018 FY 2019E FY 2020E
Date of forecast Actual Actual as of 6th Dec. 2019 as of 6th Dec. 2019
Sales (YoY %) 9.1% 7.8% 0.9% 1.6%
Operating Profits (YoY %) 16.6% 5.3% -7.0% 8.4%
Recurring Profits (YoY %) 18.5% 3.9% -4.6% 6.1%
Net Profits (YoY %) 36.1% 3.0% -11.7% 7.6%
Recurring profits (YoY %)
Manufacturing 132 companies 23.0% -2.3% -8.9% 13.9%
Non-manufacturing 95 companies 12.1% 13.6% 1.1% -3.1%
Note: Key assumptions for FY2019 & 20 are Yen/US$ 109 and 110 respectively, Yen/EUR stays at 120.
(Source) SMDAM Corporate Research Department 1, Toyo Keizai
22Downward earnings revision is coming to an end for Japanese stocks
Downward earnings forecast revision finally seems to have ended for Japanese stocks as right hand chart shows.
It’s a little technical, however, 12m forward EPS growth forecast increased to 8.2% from 6.2% in the previous month. 12m
forward EPS forecast was maintained despite declining historical EPS.
23PE Ratio for TOPIX entered into upper side of the historical range
PE ratio (PER) for TOPIX rose slightly over 14 times based on 12m forward EPS forecast, which assumes
about 8% EPS growth in coming 12 months.
15 times PER has been the upside of the historical core range since PM Abe started expansive policy mix in
2013, and 16 times PER was the upper limit for extreme bull run such as observed in 2015.
PER lines
24Foreign investors turned to purchasing Japanese equities
Since 2016, foreign investors were net sellers. Foreign investors bought Japanese equities aggressively between 2013
and 2014, however, they have sold about 75% of the cumulative net purchases afterwards. They started to buyback
Japanese equities from late 2019 on the back of attractive stock valuation and improving outlook for the global economy.
Japanese companies have been continuously buying back own shares as the second largest buyer only next to BOJ.
Individuals have been the largest seller of Japanese equities, however, purchasing via IPO is not included in this
statistics and actual selling by individuals gets smaller when IPO is included.
25Advancing Corporate Governance Code and Stewardship Code
Stewardship Code (SC) was set in February 2014. Investors are taking more pro-active approach in talking to the
companies and exercising proxy voting rights. Financial Services Agency discloses the name of institutional investors,
which publicly accepted SC.
After inception of Corporate Governance Code (CGC) in June 2015, pressure has been increasing on companies to
improve its governance, efficiency and shareholder returns.
These two codes have been progressively reviewed and enhanced, and making visible impact on the corporate behavior
and investors’ attitudes as shareholders.
Nikkei Newspaper reported lately that SC would be reinforced in April 2020 requiring investors to evaluate ESG factors.
In the most recent amendment of CGC, companies are required to explain the rationale of “cross holdings” or “strategic
holdings” of other companies’ shares, which implicitly provide protection against takeovers and hostile shareholder
actions, and is often negative for achieving shareholder value.
Total number of institutional investors, which publicly
declared acceptance of the stewardship code
Trust banks 6
Investment management companies 177
Insurance companies 23
Pension funds 35
Others (include proxy voting advising companies) 7
Total 248
Note: As of 8th May 2019.
(Source) Financial Services Agency
26Business restructuring is progressing for Japanese companies
Japanese companies are getting more and more willing to make positive business restructuring.
Number of M&A deals between Japanese companies (IN-IN) rose from 2,174 in 2006 to 2,814 in 2018 increasing by 30%,
which is an evidence that business restructuring is progressing in Japan.
Number of the deals of Japanese companies acquiring overseas businesses also rose from 421 in 2006 to 777 in 2018,
increasing by 84%.
27Behavior of Japanese companies are making positive changes
Share buyback is one of the powerful tools for Japanese companies in disposing of accumulated liquidity in the B/S and
enhancing EPS growth as well as ROE.
In FY2018 (from April 2018 to March 2019), total upper limit of share buybacks, proposed as board of directors’
resolutions, increased sharply and also actual share buybacks increased to renew a historical record.
Dividends also renewed historical record in FY2018 and expected to increase further in FY2019.
28Disclaimer Please read this disclaimer carefully. This material is for non-Japanese institutional investors only. The research and analysis included in this report, and those opinions or judgments as outcomes thereof, are intended to introduce or demonstrate capabilities and expertise of Sumitomo Mitsui DS Asset Management Company, Limited (hereinafter “SMDAM”), or to provide information on investment strategies and opportunities. Therefore this material is not intended to offer or solicit investments, provide investment advice or service, or to be considered as disclosure documents under the Financial Instruments and Exchange Law of Japan. The expected returns or risks in this report are calculated based upon historical data and/or estimated upon the economic outlook at present, and should be construed no warrant of future returns and risks. Past performance is not necessarily indicative of future results. The simulated data or returns in this report besides the fund historical returns do not include/reflect any investment management fees, transaction costs, or re-balancing costs, etc. The investment products or strategies do not guarantee future results nor guarantee the principal of investments. The investments may suffer losses and the results of investments, including such losses, belong to the client. The recipient of this report must make its own independent decisions regarding investments. The opinions, outlooks and estimates in this report do not guarantee future trends or results. They constitute SMDAM’s judgment as of the date of this material and are subject to change without notice. The awards included in this report are based on past achievements and do not guarantee future results. The intellectual property and all rights of the benchmarks/indices belong to the publisher and the authorized entities/individuals. This material has been prepared by obtaining data from sources which are believed to be reliable but SMDAM can not and does not guarantee its completeness or accuracy. All rights, titles and interests in this material and any content contained herein are the exclusive properties of SMDAM, except as otherwise stated. It is strictly prohibited from using this material for investments, reproducing/copying this material without SMDAM’s authorization, or from disclosing this material to a third party. Registration Number: The Director of Kanto Local Finance Bureau (KINSHO) No.399 Member of Japan Investment Advisers Association, The Investment Trusts Association, Japan and Type Ⅱ Financial Instruments Firms Association © Sumitomo Mitsui DS Asset Management Company, Limited
You can also read