APA Group investor pack - As at 26 August 2020
←
→
Page content transcription
If your browser does not render page correctly, please read the page content below
APA Group
investor pack.

As at 26 August 2020
Thanks for your interest in APA.

In this pack you’ll find:
• Snapshot, Strategy and Value Proposition    4 - 13
• Company Structure                          14 - 16
• Financial Metrics                          17 - 22
• Gas Market Overview                        23 - 27
• Asset Specific Information                 28 - 38
APA overview

               3
snapshot of APA
…a leading Australian energy infrastructure business
                                                                                                                               Assets owned/operated
                         Market capitalisation
                                                                                                                               ~$22 billion
                         $13.1 billion (as at 21 August 2020)
                         $0.6 billion (as at 30 June 2000)

                                                                                                                               Gas transmission(1)
                                                                                                                               15,425 km transmission pipelines
                          Credit ratings
                          Moody’s: Baa2 (outlook Stable)                                                                       Gas distribution(2)
                          S&P: BBB (outlook Stable)                                                                            ~29,500 km gas mains & pipelines
                                                                                                                               >1.4 million gas consumers

                                                                                                                               Gas fired power generation(1)
                          Listed                                         Employees                                             418 MW
                          S&P/ASX 50                                     ~1,900
                                                                                                                               Renewable energy generation(1)
                                                                                                                               149.3 MW Solar
                                                                                                                               342 MW Wind

                           Register composition                                                                                Gas storage
                           Securities on issue:                     1,179.9 million                                            12,000 tonnes LNG
                           Securityholders:                         ~75,000                                                    18 PJ gas
                           Institutional/retail:                    70:30
                           Domestic/international:                  75:25                                                      Gas processing(3)
                                                                                                                               113 TJ/day processing plants

                                                                                                                               Electricity transmission
                                                                                                                               244 km HV

Notes:
(1) Includes 100% of assets operated by APA Group, which form part of Energy Investments segment, including SEA Gas and EII.
(2) Includes 100% of assets operated by APA Group in Queensland, New South Wales, Victoria and South Australia.
(3) Includes Orbost Gas Processing Plant at 68 TJ/day nameplate capacity                                                                                          4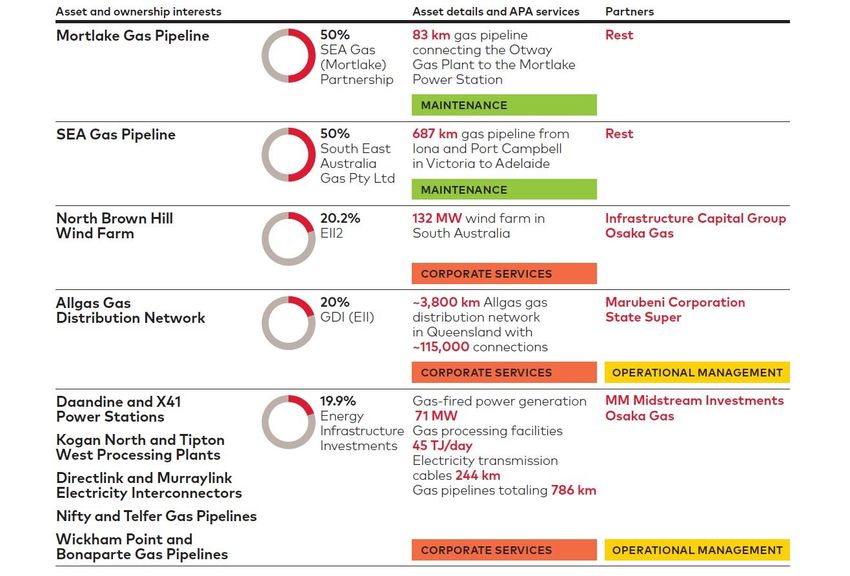
our footprint
                                                                                                  Darwin

          APA assets and investments             Integrated Operations Centre
         APA operated assets                     Gas-fired power station
         Other natural gas pipelines
                                                 Gas processing plant
         Electricity interconnectors
         Gas storage                             LNG plant
                                                                                             Northern
         Wind Farm                               Natural Gas &                               Territory
                                                 ethane 2P reserves,                                                 Mount
         Solar Farm                              as at May 2019                                                        Isa
                                                 Source: EnergyQuest June 2019
                                                                                                                                   Queensland
ts       Integrated Operations Centre                                                                                                                               Gladstone
                                                                           Western
         Gas-fired power station                                           Australia
s
         Gas processing plant                                                                                                                         Wallumbilla
                                                                                                                                                                             Brisbane
                                                                                                  South
         LNG plant                                                                               Australia           Moomba

         Natural Gas &
         ethane 2P reserves,                                                                                                                         New
                                                                                                                                                     South
         as at May 2019                                                                                                                              Wales
         Source: EnergyQuest June 2019
                                              Perth

                                                                                                                                                                    Sydney
                                                                                                                        Adelaide
                                                                                                                                   Victoria

       Australian gas transmission pipeline ownership by kilometres
                                                                                                                                              Melbourne

                                                                                                                                                  Tasmania

                                                                                       Note: *includes SEA Gas Pipeline and Mortlake Pipeline.
                                                                                       Source: Company reports; APA data as at 30 June 2020 and includes the
                                                                                       Ethane Pipeline.
                                                                                                                                                                                5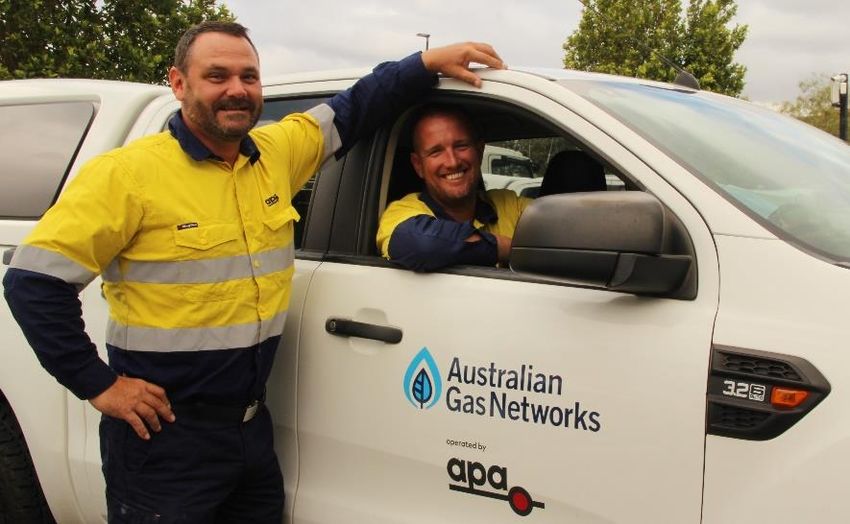
APA’s strategy

 •   Deliver services our customers value consistent with our Customer Promise

 •   Continue to strengthen asset and stakeholder management, development and
     operational capabilities

 •   Our growth focus is to enhance our portfolio of:

     –   gas transmission pipelines

     –   power generation: gas-fired and renewable energy

     –   midstream energy infrastructure assets, including gas storage and gas processing

 •   Explore growth opportunities in our core business of gas transmission and distribution in
     North America

 •   Investigation of technology transformation of energy

 •   Maintain APA’s financial strength

                                                                                                 6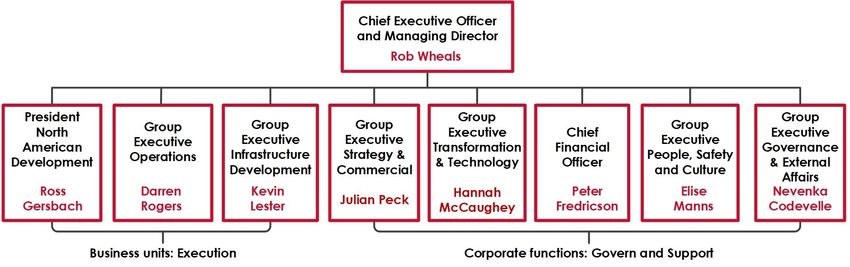
asset portfolio development
2017-2020
20 years / >$14 billion
APA’s largest organic
growth capex
program
~$1.7 billion of energy
infrastructure added to
of investment into the Australian gas market 2014-2016 APA’s footprint over the 4
Access to LNG export year period
market Reedy Creek
2011-2013 Wallumbilla Pipeline
Creation of the East Wallumbilla Gladstone Yamarna Gas Pipeline
Coast Grid Pipeline, APA’s first “off and Gruyere Power
shore” asset Station
APA’s East Coast Grid (revenue in USD) Orbost Gas Processing
comprises of Plant
2006-2010 7,600 kilometres of Acquisitions includes Agnew Lateral
More growth interconnected gas Wallumbilla Gladstone Mt Morgans Gas
Obtained investment transmission pipeline, over Pipeline Pipeline
40 receipt points and ~100
grade credit ratings delivery points. It provides
Diamantina and Emu Downs Solar Farm
Leichhardt Power Badgingarra Wind and
2001-2005 giving access to flexibility for our customers Stations (50% to 100%) Solar Farms
Asset consolidation global debt markets to seamlessly move gas Moomba to Sydney Darling Downs Solar
throughout eastern Ethane Pipeline (6% to Farm
Acquisitions: Acquisitions: Australia.
Victorian Transmission 100%)
- Roma Brisbane Pipeline
(remaining 15%) System Acquisitions:
- Carpentaria Gas
Pipeline
Central Ranges Pipeline
Berwyndale Wallumbilla
South West Queensland ~$16 b
Pipeline Total
Pipeline
- (remaining 30%)
- Mondarra Gas Storage
Pilbara Pipeline System
Amadeus Gas Pipeline
~15 b
asset
Credit ratings: Total
13 Jun 2000 Facility Emu Downs Wind Farm
- Parmelia Gas Pipeline Moody’s Baa2 asset
Listed on the S&P BBB
- Goldfields Gas Pipeline
ASX interest increased to
88.2%
1 foundation
contract: Moomba
$6.9 b
Sydney Pipeline
$3.0 b
~$1 b
Total $3.1 b
asset
$1.3 b
7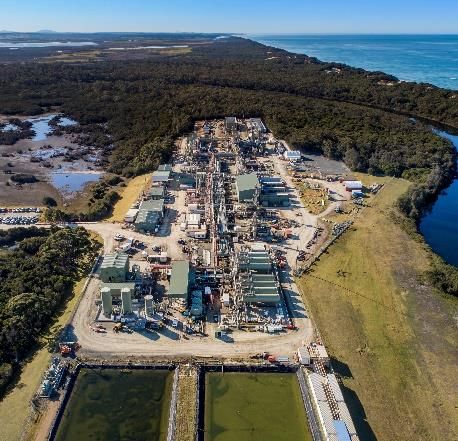
our value proposition
 “…owner and operator of energy infrastructure underwritten by long term
 contracts with highly creditworthy counterparties…”

                                   Quality &
                                   diversified
                                 infrastructure

                  Ongoing                          Low risk
                  organic                          business
                   growth                           model

                                                                           8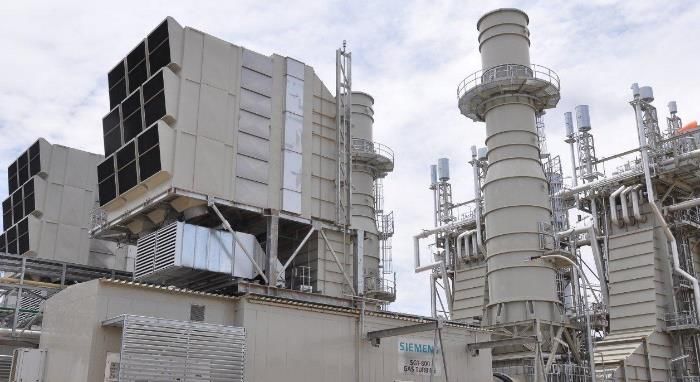
why invest in APA?

➢ Uniquely integrated energy infrastructure portfolio
  • Interconnected gas transmission pipeline grid / quality infrastructure assets
  •
  •
    Provide customers with flexibility – multi asset and/or multi service contract options
    Integrated Operations Centre (IOC) / network synergies and benefits
                                                                                             ~90%
                                                                                             Take or pay
  • Complementary energy infrastructure assets provide options for growth                     /regulated
     – Generation: gas and renewables (solar and wind)
     – Gas storage: in-pipe, LNG tank, underground
     – Gas processing
  • Asset management, operational, commercial and development expertise across
    distribution and transmission assets
➢ Low risk business model
  •   Stable and predictable cash flows
  •
  •
      Earnings are not directly tied to commodity price
      Long term take or pay contracts with CPI linkage or price regulated assets
                                                                                             ~93%
  •   Credit worthy counterparties and established customer relationships
                                                                                             Investment
                                                                                               Grade
➢ Long standing, experienced industry-based management team
➢ Consistent distribution growth – since listing:

                                                                                             2,201%
                                                                                                 TSR
                                                                                             since listing

                                                                                                             9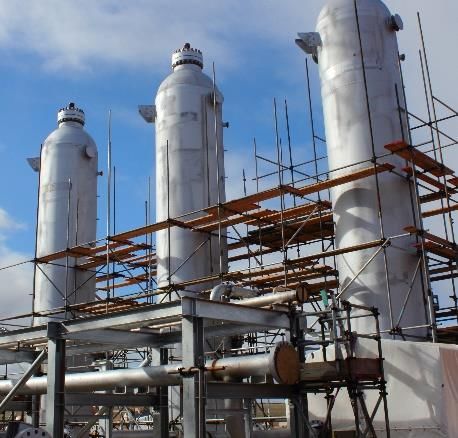
reliable guidance (historical)

   •     Stable cash flows
   •     Low risk business model
   •     Majority take or pay contracts with CPI adjustments
   •     Revenue weighted average contract tenor as at 1 Jul 2020 remains ~12 years
   •     Established customer relationships
   •     Quality and diversified asset portfolio

       $1,800m
                        EBITDA
       $1,600m          Guidance

       $1,400m

       $1,200m

       $1,000m

        $800m

        $600m

        $400m
                 FY09    FY10    FY11   FY12   FY13   FY14   FY15   FY16   FY17   FY18   FY19   FY20

                                                                                                       10
capital expenditure
Growth capex:
A$m
$900m
>$400 m pa average over the last 5 years 856
$800m >$300 m pa average over the last 10 years
$700m
$600m 581
$500m
447
427
397 396
$400m
334 341
302 *
$300m
249
194
$200m 173
135
$100m
$0m
FY08 FY09 FY10 FY11 FY12 FY13 FY14 FY15 FY16 FY17 FY18 FY19 FY20
Stay-in-business and IT capex Growth capex
5 year 10 year
millions FY08 FY09 FY10 FY11 FY12 FY13 FY14 FY15 FY16 FY17 FY18 FY19 FY20 avg* avg*
SIB and IT 12 16 15 18 24 25 45 51 53 69 113 118 139 99 65
Growth 182 285 121 155 225 373 402 346 281 272 743 463 288 409 355
Total 194 302 135 173 249 397 447 396 334 341 856 581 427 508 420
Notes: *5 year average is from FY16 to FY20, 10 year average is from FY11 to FY20.
11continued growth momentum
Normalised EBITDA Normalised operating cash flow
$1,800m $1,200m
$1,600m $1,654 $1,096
$1,574 $1,000m $1,032
$1,518 $1,012
$1,400m $1,470 $974
$1,331
$1,200m $1,269 $800m $862
$1,000m
$600m
$800m
$545
$773 $747
$600m $400m $433 $440
$400m
$200m
$200m
$0m $0m
FY13 FY14 FY15 FY16 FY17 FY18 FY19 FY20 FY13 FY14 FY15 FY16 FY17 FY18 FY19 FY20
$18,000m Total assets 60c Distributions
$16,000m
$16,007
$15,434 50c
$15,046 $15,227 50.0
$14,000m $14,653 $14,843
47.0
45.0
43.5
$12,000m 40c 41.5
38.0
$10,000m 35.5 36.3
30c
$8,000m
$7,699 $7,973
$6,000m 20c
$4,000m
10c
$2,000m
$0m 0c
FY13 FY14 FY15 FY16 FY17 FY18 FY19 FY20 FY13 FY14 FY15 FY16 FY17 FY18 FY19 FY20
12distributions and TSR returns
APA’s distributions have increased every year for nearly two decades
16.9% compound annual growth rate pa
TSR cents
2500 60.0
TSR: 2,201%(1) since listing
CAGR: 16.9% pa
50.0
2000 50.0
47.0
45.0
43.5
41.5 40.0
1500 38.0
35.5 36.3
34.4 35.0
32.8 30.0
31.0
29.5
28.0
1000
24.0
22.0 22.5 20.0
21.5 21.5 21.5
500
10.0
0 0.0
Distributions (RHS) APA TSR (LHS) ASX100 TSR (LHS) ASX 200 Utilities TSR (LHS)
Note: 1) Indexed from 13 June 2000, the date of APA’s listing on the ASX to 30 June 2020
13company structure
14group structure
• APA Group is listed as a stapled structure on the
Group Structure
Australian Securities Exchange (ASX:APA)
APA Group Securityholders
• APA is comprised of two registered managed
investment schemes:
Australian Pipeline Trust APT Investment Trust
− Australian Pipeline Trust (ARSN 091 678 778) (APT) (APTIT)
− APT Investment Trust (ARSN 115 585 441) is Austra lian P ipeline Limited
a pass-through trust (Resp onsible Entity)
APT Pipelines Ltd 100%
• Australian Pipeline Limited (ACN 091 344 704) is
the responsible entity of APT and APTIT
Operating assets and
Passive investments
investments
• The units of APT and APTIT are stapled and
must trade and otherwise be dealt with together
• APT Pipelines Limited (ABN 89 009 666 700), a
company wholly owned by APT, is APA’s Tax Structure
borrowing entity and the owner of the majority
of APA’s operating assets and investments
APT APTIT
Financial reporting segments within APT 30% tax 0% tax
• Energy Infrastructure: APA’s wholly or majority owned
energy infrastructure assets
~72% ~28%
• Asset Management: provision of asset management
and operating services for the majority of APA’s
APA Group
investments
• Energy Investments: interests in energy infrastructure
investments
15APA’s new operating model
➢ Clear accountabilities
➢ Strategic alignment
➢ Customer focused
➢ Agile decision making
➢ Empower our people to make the right decisions at the right level
➢ Invest resources into the business where they are needed
*
Note: *On 12 August 2020, APA announced that Adam Watson would join APA as the new CFO, commencing mid November 2020.
16financial metrics
175 year financials
Financial Performance (Statutory) FY2020 FY2019 FY2018 FY2017 FY2016
Revenue $m 2,590.6 2,452.2 2,386.7 2,326.4 2,094.3
Revenue excluding pass-through(1) $m 2,129.5 2,031.0 1,941.4 1,888.3 1,656.0
EBITDA $m 1,653.9 1,573.8 1,518.5 1,470.1 1,330.5
Depreciation and amortisation expense $m (651.6) (611.4) (578.9) (570.0) (520.9)
EBIT $m 1,002.4 962.4 939.6 900.1 809.7
Interest expense $m (497.3) (497.4) (509.7) (513.8) (507.7)
Tax expense $m (187.2) (177.0) (165.1) (149.5) (122.5)
Profit after tax including significant items $m 317.1 288.0 264.8 236.8 179.5
Significant items – after income tax $m - - - - -
Profit after tax excluding significant items $m 317.1 288.0 264.8 236.8 179.5
Financial Position
Total assets $m 16,007.2 15,433.9 15,227.2 15,045.9 14,842.7
Total drawn debt(2) $m 9,983.6 9,352.1 8,810.4 9,249.7 9,037.3
Total equity $m 3,223.9 3,599.4 4,126.8 3,978.2 4,029.1
Operating Cash Flow
Operating cash flow(3) $m 1,095.9 1,012.1 1,031.6 973.9 862.4
Key Financial Ratios
Earnings per security(4) cents 26.9 24.4 23.3 21.2 16.0
Operating cash flow per security(4) cents 92.9 85.8 90.7 87.1 77.1
Distribution per security cents 50.0 47.0 45.0 43.5 41.5
Funds From Operations to Net Debt % 12.2 10.7 10.7 10.8 9.5
Funds From Operations to Interest Times 3.3 3.0 3.0 3.0 2.7
Weighted average number of securities(4) m 1,179.9 1,179.9 1,136.9 1,118.5 1,118.5
(1) Pass-through revenue is revenue on which no margin is earned.
(2) APA’s liability to repay debt at relevant due dates of the drawn facilities. This amount represents current and non-current borrowings as per balance sheet
and is adjusted for deferred borrowing costs, the effect of unwinding of discount, unrealised foreign exchange differences reported in equity and deducting
other financial liabilities that are reported as part of borrowings in the balance sheet.
(3) Operating cash flow = net cash from operations after interest and tax payments.
(4) On 23 March 2018, APA Group issued 65,586,479 new ordinary securities, resulting in total securities on issue of 1,179,893,848. The weighted average numbers
of securities from FY2016 to FY2018 have been adjusted to account for that rights issue.
185 year financials (con’t)
EBITDA by Segment
(Excluding Significant Items) FY2020 FY2019 FY2018 FY2017 FY2016
EBITDA (Continuing businesses)
Energy Infrastructure
East Coast:
Queensland $m 1,007.9 1,010.1 962.2 925.4 855.8
New South Wales $m 160.8 149.4 147.1 149.5 121.7
Victoria $m 101.9 114.0 124.6 123.0 120.6
South Australia $m 2.3 2.1 2.6 2.3 2.5
Northern Territory $m 19.9 19.2 22.9 18.8 17.5
Western Australia $m 337.1 277.8 237.6 234.7 217.6
Energy Infrastructure Total $m 1,629.8 1,572.4 1,497.1 1,453.7 1,335.5
Asset Management $m 63.3 53.0 66.2 58.7 53.9
Energy Investments $m 35.7 28.4 23.1 24.4 27.8
Corporate costs $m (75.0) (80.1) (67.9) (66.7) (86.7)
Divested businesses $m - - - - -
19debt maturity profile
APA maintains diversity of funding sources and spread of maturities(1)
$1,600m
Headroom (undrawn
committed facilities)
Bank borrowings
$1,400m
Sterling MTN
$1,200m
Euro MTN
US 144A Notes
$1,000m
Japanese MTN
$800m
Australian MTN
US Private Placement Notes
$600m
USD denominated
obligations(2)
$400m
$200m
$0m
Note:
(1) APA debt maturity profile as at 31 July 2020.
(2) USD denominated obligations translated to AUD at the prevailing rate at inception (USD144A - AUD/USD=0.7879, Euro & Sterling MTNs at AUD/USD=0.7772).
20capital management
APA’s parameters for capital management and distributions
Capital Management:
• Retain our 2 credit ratings at Baa2/Stable (Moody’s) and BBB/Stable (S&P) to facilitate
access to global debt capital markets
• Fund growth with an appropriate mix of funds retained in the business, debt and equity
• Minimise impacts from adverse movements in interest rates through a combination of
hedging and raising debt at fixed interest rates
Distribution Policy:
• Fully covered by operating cash flow
• Grow generally in line with operating cash flow
• Sustainable over the long term
• Considered in the context of the capital needs of the business and economic conditions
21debt facilities
Total committed debt facilities at 31 July 2020
$ million Facility Drawn Tenor
amount amount
2015, 2017, & 2019 Bilateral bank
300 0 3 to 5 year facilities maturing between December 2020 to July 2022
facilities
2018 Syndicated bank facilities 1,000 0 5 and 5.5 year tranches maturing June and December 2023
2007 US Private placement 296 296 15 year tranche maturing May 2022
2012 US144a/Reg S Notes 735 735 10 year tranche maturing October 2022
2012 GBP Medium Term Notes 536 536 12 year tranche maturing November 2024
2015 US144a/Reg S Notes(1, 2) 1,777 1,777 10 and 20 year tranches maturing March 2025 and March 2035
2015 GBP Medium Term Notes(1,
2)
1,140 1,140 15 year tranche maturing March 2030
2015 EUR Medium Term Notes(2) 1,132 1,132 7 year tranche maturing March 2022
2015 EUR Medium Term Notes(1, 2) 879 879 12 year tranche maturing March 2027
2016 AUD Medium Term Notes 200 200 7 year tranche maturing October 2023
2017 US144a/Reg S Notes 1,109 1,109 10.3 year tranche maturing July 2027
2019 GBP Medium Term Notes 742 742 12.3 year tranche maturing July 2031
2019 JPY Medium Term Notes 133 133 15 year tranche maturing June 2034
2020 EUR Medium Term Notes 1,018 1,018 10.2 year tranche maturing July 2030
Total 10,997 9,697
Note: (1) USD denominated obligations translated to AUD at the prevailing rate at inception (USD144A - AUD/USD=0.7879, EMTN & Sterling - AUD/USD=0.7772)
(2) Original designated debt raised to fund Wallumbilla Gladstone Pipeline.
22gas market overview
23gas demand, supply, price trends
Gas supply and demand East coast gas demand & production
Anticipated developments
AEMO 2020 Gas Statement of Opportunities: 2,500PJ 2P Undeveloped
2P Developed
• Supply/demand balance on the east coast remains AEMO gas demand forecast
2,000PJ
tight, with gas production in Victoria continuing to
decline
1,500PJ
• Gas supply shortfall in Victoria to take effect from
around 2023 1,000PJ
Transportation costs
500PJ
• Gas transmission costs have not increased in real terms
for more than a decade 0PJ
2000 2007 2014 2021F 2028F 2035F
• Transportation cost is only 8-10% of the final gas price
Source: Demand – AEMO GSOO 2020
Supply - EnergyQuest (actuals); AEMO GSOO (forecast)
Wholesale gas price - East coast gas market average East coast gas price trends
Source: LNG netback prices – ACCC, LNG netback price series, Jul 2020
Source: Gas Trend 2016 and 2017. Large industrial customer data, Jan 2018, Wholesale delivered gas prices forecast – AEMO, Core Energy –
Oakley Greenwood. Wholesale Gas Price Outlook 2020-2050, Eastern Australia average,
neutral scenario 24energy infrastructure contracting
Number of renewed firm service contracts
Pipeline recontracting ongoing:
60
• No formal access requests which may trigger
arbitration process 50
• Since the GMRG reforms (1 Aug 2017) were 40
introduced, APA has entered into ~300 contracts or
variations across all transmission pipelines (e.g. MDQ 30
changes, new services, new or amended GTAs,
amended receipt and delivery points) 20
• Of the ~300 contracts, 90 relate to firm service 10
contract renewals with existing customers
0
FY18 FY19 FY20
Revenue certainty underpinned by long-term contracts:
• Revenue weighted average contract tenor as at
1 July 2020 remains around 12 years 14
• Expansions and new infrastructure are underpinned by 12
long term contracts 10
`
8
Contracting flexibility: 6
• APA offers flexible multi asset, multi service contracts 4
across APA’s interconnected portfolio with ~60 receipt 2
points and 170 delivery points nationally operated by 0
APA’s integrated operations centre 1-Jul-17 1-Jul-18 1-Jul-19 1-Jul-20
Revenue Weighted Average Tenor
Notes:
1 July 2016 estimate, 1 July 2017 onwards are based on the Gas Market
Reform Group (GMRG) data.
25regulation of Australian gas pipelines
• In FY2020, 8.0% of APA’s EBITDA in Energy Infrastructure was from
full regulated assets
APA pipelines by regulation type
• Gas pipelines are regulated by the Australian Energy Regulator
(AER) or, the Economic Regulation Authority of Western Australia
(ERA)
• Australia’s economic regulatory regime for gas pipelines is set
out in the National Gas Law (NGL) and the National Gas Rules
(NGR). Some of APA’s pipelines have been covered by the
National Gas Access Regime since it was introduced in the
1990’s. There are 2 frameworks under the NGR:
• There are 2 frameworks under the National Gas Rules (NGR):
1) Scheme pipelines (NGR Parts 8-12) are subject to either:
- full regulation, where the AER or ERA must approve a full
access arrangement that sets out reference tariffs, terms
and conditions. Pipeline users can opt for non-regulated
services on full regulation pipelines, or
- light regulation, where pipeline owners must publish
services and prices and comply with information
provision requirements to support negotiations or
alternatively seek regulatory approval for a limited
access arrangement. A regulatory negotiate-arbitrate
mechanism is available in the case of access disputes.
2) Non-Scheme pipelines (NGR Part 23) – The Part 23 regime
came into effect from August 2017 and provides for
additional information disclosure and a commercial
negotiate-arbitrate mechanism as part of a dispute
resolution framework.
26regulation of Australian gas pipelines (con’t)
Schedule of
regulatory
reset dates
for APA
Access • Apply for a term, generally 5 years
arrangement • Set out the terms and conditions of third party access, including
• At least one reference service that is commonly sought by customers – for pipelines, this is
generally firm forward-haulage services
• A reference (benchmark) tariff for the reference service
Reference • Provides a default tariff for customers seeking the reference service but tariffs can also be
tariff negotiated for other services
• Determined with reference to regulated revenue, capacity and volume forecasts
Regulated • Determined using the building block approach to recover efficient costs
revenue • Forecast operating and maintenance costs
• Regulatory asset depreciation and
• Return on value of regulated assets (regulated asset base) based on WACC determination
• Return is now a binding (defined methodology) rate of return as at Dec 2018 for the next 4
years
• WACC based on 60:40 debt equity split
Regulated • Opening RABs have been settled with the regulator; there are no reassessments for approved
asset base RABs
(RAB) • RABs adjusted every access arrangement period
• Increased by capital invested into the asset and reduced by regulatory depreciation costs
27asset specifics
28history - Energy Infrastructure business segment
2000 2001 2002 2003 2004 2005 2006 2007 2008 2009 2010 2011 2012 2013 2014 2015 2016 2017 2018 2019 2020
Roma Brisbane Pipeline 85%,60 TJ/d 100%, 208 TJ/d 233 TJ/d Bi-directional
Carpentaria Gas Pipeline 70%, 90 TJ/d 100%, 102 TJ/d 119 TJ/d Bi-directional
Moomba Sydney Pipeline 100% Bi-directional
Central West Pipeline 100%
Goldfields Gas Pipeline 40%, 106 TJ/d 88.2% 155 TJ/d 202 TJ/d
Kalgoorlie Kambalda Pipeline 45% 100%
Amadeus Gas Pipeline 96%, 115 TJ/d 100% 165 TJ/d
Mid West Pipeline 50%
Parmelia Gas Pipeline
Mondarra Storage and Processing Facility 3 PJ 15 PJ 18 PJ
Victorian Transmission System
Dandenong LNG Storage Facility
SESA Pipeline
Central Ranges Pipeline and Networks
Berwyndale Wallumbilla Pipeline
Emu Downs Wind Farm
South West Queensland Pipeline Bi-directional
Pilbara Pipeline System
Wallumbilla Gladstone Pipeline
Eastern Goldfields Pipeline 21 TJ/d 57 TJ/d
Moomba Sydney Ethane Pipeline
Diamantina Power Station
Reedy Creek Wallumbilla Pipeline
Mt Morgans Gas Pipeline
Emu Downs Solar Farm
Yamarna Gas Pipeline
Agnew Lateral
Gruyere Power Station
Badgingarra Wind Farm
Darling Downs Solar Farm
Badgingarra Solar Farm
Orbost Gas Processing Plant*
Notes: 1) *Asset under commissioning
Assets at listing Acquisitions Greenfield new builds
2) Percentages (%) represents APA’s ownership.
3) Capacity is indicative of major expansions. 29history - Energy Investments and Asset Management segments
2006 2007 2008 2009 2010 2011 2012 2013 2014 2015 2016 2017 2018 2019 2020
SEA Gas Pipeline 33.3% 50%
Allgas Gas Distribution Network 100% 20%
AGN (Envestra) 17% 30.6% 33% 0%, O&M until 2027
Daandine and X41 Power Stations 19.9%
Kogan North and Tipton West
19.9%
Gas Processing Plants
Directlink and Murraylink
19.9%
Electricity Interconnectors
Nifty and Telfer Gas Pipelines 19.9%
Wickham Point Pipeline 19.9%
Bonaparte Gas Pipelines 19.9%
6% 100% acquired by APA
Ethane income fund(1) Energy infrastructure
North Brown Hill Wind Farm 20.2%
100% acquired by APA
Hasting Diversified Utilities Fund(1,2) 14.9%
Energy infrastructure
100% acquired by APA
Diamantina Power Station(1) 50%
Energy infrastructure
Mortlake Gas Pipeline 50%
Notes: 1) Fully acquired and was transferred into Energy Infrastructure.
2) Moomba to Adelaide Pipeline System was divested to QIC in April 2013.
3) Percentages (%) represents APA’s ownership. 30historical normalised EBITDA by asset – Energy Infrastructure
$ millions FY16 FY17 FY18 FY19 FY20
East Coast Grid
Wallumbilla Gladstone Pipeline 475.2 488.0 515.9 542.4 538.9
South West Queensland Pipeline 240.3 242.4 244.3 250.0 254.4
Moomba Sydney Pipeline(1) 121.7 149.5 147.1 149.4 160.8
Victorian Systems 120.6 123.0 124.6 114.0 101.9
Roma Brisbane Pipeline 57.7 58.6 60.9 58.4 56.9
Carpentaria Gas Pipeline 38.6 35.6 39.0 36.8 29.5
Other Qld assets 20.6 13.5 14.0 20.7 23.1
East Coast Grid Total 1,074.7 1,110.6 1,145.7 1,171.5 1,165.5
Northern Territory
Amadeus Gas Pipeline 17.5 18.8 22.9 19.2 19.9
Western Australia
Goldfields Gas Pipeline 115.1 111.5 111.8 125.2 149.9
Eastern Goldfields Pipeline 14.2 36.3 37.7 45.6 51.0
Mondarra Gas Storage and Processing Facility 31.8 33.6 32.8 33.8 36.1
Pilbara Pipeline System 28.3 27.5 27.8 28.2 27.6
Other WA assets 8.2 3.4 4.0 3.6 7.0
South Australia
SESA Pipeline and other SA assets 2.5 2.3 2.6 2.1 2.3
Power Generation
Diamantina Power Station 23.3 87.4 88.3 90.9 89.4
Badgingarra Wind and Solar Farms 0.0 0.0 0.0 14.7 33.5
Emu Downs Wind and Solar Farms 19.9 22.4 23.6 23.2 24.8
Darling Downs Solar Farm 0.0 0.0 0.0 11.0 15.7
Gruyere Power Station 0.0 0.0 0.0 3.5 7.2
Grand Total 1,335.5 1,453.7 1,497.1 1,572.4 1,629.8
Notes: Numbers in the table may not add up due to rounding.
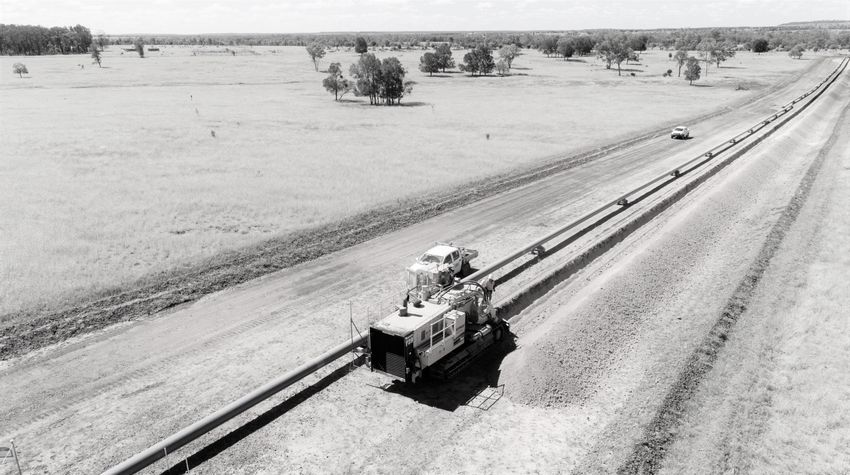
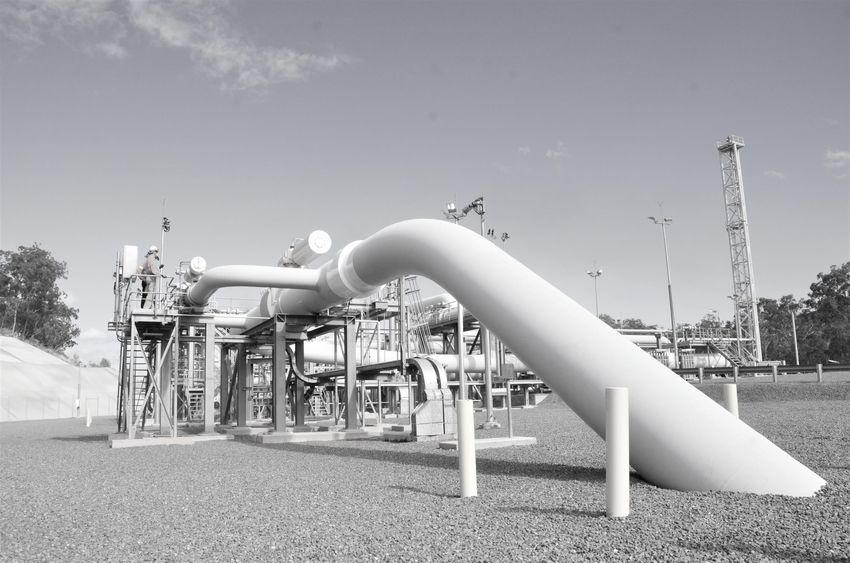
(1) includes other NSW Pipelines 31Wallumbilla Gladstone Pipeline, QLD
• Delivers gas to Gladstone for LNG Mount
export
Isa
• Fully contracted revenue through to 2035, derived
Queensland
through take-or-pay GTAs with foundation shippers
(BG Group & CNOOC) with two 10 year options to Wallumbilla
extend Gladstone Gladstone
Pipeline
• APA holds rights to further services and pipeline
expansion
• Initial EBITDA guidance based on US$355 million plus
CPI(1) for 20 years
Wallumbilla Brisbane
• Tariffs are escalated in January each year by US CPI,
Moomba IOC
with operating costs passed through to the shippers
• Average forward USD/AUD exchange rates: Directlink
- FY20 0.7192
- FY21 0.7199
Key Stats
- FY22(2) 0.7099 CRP
Length 556 km
• At WGP financial close, APA had issued debt totalling
Diameter CWP 42 inch
USD $3.7 billion equivalent to AUD $4.7 billion(3),
borrowed at an all-in of 4.26% Capacity 1,510 TJ/ day
Regulatory Status Non-Scheme Pipeline
Sydney
APA Ownership 100%
Notes: Delivery Point 6
(1) US CPI to be applied as at 1 January onwards
(2) Average forward USD/AUD exchange rates hedged to March 2022 Receipt Point 7
(3) Based on FX rates at inception date
32East Coast and Central Region
APA’s 7,600 plus kilometre integrated pipeline grid on the east coast of Revenue by customer industry
Australia has the ability to transport gas seamlessly from multiple gas
production facilities to gas users across four states and the ACT, as well as
to the export LNG market out of Gladstone in Queensland.
The East Coast Grid is comprised:
• Wallumbilla Gladstone Pipeline, 556 km
• South West Queensland Pipeline, 936 km
• Roma Brisbane Pipeline, 583 km
• Moomba Sydney Pipeline, 2,029 km
• Central West Pipeline, 255 km
• Central Ranges Pipeline, 250 km
• Carpentaria Gas Pipeline, 944 km
• Victorian Transmission System, 1,847 km
Note: East Coast and Central Region Energy
Infrastructure revenue including power generation.
Historical financials1, A$m FY16 FY17 FY18 FY19 FY20
Revenue 1,268.1 1,481.3 1,508.2 1,558.4 1,568.4
EBITDA 1,118.0 1,218.9 1,259.5 1,294.6 1,292.8
-Margin 88.16% 82.3% 83.5% 83.1% 82.4%
-Growth 82.9% 9.0% 3.3% 2.8% 0.0%
Key facts
East Coast gas demand2 (2020) 1,977.9 PJ
Gas demand growth2 (2020-2029) (2.3%)
2P developed reserve production (2020) 1,871.3 PJ
Natural gas and ethane reserves
(proved and probable) 35,679 PJ
Source: AEMO GSOO 2020, EnergyQuest June 2020 Quarterly report.
Note: 1) includes power generation.
2) excludes Northern Territory. 33Western Australia
APA services a range of customers in Western Australia within Revenue by customer industry
the resources, industrial and utility sectors. APA’s assets enable
our customers to have a reliable energy source to supply their
iron ore, nickel and gold mining operations. Pipeline and
storage services also deliver security of supply for Perth and the
south-west.
Key assets in Western Australia:
• Goldfields Gas Pipeline, 1,546 km
• Eastern Goldfields Pipeline, 293 km
• Pilbara Pipeline System, 249 km
• Mid West Pipeline, 362 km
• Parmelia Gas Pipeline, 448 km
• Mondarra Gas Processing and Storage Facility, 18 PJ
Note: Western Australia Energy Infrastructure revenue
including power generation.
Historical financials1, A$m FY16 FY17 FY18 FY19 FY20
Revenue 260.5 291.7 293.1 340.7 405.3
EBITDA 217.6 234.7 237.6 277.8 337.1
-Margin 83.5% 80.5% 81.0% 81.5% 83.2%
-Growth 2.4% 7.9% 1.2% 16.9% 21.3%
Key facts
Gas demand (2020) 1,046 PJ
Gas demand growth (2020-2029) 11.4%
Potential supply (2020) 1,458 PJ
Natural gas and ethane reserves
(proved and probable) 64,307 PJ
Source: AEMO WA GSOO 2019, EnergyQuest June 2020 Quarterly report.
Note: 1) includes power generation.
34power generation - gas and renewables
Diamantina Power Station in Queensland
• APA owns and/or operates a portfolio of gas, wind and solar
power generation assets totalling ~909 MW
• Assets are located in Queensland, South Australia and Western
Australia
• Our key power generation assets include:
➢ Diamantina and Leichhardt Power Stations, 302 MW (own
and operate)
➢ Gruyere Power Station, 45 MW (own and operate)
Darling Downs Solar Farm
➢ Emu Down Wind and Solar Farms, 100 MW (own and
operate)
➢ Badgingarra Wind and Solar Farms, 149.3 MW (own and
operate)
➢ Darling Downs Solar Farm, 110 MW (own and operate)
➢ North Brown Hill Wind Farm 132 MW (20.2 % ownership)
➢ Daandine and X41 Power Stations , 71 MW (19.9%
ownership and operate)
• Ownership/investments in renewables since 2009
Badgingarra Wind Farm
• Commenced a pilot project on renewable methane in FY2019
Historical financials, A$m FY16 FY17 FY18 FY19 FY20
Revenue 258.7 297.9 337.5
EBITDA 43.2 109.8 111.8 143.3 170.6
-Margin 45.2% 48.1% 50.5%
-Growth 99.1% 154.2% 1.8% 28.1% 19.1%
35mid stream processing and storage
Orbost Gas Processing Plant
• Located approximately 375km east of Melbourne on the Victorian east coast
• Connects Cooper Energy’s Sole gas field to eastern Australian gas market
• Capacity to process up to ~68 TJ/day, practical completion yet to be achieved
• APA and Cooper remain jointly focused on completing the plant to deliver
additional gas supply to the market
• Scope within the agreements for plant expansion to process gas from the
nearby Manta gas field
• Also an existing pipeline connection to Patricia Baleen and Longtom gas fields
(subject to approvals) Orbost Gas Processing Plant
Mondarra Gas Storage and Processing Plant
• Strategically located at the intersection of APA’s Parmelia Gas Pipeline and the
Dampier to Bunbury Natural Gas Pipeline to enhance security of supply for
Perth and create cost-effective options
• Provides gas sellers and buyers with the flexibility to better manage their gas
production and consumption
• Expanded in 2013 to 15 PJ which was 5 times its original operating capacity,
then again in 2016 to 18 PJ
Mondarra Gas Storage
Dandenong LNG storage bullet
• Provides gas buyers, including gas retailers, flexibility in the East Australian gas
market, by providing options to manage gas supply and demand during
production outages or emergencies and peak demand periods
• Storage of up to 12,000 tonnes of LNG
Kogan North and Tipton West Processing
Plants (19.9% investment)
• Kogan North and Tipton West Processing Plants filter, dehydrate, and compress gas Dandenong LNG storage
for Swanbank E Power Station and the Braemar Power Station in Queensland
• Processes up to 45 TJ/day
36Asset Management business segment
• Provides asset management and operational services for most of APA’s energy infrastructure assets, energy
investments, as well as to third parties.
• Generally provided under long-term contracts (e.g. AGN contract until 2027)
• Covers assets including gas distribution networks and gas transmission pipelines, high-voltage power, power
generation, gas rotating plant and equipment, stationary engines. These operational services include asset
inspection, vegetation management, aerial patrols, metering services and specialist utility asset services.
• Customers include Australian Gas Networks Limited (AGN - formerly Envestra), Energy Infrastructure Investments
(EII), Mortlake Gas Pipeline, SEA Gas Pipeline and Allgas Distribution Network GDI (EII).
• Around 500 APA employees providing services in this business segment
37Energy investments business segment
38Disclaimer
This presentation has been prepared by Australian Pipeline Limited (ACN 091 344 704) as responsible entity of the Australian Pipeline Trust (ARSN 091 678 778) and APT
Investment Trust (ARSN 115 585 441) (APA Group).
The information in this presentation does not contain all the information which a prospective investor may require in evaluating a possible investment in APA Group and
should be read in conjunction with the APA Group’s other periodic and continuous disclosure announcements which are available at www.apa.com.au.
All references to dollars, cents or ‘$’ in this presentation are to Australian currency, unless otherwise stated.
Not financial product advice: Please note that Australian Pipeline Limited is not licensed to provide financial product advice in relation to securities in the APA Group. This
presentation is for information purposes only and is not financial product or investment advice or a recommendation to acquire APA Group securities and has been
prepared without taking into account the objectives, financial situation or needs of individuals. Before making an investment decision, prospective investors should
consider the appropriateness of the information having regard to their own objectives, financial situation and needs and seek professional advice if necessary.
Past performance: Past performance information should not be relied upon as (and is not) an indication of future performance.
Forward looking statements: This presentation contains certain forward looking information, including about APA Group, which is subject to risk factors. “Forward-looking
statements” may include indications of, and guidance on, future earnings and financial position and performance. Forward-looking statements can generally be
identified by the use of forward-looking words such as, 'expect', 'anticipate', 'likely', 'intend', 'could', 'may', 'predict', 'plan', 'propose', 'will', 'believe', 'forecast', 'estimate',
'target', 'outlook', 'guidance' and other similar expressions and include, but are not limited to, forecast EBIT and EBITDA, operating cash flow, distribution guidance and
estimated asset life.
APA Group believes that there are reasonable grounds for these forward looking statements and due care and attention have been used in preparing this presentation.
However, the forward looking statements, opinions and estimates provided in this presentation are based on assumptions and contingencies which are subject to
change without notice, as are statements about market and industry trends, which are based on interpretations of current market conditions and are subject to risk
factors associated with the industries in which APA Group operates. Forward-looking statements, opinions and estimates are not guarantees or predictions of future
performance and involve known and unknown risks and uncertainties and other factors, many of which are beyond the control of APA Group, and may involve
significant elements of subjective judgement and assumptions as to future events which may or may not be correct. There can be no assurance that actual outcomes
will not materially differ from these forward-looking statements, opinions and estimates. A number of important factors could cause actual results or performance to differ
materially from such forward-looking statements, opinions and estimates.
Investors should form their own views as to these matters and any assumptions on which any forward-looking statements are based. APA Group assumes no obligation to
update or revise such information to reflect any change in expectations or assumptions.
Investment risk: An investment in securities in APA Group is subject to investment and other known and unknown risks, some of which are beyond the control of APA
Group. APA Group does not guarantee any particular rate of return or the performance of APA Group.
Non-IFRS financial measures: APA Group results are reported under International Financial Reporting Standards (IFRS). However, investors should be aware that this
presentation includes certain financial measures that are non-IFRS financial measures for the purposes of providing a more comprehensive understanding of the
performance of the APA Group. These non-IFRS financial measures include EBIT, EBITDA and other “normalised” measures. Such non-IFRS information is unaudited,
however the numbers have been extracted from the audited financial statements.
Not an offer: This presentation does not constitute an offer, invitation or recommendation to subscribe for or purchase any security. In particular, this presentation does
not constitute an offer to sell, or a solicitation of an offer to buy, any securities in the United States. Securities may not be offered or sold, directly or indirectly, in the United
States or to persons that are acting for the account or benefit of persons in the United States, unless they have been registered under the U.S. Securities Act of 1933, as
amended (the U.S. Securities Act), or are offered and sold in a transaction exempt from, or not subject to, the registration requirements of the U.S. Securities Act and any
other applicable state securities laws.
Non-GAAP financial measures: Investors should be aware that certain financial data included in this presentation are "non-GAAP financial measures" under Regulation G
of the U.S. Securities Exchange Act of 1934, as amended. These measures are EBITDA, normalised EBITDA and statutory EBITDA. The disclosure of such non-GAAP financial
measures in the manner included in the presentation may not be permissible in a registration statement under the U.S. Securities Act. These non-GAAP financial measures
do not have a standardised meaning prescribed by Australian Accounting Standards and therefore may not be comparable to similarly titled measures presented by
other entities, and should not be construed as an alternative to other financial measures determined in accordance with Australian Accounting Standards. Although APA
Group believes these non-GAAP financial measures provide useful information to users in measuring the financial performance and condition of its business, investors are
cautioned not to place undue reliance on any non-GAAP financial measures included in this presentation.
39For further information contact:
Jennifer Blake
Head of Investor Relations
Tel: +61 455 071 006
E-mail: jennifer.blake@apa.com.au
Or visit the APA website at:
www.apa.com.au
40You can also read