ROYAL NICKEL CORPORATION - Developing the Next Great Canadian Base Metal Mine May 13, 2014 - Canadian Institute ...
←
→
Page content transcription
If your browser does not render page correctly, please read the page content below
ROYAL NICKEL CORPORATION

Developing the Next Great Canadian Base Metal Mine

                                       May 13, 2014

                                             TSX: RNX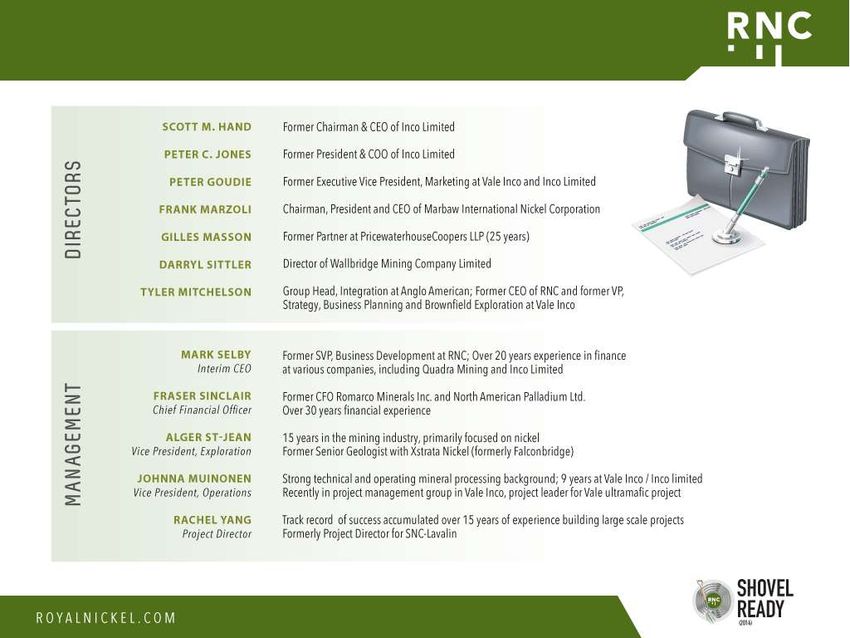
Disclaimer
 Cautionary Statements Concerning Forward-Looking Statements
 This presentation contains "forward-looking information" including without limitation statements relating to mineral reserve estimates, mineral resource estimates, realization of
 mineral reserve and resource estimates, capital and operating cost estimates, project and life of mine estimates, construction of the mine and related infrastructure, the timing and
 amount of future production, costs of production, success of mining operations, ability to obtain permitting by the time targeted, size and ranking of project upon achieving
 production, economic return estimates and potential upside and alternatives. Readers should not place undue reliance on forward-looking statements.

 Forward-looking statements involve known and unknown risks, uncertainties and other factors which may cause the actual results, performance or achievements of RNC to be
 materially different from any future results, performance or achievements expressed or implied by the forward-looking statements. The feasibility study results are estimates only and
 are based on a number of assumptions, any of which, if incorrect, could materially change the projected outcome. Even with the completion of the feasibility study, there are no
 assurances that Dumont will be placed into production. Factors that could affect the outcome include, among others: the actual results of development activities; project delays;
 inability to raise the funds necessary to complete development; general business, economic, competitive, political and social uncertainties; future prices of metals; availability of
 alternative nickel sources or substitutes; actual nickel recovery; conclusions of economic evaluations; changes in project parameters as plans continue to be refined; accidents, labour
 disputes and other risks of the mining industry; political instability, terrorism, insurrection or war; delays in obtaining governmental approvals, necessary permitting or in the
 completion of development or construction activities. The MOU with Tsingshan is non-binding and there is therefore no assurance that the strategic alliance with Tsingshan will result
 in any transaction or venture with Tsingshan. For a more detailed discussion of such risks and other factors that could cause actual results to differ materially from those expressed or
 implied by such forward-looking statements, refer to RNC's filings with Canadian securities regulators available on SEDAR at www.sedar.com.

 Although RNC has attempted to identify important factors that could cause actual actions, events or results to differ materially from those described in forward-looking statements,
 there may be other factors that cause actions, events or results to differ from those anticipated, estimated or intended. Forward-looking statements contained herein are made as of
 the date of this presentation and RNC disclaims any obligation to update any forward-looking statements, whether as a result of new information, future events or results or
 otherwise, except as required by applicable securities laws

 NI 43-101 Compliance
 The technical information pertaining to the Dumont project feasibility study in this presentation is based on RNC’s technical report dated July 25, 2013 that describes the results of the
 Dumont project feasibility study and was prepared in accordance with Canadian regulatory requirements by, or under the supervision of, Paul Staples, P. Eng. of Ausenco Limited,
 Sébastien Bernier, P.Geo. of SRK Consulting (Canada) Inc. and David A. Warren, Eng. of Snowden Mining Industry Consultants, all of whom are independent Qualified Persons as set
 out in National Instrument 43-101 Standards of Disclosure for Mineral Projects ("NI 43-101").

 The Mineral Resource estimate set out in this presentation was classified according to the CIM Definition Standards for Mineral Resources and Mineral Reserves (November 2010) by
 Sébastien Bernier, P. Geo (OGQ#1034, APGO#1847), Principal Consultant – Resource Geology at SRK.

 The Mineral Reserve estimate set out in this presentation was classified according to the CIM Definition Standards for Mineral Resources and Mineral Reserves (November 2010) by
 David A. Warren (OIQ 121481), Principal Consultant – Mining at Snowden.

 All other technical information in this presentation has been prepared by or under the supervision of Alger St-Jean, P. Geo., Vice President, Exploration of RNC and Johnna Muinonen
 P. Eng., Vice President, Operations of RNC, each a Qualified Person as defined in NI 43-101. The full Dumont feasibility study, prepared as an NI 43-101 compliant technical report, is
 available under RNC’s profile on SEDAR at www.sedar.com.

                                                   All currency references in U.S. dollars, unless otherwise stated.

                                                                                                                                                                                              2
3
4
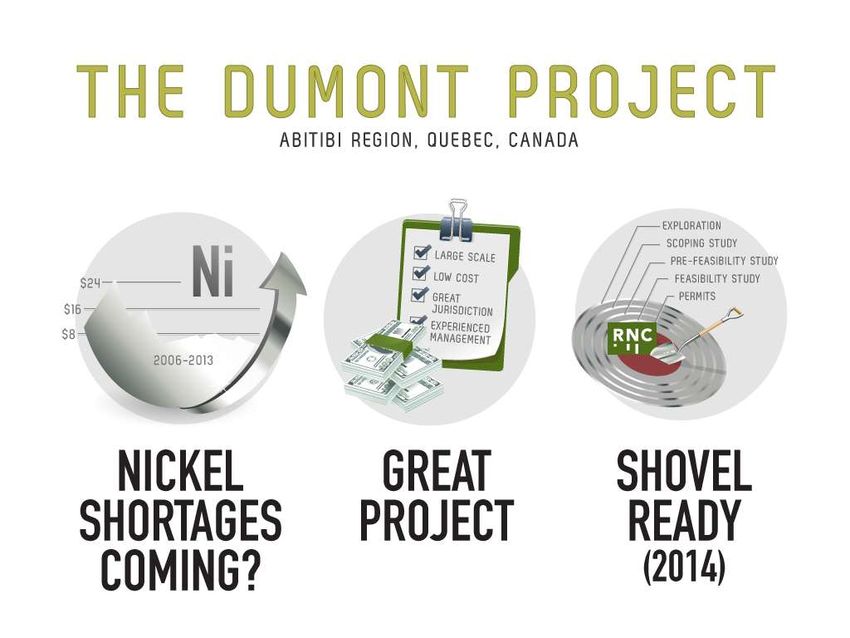
Nickel Stocks Could Run Out as Early as Mid-2015
The Indonesia ban removes 25-30% of global nickel supply - equivalent to ALL OF THE OPEC GULF STATES
CEASING OIL PRODUCTION (29% of supply). RNC believes the ban unlikely to be overturned.
Approximately 3/4 of Chinese NPI production was sourced from Indonesian ore and the export ban will
also severely impact nickel producers in Ukraine, Australia, and Japan
China has a limited ability to replace Indonesian ore and there is no certainty that significant NPI/FeNi
capacity will be built in Indonesia in the near future
RNC believes that the Philippines could only supply 5-10 Mt of high grade ore (only 10-20% of Indonesian current
exports). Please note that the Philippines has also considered export restrictions as well.
The nickel “project cupboard” was “emptied” during prior peak and few new projects have been developed
to replace them resulting in long-term structural supply shortfall
2013 marked a milestone as the last of the “tidal wave” of new projects launched in peak in prior nickel
cycle began commissioning. A number of these projects continue to struggle
Nickel prices could return to 2006-2007 ranges of $30-50,000+ per tonne as prices will once again have to rise
to force demand in line with available supply
The combination of the Indonesia ban and structural supply shortfall will lead to multi-year nickel
shortages as early as mid-2015 despite record LME inventories of 260kt and ore stockpiles in China.
Demand will need to shrink by 8% by 2016 and cannot exceed 2% annual growth by 2020 in an optimistic
supply scenario and most likely no more than 1% growth in a more conservative scenario
5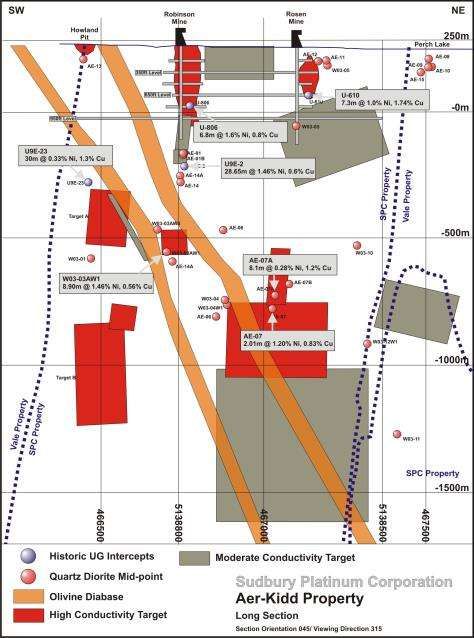
Nickel – “From Worst to First”

     Nickel has been the best performing base metal in 2014
                                    LME Base Metals Prices
                                      2014 YTD Change
                                          (as of May 13)
     55%
     50%
     45%
     40%
     35%
     30%
     25%
     20%
     15%
     10%
      5%
      0%
     -5%
    -10%
                     Nickel   Tin          Zinc       Aluminum   Lead   Copper

 Source: Metalprices.com

                                                                                 6
Indonesia Has Filled Supply Gap Globally by Allowing
Export of High-Grade Ore
    In just 5 years, Indonesia’s share of global nickel supply has nearly tripled with
    most of the increase shipped as unprocessed ore to China – Indonesia now
    equivalent to “2 Saudi Arabias”

                Indonesian Mine Supply as a % of Global Nickel Supply
 30%
                                                                                    As of
 25%                                                                           Jan. 12, 2014,
                                                                                Indonesian
 20%                                                                             nickel ore
                                                                                exports are
                                                                                   ZERO
 15%

 10%

  5%
             2005         2006   2007   2008   2009   2010   2011   2012   2013F
 Source: Wood Mackenzie Ltd.

                                                                                                7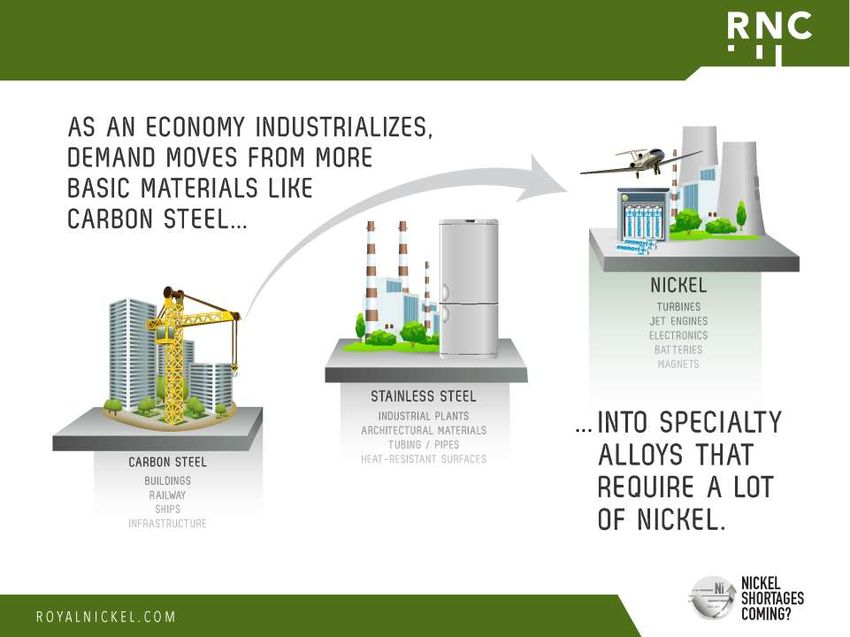
Indonesia Ore Export Ban
Likely to Stay Strictly Enforced
Many commentators cite upcoming elections, various economic , and other issues
which will cause Indonesia to water down the ban – none of which hold up well
under closer observation
Political?
When the Indonesian parliamentary committee (Commission Seven) responsible for the law
was presented with potential exemptions for companies building smelters, all nine factions in
the committee voted UNANIMOUSLY against any exemptions
Based on RNC research to date, there appears to be little political support from ANY party for
exemptions
Economic?
The central government derives little direct economic benefit from the $1-1.5 billion of
annual nickel ore exports particularly compared to the billions of dollars of potential
investment which would be required to transform even a fraction of the ore exports into
finished product
The central government owns 51% of PT Antam, the 2nd largest nickel producer in Indonesia,
which would directly benefit from higher nickel prices
Strategic?
Any changes to the export ban will reduce the incentive for investment and undercut the
rationale for the ban in the first place
8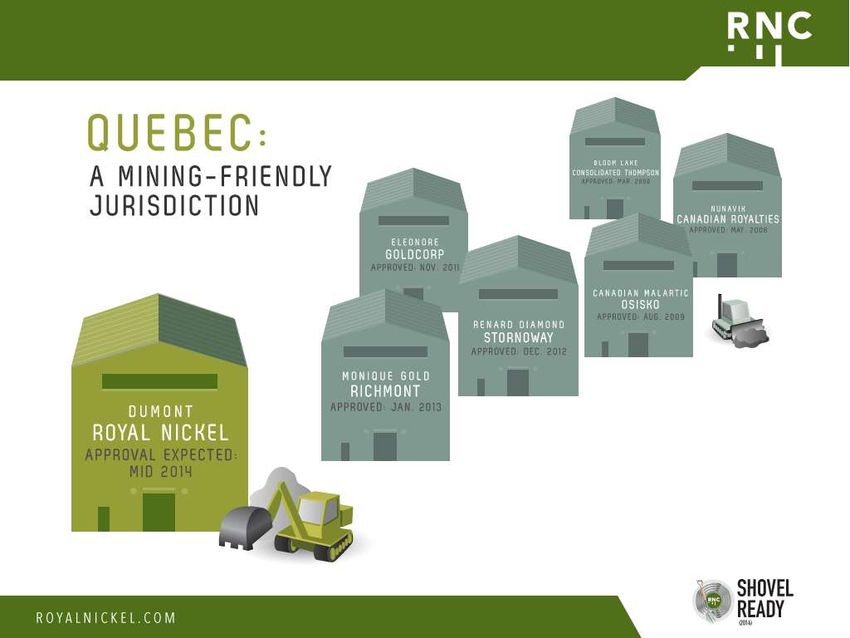
Significant Barriers
To Building NPI/FeNi Production in Indonesia
Some commentators are also suggesting that substantial capacity could be added quickly in
Indonesia. There are a number of key challenges that they may be failing to fully take into
account.
The nickel ore is located in areas with virtually no infrastructure, few people, and none
of the power required to produce NPI/FeNi
Unlike NPI plants in China, projects will have to incorporate the construction of a power
plant and all of the related support infrastructure. PT Antam – the state nickel producer has
a project with an estimated capital cost of $1.6 billion for 40ktpa of nickel output
$1+ billion investments will be challenging given Indonesia’s investment climate
(Indonesia ranks 114th on Transparency International Corruption Perceptions Index
between Egypt and Albania) and proposed regulations which would limit foreign
ownership to 49%
Operating costs could be lower than Chinese NPI production due to reduced ore and
coal shipping costs which can be potentially more than offset by differences in labour
costs and productivity and the need to source many inputs from outside
Chinese companies have a very mixed track record when investing and building mining
projects outside China
9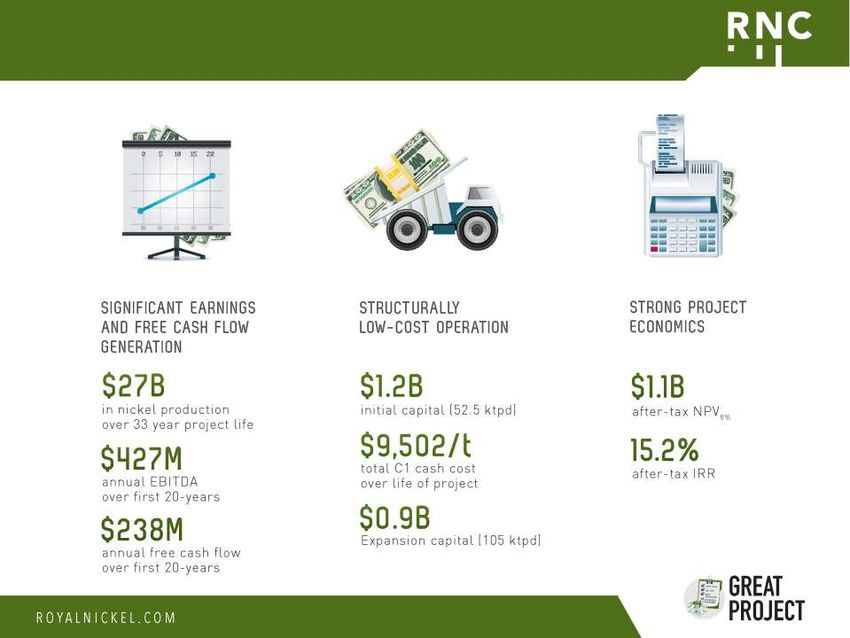
Nickel – Chinese Portside Ore Stocks are Declining and
Ore Prices are Rising
 The price of nickel ore in China has                                 Portside nickel ore stocks in China have
 more than tripled in 2014                                            steadily declined since mid-February
                120
                            Nickel Ore Prices                                                 Chinese Nickel Ore Stocks
                110        (2014 YTD 13-May)                                                         Total (Mt)
                100
                                                                                                         26.1
                      Laterite 1.8% Ni Ore                                       25.8
                 90                                                       25.4          25.2 25.0 25.3
                      (12-18% Fe)                                                                               24.7
                                                                     25
                 80   Until Jan 12: Indonesia
                                                                                                                       23.8
                      Post Jan 12: Philippines                                                                                23.4
  US$/wmt FOB

                 70
                                                                                                                                     22.5
                 60                                                                                                                         21.6

                 50                                                                                                                                20.6
                                                                                                                                                          20.2
                                                                                                                                                                 20.0 19.9
                 40                                                  20                                                                                                      19.3 19.3 19.2

                 30

                 20
                                           Laterite 1.5% Ni Ore
                 10                        (Philippines 25-30% Fe)
                  0                                                  15

 Source: Ferroalloynet.com Limited

                                                                                                                                                                                          10
China & Indonesia – An Important relationship
China NOT Self-Sufficient in Nickel
China to struggle to replace Indonesian ore as nickel is one of the metals in
which China is least self-sufficient
Chinese Self-Sufficiency 85%
Mine Supply as a % of Demand (2012)
67%
57%
54%
29%
15% 18%Few Alternatives for High Grade Laterite Ore
Outside Indonesia
There are few alternatives for high grade laterite ore outside Indonesia.
RNC estimates that the Philippines could supply a maximum of 5-10 Mt of high
grade ore (10-20% of current Indonesian exports) and New Caledonia only exports
ore to partners in Japan and Korea.
Source: Glencore: “The Realities of the Nickel Market”, November 2013
12New Nickel Supply
Fundamental Issue: An Empty “Project Cupboard”
Even without the strict implementation of the ban, the fundamental issue facing
the nickel industry by 2015–2016 is an empty “project cupboard”
At the beginning of the last decade prior to the significant run-up in nickel prices, the
“project cupboard” was very full with many projects known for decades
Today’s picture is very, very different, setting the stage for an exciting nickel cycle
Project Cupboard Project Cupboard
2001 (20+kt) 2014 (20+kt)
TOTAL: 500+ kt TOTAL: 200+kt
Barro Alto Tsingshan (Indonesia) Laterite (ferronickel)
Laterite Koniambo Weda Bay Laterite (leach)
(ferronickel) Onca Puma Dumont
Tagaung Taung Enterprise
Sulphide
Ambatovy Kabanga
Goro Nova-Bollinger
Laterite Ramu
(HPAL) Ravensthorpe
Weda Bay
Talvivaara*
Sulphide Kabanga
Voisey’s Bay *bioheapleaching process
13RNC Forecast
New Nickel Supply
The source of future nickel supply growth is NOT clear
HPAL?
Large capex overruns (projects $5+ billion), numerous delays and start-up issues
Operating costs also much higher than anticipated
FeNi?
Best projects already being developed
No new large scale high-grade (2%+) discoveries for over 30 years
Sulphides?
Largely empty project pipeline – only Enterprise, Nova-Bollinger, Dumont
Future growth likely to come from large scale, lower grade deposits
NPI?
Largely dependent on availability of higher grade Indonesian ore
No NEW technology – China now using 30+ year old RKEF technology + hot charging
Combination of lower grade ore and higher input costs will drive costs higher
14RNC Forecast Nickel Supply – “Tidal Wave” Projects New supply growth from the “tidal wave” of new projects financed during prior nickel cycle is still
RNC Forecast
Nickel Supply – New Large Projects

    Many of the new large scale projects will struggle to be financed and be put
    into production by 2020

                      Nickel Supply Growth: New Projects (kt) – High Nickel Price Scenario
                                                                              RNC Forecast
                       Project                             Annual Capacity   2015       2020
                       Weda Bay                                       35
                       Kabanga                                        20
                       Enterprise                                     40
                       Nova-Bollinger                                 28
                       Dumont (1st Phase)                            331
                       Tsingshan (Phase I&II)                         60

                       Total                                         216     80         200

                          1. Average production over phase 1 of mine life

 Source: Company reports, RNC Analysis

                                                                                               16
RNC Forecast – Supply / Demand Balance
Nickel prices will once again have to rise to force demand in line with available
supply as in 2006-2007 ($30,000-$50,000+/t), particularly 2016 when demand
must DECLINE by 8%+ to balance the market
2,800 Nickel Supply / Demand Forecast (Kt) 2,621
2,600 Underlying Demand
New NPI / Price Driven
2,400 418 Demand Destruction
410 Demand (constrained by
2,200 346
available supply)
319
2,000 288
292 NPI
1,800
1,542
1,600
1,400
1,200
1,000 Existing Supply
800
600
400
200
0
2010 2013 2014 2015 2016 2017 2018 2019 2020
Source: Wood Mackenzie Ltd, , RNC Analysis
1718
RNC’s Dumont Nickel Project: A Billion Dollar Opportunity

                                                                             4.31/lb

       Note: Price and exchange rate assumptions contained in “Key Assumptions” table found on slide 42 of this presentation

                                                                                                                               19
RNC’s Dumont Nickel Project: A Billion Dollar Opportunity
Source: Company reports and Wood Mackenzie Ltd. (December 2011); RNC 105ktpd
(LOM) vs 2012 production for other projects
20Structurally Low Cost Project in Excellent Jurisdiction
21Structurally Low Cost Project in Excellent Jurisdiction
22Structurally Low Cost, Large Scale Project
Source: Technical Report on the Dumont Ni Project, Launay and Trecesson Townships, Quebec,
Canada, July 25, 2013, available at www.royalnickel.com and on www.sedar.com.
23Tsingshan Strategic Alliance Leads to World’s 1st Integrated
Stainless Steel Plant Utilizing Sulphide Concentrate
Tsingshan currently constructing the world’s first integrated nickel pig iron (“NPI”)
plant to directly utilize nickel sulphide concentrate as part of the stainless steel
production process
The plant, located in China, is expected to begin operation in 2014
Significant potential benefits to producers of suitable nickel sulphide
concentrate feed such as RNC’s Dumont Project:
Lower costs due to simpler processing compared to traditional smelting and refining
Higher payability than traditional smelting and refining
Greater flexibility for more potential partners and customers
Roasted nickel concentrate is effectively a very high grade laterite ore feed –
creates new source of demand for nickel sulphide concentrate notably at a time
when many NPI and ferronickel producers face feed shortages as a result of
Indonesia’s recently implemented nickel ore export ban
24Well-positioned on Cost Curve
Source: RNC technical report dated July 25, 2013, Wood Mackenzie Ltd.
25Lower Capital Intensity
Source: RNC technical report dated July 25, 2013, publicly available disclosure, Wood Mackenzie Ltd. (figures shown to two significant digits)
26Developing the Next Great Canadian Base Metal Mine
Based on RNC analysis. All mines based on reported 2012 production with exception of
Dumont (technical report-July 25, 2013) expected Phase I and Phase II life of mine
production, Gibraltar Expansion (Taseko website) life of mine production. Ni-eq., Cu-
eq production calculated using the average long-term prices per tonne as of May 31,
2013 based on the 4 of 5 analysts who cover RNC and regularly publish commodity
forecasts : Au: $1,250/oz, Cu: $6,283, Mo: $29,542, Ni: $19,842, Zn:$2,315 .
2728
Continuing to Advance Project,
Only Financing and Permits Remain
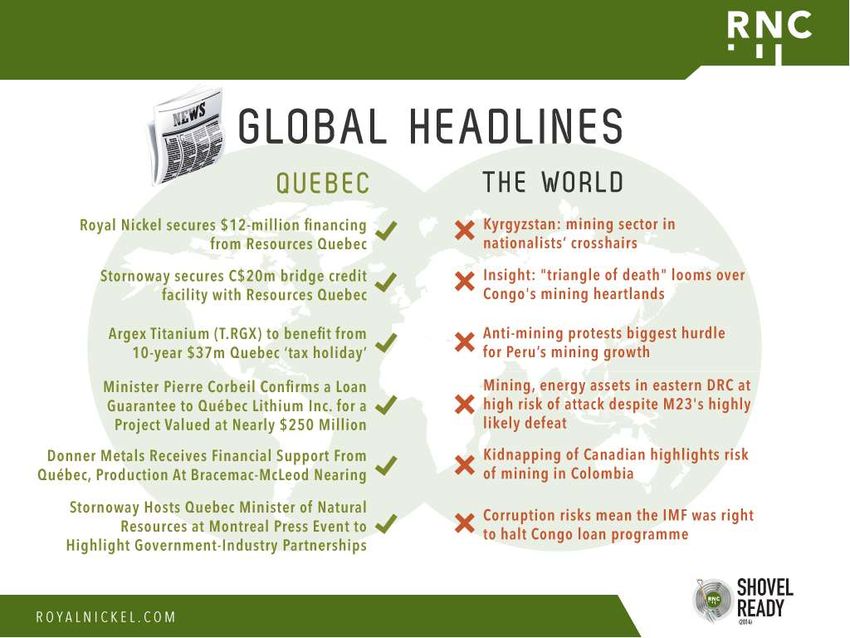
29Highly Experienced Management Team and Board
30Quebec Has Permitted Many Mines
APPROVAL EXPECTED:
2014
31Financing Options
RNC intends to pursue project financing options that minimize shareholder
dilution as it did during the feasibility study stages
In addition to the target of approximately $500- 600 million in project debt, there
are a number of other sources of potential financing which will likely be less
dilutive than raising equity
Sale of direct minority interest in project
Subordinated debt structures
Monetization of precious metal streams (PGMs)
Offtake financing
Conversations have occurred with multiple parties during the past year and are
ongoing
Several additional interested parties elected to wait until the feasibility study
was completed before entering into further discussions
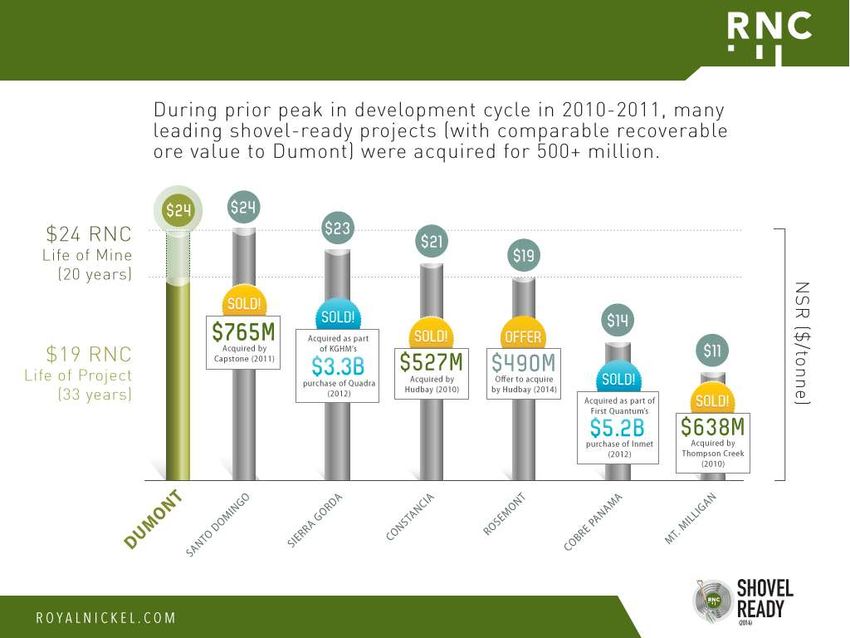
32A Leading Base Metal Project
Shovel Ready for Coming Development Cycle
Values above sourced from latest publicly available technical reports filed on each project and reflects the base case pricing used in each report.
Producing properties sourced from financial statements for recent periods selected when pricing consistent with long-term average pricing. Sources are
detailed on slide 43 of this presentation.
3334
SPC - Transaction Overview
RNC has acquired 6 MM units of Sudbury Platinum Corporation (“SPC”) for C$0.25 per
unit, each unit comprising a share and full warrant. Each warrant is exercisable at C$0.45
per share for 18 months
SPC is private subsidiary of Transition Metals Corp. (83% interest). RNC’s investment
represents a 25% interest of the issued and outstanding shares
RNC would obtain 1 seat on the SPC Board (1 of 5 members)
RNC has right to maintain pro rata share
SPC’s key asset is an option to earn up to a 70% interest in the Aer-Kidd property located
on the Worthington Offset Dyke in the Sudbury Basin
The investment is consistent with RNC’s strategy to target high quality Ni-Cu-PGM and
other base metal opportunities and RNC’s market outlook for nickel with a structural
shortfall in supply through the end of the decade
The investment allows RNC to gain exposure to one of the world’s highest potential
nickel exploration opportunities with an exploration team that has a proven track record
of success in the Sudbury basin
Aer-Kidd is also one of few properties in the Sudbury basin that does not have a captive offtake
with either Vale or Glencore
35Aer-Kidd – Significant Untested Potential
Worthington Offset Longitudinal Section, Looking Northwest
2.6 km 4.3 km
Totten Aer-Kidd Victoria
McIntyre
Vale Howland RobinsonRosen Vale KGHM (QuadraFNX)
Untested
Potential
At Depth
DDH Pierce Point
Mineralized
Non-mineralized
Mined Out
Massive & Disseminated Sulphide
Totten (deep): 10.1 Mt Victoria (deep): 14.5 Mt
1.5% Ni, 1.97% Cu, 4.8g/t PGM1 2.5% Ni, 2.5% Cu, 7.6 g/t PGM2
1. Resource reported by Inco Limited in news 2. Resource reported by KGHM in news release
release dated January 18, 2001 dated January 16, 2012
Source: Sudbury Platinum Corp.
36Appendix 1
Sources
37Dumont Feasibility Study Highlights
After-Tax NPV8% (US$ millions) $1,137
After Tax IRR 15.2%
Initial Capital (US$ millions) $1,191
Project Life (years) 33
52.5 ktpd 105 ktpd Stockpile
Average
2016-2020 2021-20361 2036-2049
Ni Production (kt/year) 33 51 31 41
Net (C1) Cash Costs (US$/t) $8,840 $9,833 $9,171 $9,502
Concentrator Nickel Recovery 53% 48% 34% 43%
Strip Ratio2 0.75 1.22 - 1.13
NSR (US$/t) $30.90 $22.63 $13.67 $19.40
Site Operating Costs (US$/t) $11.39 $10.31 $5.34 $8.27
1. 2036 is a transition year with expit operations being completed by end of Q2 2036.
2. Totals include pre-stripping of 55 Mt, including 21 million tonnes of ore and 34 million tonnes of waste before mill production commences.
Source: RNC news release dated June 17, 2013
38 38Feasibility Study
Capital and Operating Cost Summary
Capital Cost Summary Operating Cost Summary
Initial Expansion LOM Operating $ per $ per
($ millions) Capital Capital Capital1 Costs tonne tonne2
Mine 304 194 879 Mining 3,285 3.50
Process Plant 523 472 1,220 Processing 4,034 4.30
Tailings 32 55 242 G&A 441 0.47
Infrastructure 83 24 107 Total Site Cost 7,760 8.27
Indirect Costs 149 73 222 TC / RC 2,800
Contingency 100 73 173 By-products (1,058)
Total 1,191 891 2,843 Total 9,502
1 2 $/tonne ore milled .
Life-of-mine capital includes $761 million of sustaining capital
Mining cost $/tonne material mined $1.49
39 39Feasibility Study Summary
PFS Revised PFS Feasibility Study
Units Dec. 16, 20112 May 14, 20122 Jun. 17, 20133
Ore Mined Mt 1,070 1,066 1,179
Strip Ratio Waste : Ore 1.18 1.19 1.13
Nickel Recovery % nickel 41 45 43
Project Life Years 31 31 33
Annual Production (contained)
Nickel (life of mine) Mlbs (kt) 96 (44) 108 (49) 104 (47)
Nickel (life of project) Mlbs (kt) 82 (37) 91 (41) 90 (41)
Cobalt (life of project) Mlbs (kt) 6 (3) 4 (2) 4 (2)
PGEs (life of project) Koz 18 - 19
Total C1 Cash Costs $/lb Ni ($/t Ni) $4.68 ($10,582) $4.32 ($9,524) $4.79 ($10,560)
By-product Credits $/lb Ni ($/t Ni) $0.55 ($1,213) $0.25 ($551) $0.48 ($1,058)
Net C1 Cash Costs $/lb Ni ($/t Ni) $4.13 ($9,105) $4.07 ($8,973) $4.31 ($9,502)
Average EBITDA4 $M $410 $470 $427
Average Free Cash Flow4 $M $228 $262 $238
Initial Capital $M $1,112 $1,112 $1,191
Total Capital $M $2,578 $2,680 $2,843
Pre-Tax NPV8% $M $1,918 $2,437 $2,003
Pre-Tax IRR 20.2% 23.5% 18.7%
Post-Tax NPV8% $M $1,083 $1,420 $1,137
Post-Tax IRR 16.6% 19.5% 15.2%
1. Includes transportation of concentrate
2. Based on $19,842/t ($9/lb) Ni, $26,455/t($12/lb) Co, $1,500/oz Pt, $750/oz Pd ; revised PFS is base case + trolley assist.
3. Based on price and exchange rate assumptions contained in “Key Assumptions” table found on slide 31 of this presentation
4. Average over 20 year-mine life. Over 33-year project life average annual EBITDA is $381 million per year and average annual cash flow is $228 million per year.
40 401 Billion Tonne Reserve
Mineral Reserve Statement, Dumont Nickel Project, Snowden, June 17, 2013
Grades Contained Metal
Category Quantity Ni Co Pd Pt Ni Co Pd Pt
(000 t) % Ni (ppm) (gpt) (gpt) Mlbs Mlbs 000 oz 000 oz
Proven 179,600 0.32 114 0.029 0.013 1,274 45 166 77
Probable 999,000 0.26 106 0.017 0.008 5,667 233 550 250
Total 1,178,600 0.27 107 0.019 0.009 6,942 278 716 328
Mineral Resource Statement (inclusive of mineral reserves), Dumont Nickel Project, SRK Consulting (Canada) Inc., April 30, 2013
Quantity Grade Contained Nickel Contained Cobalt
Resource Category
(000 t) Ni (%) Co (ppm) (000 t) (Mlbs) (000 t) (Mlbs)
Measured 372,100 0.28 112 1,050 2,310 40 92
Indicated 1,293,500 0.26 106 3,380 7,441 140 302
Measured + Indicated 1,665,600 0.27 107 4,430 9,750 180 394
Inferred 499,800 0.26 101 1,300 2,862 50 112
Quantity Grade Contained Palladium Contained Platinum
Resource Category
(000 t) Pd (gpt) Pt (gpt) (000s ounces) (000s ounces)
Measured 372,100 0.024 0.011 288 126
Indicated 1,293,500 0.017 0.008 720 335
Measured + Indicated 1,665,600 0.020 0.009 1,008 461
Inferred 499,800 0.014 0.006 220 92
Quantity Magnetite Contained Magnetite
Resource Category
(000 t) (%) (000 t) (Mlbs)
Measured
Indicated 1,114,300 4.27 47,580 104,905
Measured + Indicated 1,114,300 4.27 47,580 104,905
Inferred 832,000 4.02 33,430 73,702
Source: RNC technical report dated July 25, 2013, available on www.sedar.com. Mineral resources that are not mineral reserves do not have
demonstrated economic viability.
41Price Assumptions
Parameter 2015 2016 2017 Long Term
Nickel Price ($ per pound) $9.50 $10.00 $10.50 $9.00
Nickel Price ($ per tonne) $20,944 $22,046 $23,148 19,842
US$/CDN$ exchange rate $0.95 $0.95 $0.90 $0.90
Platinum Price ($ per ounce) $1,800 $1,800 $1,800 $1,800
Palladium Price ($ per ounce) $700 $700 $700 $700
Cobalt Price ($ per pound) $14 $14 $14 $14
Cobalt Price ($ per pound) $30,865 $30,865 $30,865 $30,865
Electricity (CDN$ per kilowatt hour) $0.0445 0.0445 $0.0445 $0.0445
Oil ($ per barrel) $90 $90 $90 $90
Note: Price assumptions for nickel, cobalt, platinum and palladium based on average forecasts for group of five institutions currently covering RNC where published
forecasts are available (4 of 5 analysts for long-term nickel price as of April 25, 2013). Oil price assumption based on Thomson Reuters’ analyst consensus estimates.
42Summary of Source Information
Project Source Price Assumptions Additional Comments
Au; Ag; Pd; Pt: $/oz,
Others $/lb
RNC Dumont Technical report dated, July 25, Long term Ni $9; Co $14; Pt All figures based on feasibility study highlights reported in news release.
2013 $1,800; Pd $700
Inmet, Basic engineering report, Cu $2.75; Au $1,250; All figures quoted directly from basic engineering report except NSR/revenue per tonne, calculated by
Cobre Panama May 2012 Mo $15.00; Ag $20 dividing total project NSR by total ore milled.
Quadra FNX, Technical report, Cu $2.50; Mo $12.00 All figures except NSR directly from technical report. NSR calculated using Table 23.23 by multiplying
Sierra Gorda June 8, 2011 Au $1,000 total payable metals X (base metal price assumptions less treatment charges for each metal outlined in
Section 23.4) divided by total ore milled. Site operating costs calculated as operating costs less transport
and port costs.
HudBay Minerals Technical report, Long term Cu $2.75; All figures quoted directly from technical report.
Constancia Oct. 15, 2012 Mo $14.00; Au $1,150;
Ag $23.00
Terrane, Mt. Milligan Technical report, Cu $2.00; Au $800; All figures quoted directly from technical report.
(Thompson Creek) October 23, 2009
Capstone, Technical Report, Cu $2.50; Magnetite All figures directly from technical report. Site operating costs calculated as operating costs less port
Santo Domingo Sep. 28, 2011 $1.00/dmtu Fe; Au $1,000 facility costs.
43Appendix 2
SPC Transaction
44High Priority Drill Targets Already Identified
Significant Geophysics Potential Remaining
Drill Targets &
Historic Drilling
Long Section
Howland Pit
AE-13: 0.20m @ 4.43%Ni, 6.95% Cu,
23.0g/t PGE’s
U9E-23: 30m @ 0.33% Ni, 1.3%Cu
Robinson Mine
U-806: 6.8m @ 1.6%Ni, 0.80% Cu
AE-1B: 2.34m @ 1.63%Ni, 0.70%Cu
U9E-2: 28.65m @1.46%Ni, 0.60% Cu
W03-03AW1: 8.90m @ 1.46%Ni, 0.56%Cu
Rosen Mine
U-610: 7.3m @ 1.0%Ni, 1.74% Cu
W03-05: 1.0m @ 2.73%Ni, 0.35%Cu
AE-07: 2.0m @ 1.2%Ni, 0.83%Cu
AE-07A: 8.1m @ 0.30%Ni, 1.2%Cu
Source: Sudbury Platinum Corp
45SPC Management Team - Significant Sudbury Experience
and Track Record of Discoveries
Scott McLean | Chairman & CEO - B.Sc. P.Geo.
23 years with Falconbridge/Xstrata (Responsible for the # Year Deposit Resources (t) Status
Sudbury Exploration Investment)
10 years exploration in Sudbury Basin, responsible for 100k 1 1994 Onaping Depth 17,000,000 Study (deep)
m drilling/yr & 20-25 employees
2004 PDAC Prospector of Year (Nickel Rim South) 2 1995 Norman West 7,500,000 Idle (deep)
Past president of APGO (Association of Professional
Geoscientists of Ontario) 3 1997 Creighton West 10,000,000 Idle (deep)
Grant Mourre | President & COO- M.Sc., P.Geo. 4 1997 Fraser Morgan 8,000,000 Development
14 years minerals exploration within NA focused primarily
on Ni-Cu-PGE’s. 5 2001 Nickel Rim South 17,400,000 Production
7 years with Falconbridge/Xstrata & Inco in Sudbury Basin
6 2001 Beeper 3,904 Idle
10 years deep drilling in the Sudbury Basin
Masters thesis funded by Inco (Vale) & NSERC on Copper
7 2001 Roland Lake 500,000 Idle
Cliff offset dyke
8 2002 Rapid River 70,000 Idle
Kevin Stevens | Chief Geophysicist - M.Sc. P.Geo.
27 years mineral exploration and research geophysics 9 2003 Bowell Open Pit 363,000 Idle
12 years as Falconbridge Principal Geophysicist in the
Sudbury Basin 10 2004 Capre Lake South 580,000 Idle
2004 PDAC Prospector of Year (Nickel Rim South)
Geophysics (EM modeling) expert 11 2006 Onaping-Craig Corner 250,000 Depleted
Developed key geophysics techniques for sulphide
detection at depth (3D EM and Radio-Imaging) 12 2007 Onaping 2 Zone 80,000 Depleted
Total Ni Discovered 61.7 million
2004 Prospector of the Year
Nickel Rim South Mine
Source: Sudbury Platinum Corp.
46Notes
47Corporate Overview
Share Structure:
Basic Shares Outstanding1: 94.4 million
Options (average exercise price: C$0.67) 8.9 million
Deferred/Restricted Share Units 2.1 million
Contingent Shares 7.0 million
Fully Diluted Shares Outstanding: 112.4 million
Directors and Officers Share Ownership: ~9%
Largest Shareholder –
RAB Special Situations (Master) Fund Limited: ~17%
Balance Sheet Highlights2:
Cash and Cash Equivalents: C$9.7 million
Current Tax Receivable: C$2.1 million
Working Capital: C$10.2 million
Market Capitalization: C$66 million
1. Shares outstanding, fully diluted shares outstanding and shareholdings as at May 8, 2014
2. Balance sheet highlights as at March 31, 2014; market capitalization at May 8, 2014
www.royalnickel.com 48You can also read