Investor Presentation - Kimco ...

Page created by Ruth Martin
 
CONTINUE READING
Investor Presentation - Kimco ...
Investor Presentation

                Timonium Square
                  Timonium, MD
Investor Presentation - Kimco ...
Safe Harbor
The statements in this presentation, including targets and assumptions, state the Company’s and management’s hopes, intentions, beliefs, expectations
or projections of the future and are forward-looking statements. It is important to note that the Company’s actual results could differ materially from
those projected in such forward-looking statements. Factors that could cause actual results to differ materially from current expectations include the
key assumptions contained with this presentation, general economic conditions, local real estate conditions, increases in interest rates, foreign
currency exchange rates, increases in operating costs and real estate taxes. Additional information concerning factors that could cause actual results
to differ materially from those forward-looking statements is contained from time to time in the Company’s SEC filings, including but not limited to
the Company’s report on Form 10-K. Copies of each filing may be obtained from the Company or the SEC.

                                                                                                                                                   Mesa Riverview
                                                                                                                                                        Mesa, AZ
Investor Presentation - Kimco ...
North America’s Largest Owner & Operator of
Neighborhood & Community Shopping Centers

                                              Redhawk Towne Center
                                                      Temecula, CA
Investor Presentation - Kimco ...
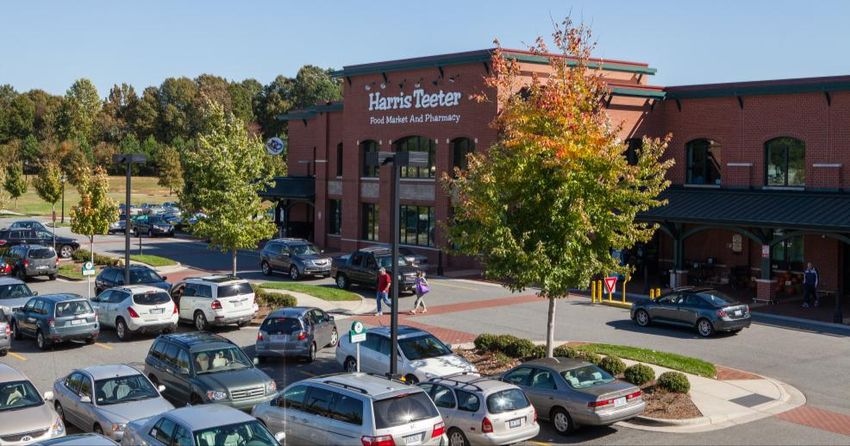
History                      Started in 1958 | IPO that initiated Modern REIT Era;
                             NYSE-listed (1991) | S&P 500 Index (2006)
Dividend                     $0.84 annually, ~4% yield
Shopping Center Properties   896 properties; 131.3M Square Feet
Geographic Footprint         44 states, Puerto Rico, Canada, Mexico and South America
Occupancy (pro-rata)         Current: 93.8% / All-time high: 96.3% (12/31/07)
Enterprise Value             $13.2B
Credit Rating                Investment Grade  BBB+ | BBB+ | Baa1 (S&P | Fitch | Moody’s)

                                                                                     Information as of December 31, 2012

                                                                                                                           4
Investor Presentation - Kimco ...
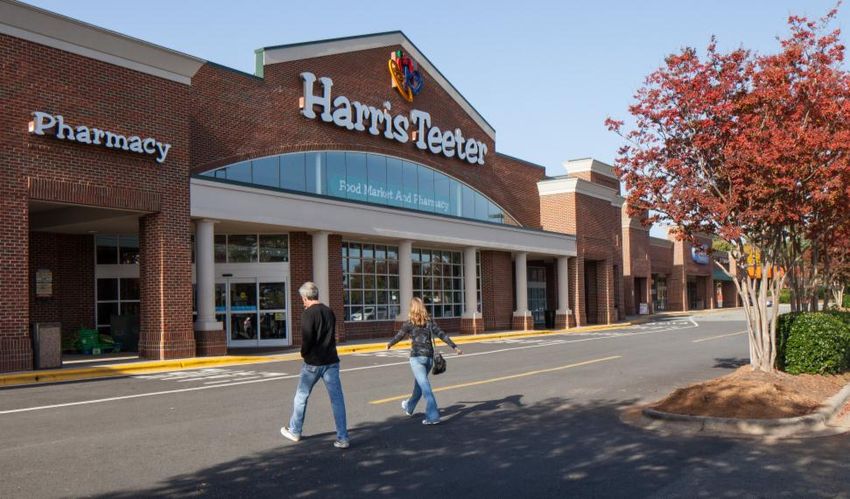
Total Return Analysis

                                 Since IPO                                                                            One Year Period
14%               13.3%                                                                       20%
                                                                                                                  18.5%
                                                                                              18%
                                11.7%                                                                                                                        16.8%
12%
                                                                                              16%                               15.0%
                                               10.3%
10%                                                                                           14%
                                                              8.9%                                                                            12.7%
                                                                                              12%
8%
                                                                                              10%
6%
                                                                                                8%

4%                                                                                              6%

                                                                                                4%
2%
                                                                                                2%

0%                                                                                              0%

          KIM        NAREIT Equity Index               DJIA          S&P 500                             KIM        NAREIT Equity Index                DJIA        S&P 500

$100,000 invested in Kimco at IPO would be $1.3M today                                        Kimco outperforms major indices over a one-year period

Source: Bloomberg
*Total return on investment including reinvestment of dividends through Jan. 31, 2013. Statistics for return since IPO are based on closing prices as of Nov. 30, 1991.

                                                                                                                                                                             5
Investor Presentation - Kimco ...
Strategy: The Premier Owner and Operator of Quality Shopping Centers

    We’ve established a strong foundation that ensures safe and growing cash flows.

                                                                                      6
Investor Presentation - Kimco ...
The Case for Retail Real Estate: Today’s Market

Healthier Retailers/ Retail Real Estate                              Sales of Durable Goods3

•   Strong balance sheets

•   Right-sizing of store size & relocating low-
    performing stores

•   January same-store sales increased by 3.6%1

•   More than 81,000 store openings scheduled over
    the next two years2

•   Discounters and drug stores are increasing their                Retail Supply Remains Low3
    foot print in terms of square footage and store
    count3

•   Sales of durable goods is on the rise3

•   Virtually no ground up development
       Supply being absorbed: Kimco’s spaces
          greater than 10,000 sq. ft. are 96.9%
          occupied

                                             1Bank of America Merrill Lynch, “January Sales Strong” February 2013.
                                             2 RBC Capital Markets, “Retail REITs: February National Retailer Demand Monthly (NRDM)” February 2013.
                                             3CoStar Group. “The State of Commercial Real Estate Industry: 2012 Retail Review & Outlook” 2013.

                                                                                                                                                      7
Investor Presentation - Kimco ...
The Case for Retail Real Estate: Historical Perspective

                       Neighborhood Shopping Center Sector Occupancy

96.0%
                                                                                        Average
                                                                                       Occupancy
94.0%                                                                                    92.2%

92.0%

90.0%

88.0%

86.0%

84.0%

82.0%

                 Neighborhood Shopping Centers occupancy rate was at an all-time low
        in the second quarter of 1992 at 88.7% and highest in the fourth quarter of 2000 at 95.7%

                                                                                                   Source: NCREIF

                                                                                                                    8
Investor Presentation - Kimco ...
North American Footprint of Quality Assets

                         Faubourg Boisbriand                                  Long Gate S.C.                                            Magnocentro 26
                 Boisbriand, Quebec, Canada                                 Ellicott City, MD                                          Huixquilucan, EM

           Canada                                     United States                                                 Mexico

•   66 centers                                 •   759 centers                                   •      56 centers
•   12.4M sq. ft.                              •   106.2M sq. ft.                                •      11.9M sq. ft.
•   $15.98 per sq. ft.                         •   $13.18 per sq. ft.                            •      $9.97 per sq. ft.
•   96.7% occupancy                            •   94.1% occupancy                               •      89.7% occupancy
•   Top tenants:                               •   Top tenants:                                  •      Top tenants:
      TJ Maxx                                       TJ Maxx                                             Wal-Mart
      Canadian Tire                                 Home Depot                                          Cinepolis
      Target                                        Wal-Mart                                            HEB

                                                            Note: Amounts are shown on gross basis. Centers & square footage include properties not in
                                                                  occupancy. Information as of December 31, 2012.

                                                                                                                                                          9
Investor Presentation - Kimco ...
U.S. Overview

        2013 Economic Outlook                                 Centereach Mall                                     Retailer Trends
                                                              Centereach, NY
 •    Projected GDP Growth: 2.0% -3.2%                                                               •   Increase in store count:

 •    Forecast inflation rate: 1.3%-2.0%

 •    Federal Reserve committed to
      keeping short term interest rates near
      zero until unemployment drops

 •    Average unemployment rate: 6.9%-
      7.8%

Source: Economic Projections from FOMC Meeting, Dec. 2012.

                                                         Tenant Exposure by Annualized Base Rent
        3.0%          2.7%
                                      2.4%

        2.0%                                           1.8%
                                                                   1.6%         1.6%   1.5%   1.4%
                                                                                                           1.2%         1.2%        1.2%
        1.0%

        0.0%

                                                                                                                                           10
Canada Overview
                                                     Canada Remains Key Element of International Portfolio
        2013 Economic Outlook                                            Strawberry Hill S.C.
                                                                         Surrey, BC
                                                                                                                                 Retailer Trends
•     Projected GDP Growth: 1.7%                                                                                     •   Target will open its first Canadian store
                                                                                                                         at a RioKim property. Kimco portfolio
•     Forecast inflation rate: 1.4%                                                                                      will include 9 Target stores opening
                                                                                                                         2013 - 2014.
•     Bank of Canada overnight lending rate                                                                          •   Retailer Expansion:
      to remain at 1.0%

•     Average unemployment rate: 7.1%

•     Exchange rate: $1.009 US$/CAD$                                                                                 •   New Entrants include:

Source: Bank of Montreal,“Canadian Economic Outlook” February 2013.

                                                                      Tenant Exposure by Annualized Base Rent
                         4.8%
         5.0%
                                           3.8%
         4.0%
                                                              3.0%            2.9%
         3.0%                                                                                   2.6%   2.4%   2.3%       2.3%        2.2%         2.0%
         2.0%

         1.0%

         0.0%

                                  Approximately 28% of Canadian Annual Base Rent is Diversified Across Top 10 Tenants
                                            High Quality Domestic and International Retailer Relationships                                                           11
Mexico Overview
          2013 Economic Outlook                                       Multiplaza Arboledas                                           Retailer Trends
                                                                      Tlanepantla, Mexico
• Projected GDP Growth: 3.7%                                                                                             • Recently opened stores:
• Forecast inflation rate: 3.9%
• Average unemployment rate: 5%
• Exchange rate: forecast to range between
  12.70/USD-13.20/USD                                                                                                    • Looking to become an active brand in
                                                                                                                           Mexico:
• New capital markets activities creating
  liquidity and improving valuation
      • FIBRA IPO Structures
      • Mexico pension rules allowing for                                                                                • Active Expansion:
          investment in domestic REITs
      • Renewed interest from U.S. and
          Canadian institutions and funds
Source:
Economic Intelligence Unit, “Country Report: Mexico” November 2012.
Banco De México, “Inflation Report: July through September 2012”

Tijuana                                                                                                               Investment Drivers
                                                                                             • Favorable Demographics
                                                                                                   12th largest global economy; projected to be 5th largest by 2050
                                                                                                   115M people expected to grow 1.2% annually; median age of 26
                                                                                                   Expanding middle class
                                                                                             • Limited Supply
                                                                                                   Mexico under retailed  ~3.9 sq. ft. per capita vs. U.S. 23 sq. ft.
                                                        Monterrey                                  ~800 shopping centers; heavily concentrated in large urban areas
                                                                                                     (vs. 110k in U.S.)
                                                                                             • Opportunistic Returns
                                                                                    Cancun         Attractive returns compared to U.S; Targeting 10–12% stabilized
                                        Guadalajara                                                  NOI yield on cost in Mexico
                                                      Mexico City                                  All leases include annual cost of living adjustments
                                                                                                   Percentage rent clauses in many leases provide additional upside
   Kimco Shopping Centers

                                                                                                                                                                      12
Why Kimco?

                                       Resilient Portfolio
                               • Geographically diversified with a
                                 national platform
                               • Redevelopment program
                               • Consistent retail cash flow growth

      Solid Tenant Mix                                                   Necessity vs. Specialty
• Credit quality                                                      • Well-balanced between
• Low single tenant exposure                                            grocery vs. big box
                               Approximately 14,900 leases
                                   with 8,400 tenants

         Stability                                                            Growth

                                                                                                   13
Stability Driven by Diversification Across Many Regions

                         Geographic Diversification of Our Rents

                                                                                              Number       Square
                                                                                                 of         Feet
                                                                          Location           Properties (in millions)         ABR
                               MSA 6-10                         California                       109            18.7         13.1%
                                12.3%
                                                                Florida                           77            10.7          8.8%
         MSA 1-5
          20.5%                                                 New York                          60             6.4          8.0%
                                              MSA 11-30
                                                23.2%           Texas                             52             8.0          4.9%
                                                                Pennsylvania                      45             5.0          4.7%
                                                                New Jersey                        28             4.3          4.1%
Canada
10.4%                                                           All Other U.S.                   381            50.9         35.9%
                                               Puerto Rico
                                                  3.3%          Puerto Rico                        7             2.2          3.3%
Latin America
     6.8%                                                                 Subtotal U.S.          759           106.2         82.8%
                                  All Other                     Latin America                     71            12.7          6.8%
                                   23.5%
                                                                Canada                            66            12.4         10.4%
                                                                                Subtotal
                                                                                                 137            25.1         17.2%
                                                                           International
                                                                        Total Shopping
                                                                                                 896           131.3        100.0%
                                                                               Centers

                                                             *Percentages are calculated using annualized base rent as of 12/31/12.
                                                             ** Includes properties not in occupancy

                                                                                                                                      14
Tenant Overview

Only 14 tenants with rent exposure greater than one percent

                                                                                                   Rating
                                                   3.0%                   Company
                                                                                                S&P/ Moody’s
                                                 2.9%
                                                                 Home Depot                          A-/A3
                                         2.6%                    TJX Companies                       A/A3

                            2.0%                                 Wal-Mart                          AA/Aa2

                     1.7%                                        Kmart/Sears Holdings             CCC+/B3

                                                                 Bed Bath & Beyond                BBB+/NR
                 1.6%
                              Approx. 14,900 leases              Royal Ahold                      BBB/Baa3
                1.5%           with 8,400 tenants
                                                                 Kohl’s                           BBB+/Baa1
                1.5%
                                                                 Best Buy                          BB/Baa2
              1.4%                                               Petsmart                          BB+/NR
         1.2%                                                    Costco                             A+/A1
                Well staggered lease maturity with limited
         1.2%    rollover in any given year that averages        Ross Stores                      BBB+//NR
                    about 8% over the next 10 years.
                                                                 Safeway                          BBB/Baa3
         1.2%
                                                                 Michaels                            B/B2
         1.2%
                                                                 Dollar Tree                        NR/NR
       1.1%

     Solid tenant mix with good credit quality tenants
                                                * Percentages are calculated using annualized base rent as of 12/31/12.

                                                                                                                      15
Retailer Base: Low Exposure to Internet

      Portfolio Composition by ABR                       Steps to Address Internet Exposure
                                                  •   Own Quality Real Estate:
Approx. 92% of Portfolio is Internet Resistant           Dispose marginal assets
                                                         Acquire centers with low risk retailers

                            92%                   •   Quality Retailers:
                                                         Essential use, food, personal service, and
                                                            unique/boutique tenancies
                                                         Bias for dominant players who will be the winners
                                                            in capitalizing on multi-channel strategies

              2% 1% 2%                            •   Use Social Media
                            3%
                                                         Align programs with national retailers
     Necessity Based, Discount Goods & Services          Support small tenants
     Computers & Electronic Appliances
                                                         Kimco social media sites:

     Office Supplies                                            blog.kimcorealty.com
                                                                www.facebook.com/KimcoRealty
     Books & Video Stores                                       www.twitter.com/kimcorealty
     Hobby, Toys & Game Stores

                                                                                                              16
U.S. Shopping Center Portfolio

                                                        17
                                 Westlake Shopping Center
                                            Daly City, CA
National Breath/Regional Depth- Experienced Management Team
Conor Flynn, President                      Rob Nadler, President                         Tom Simmons, President                           Paul Puma, President
Western Region                              Central Region                                        Eastern Region                               Southern Region
192 Properties                              167 Properties                                        258 Properties                                 142 Properties
GLA: 31.8M sq. ft.                          GLA: 23.7M sq. ft.                                  GLA: 28.0M sq. ft.                           GLA: 22.7M sq. ft.
Occupancy: 92.2 %                           Occupancy: 95.5%                                    Occupancy: 95.8%                             Occupancy: 93.1%

                  Regional Presidents build portfolio value with:
                   •     Experience: average 25 years in retail real estate   •   Strong relationship network
                   •     Local market expertise                                      •    Knowledge of buyers/sellers
                            •    Consumer preferences & trends                       •    Direct-market transaction opportunities
                            •    Market-specific risk assessment                     •    Smoother approval process with local officials
                            •    Acquisitions & redevelopment opportunities

                                                           Localized Operating Approach
                                                                                                                      Note: GLA and occupancy shown on gross basis.
                                                                                                                                                                  18
U.S. Shopping Center Portfolio Profile

                          Local Small Shops (< 5K sq. ft.): 7% of GLA
                                                                                        13%
                                                                                                                          G
                                                                                        14%                               R
                                                                                                                          O
                National Small Shops (< 5K sq. ft.): 7% of GLA                                                            W
                                                                                        11%                               T
                                                                                                                          H

                                                                                                                          ABR
                                                                                                                          (%)
            Mid Tier Stores (5K – 10K sq. ft.): 8% of GLA
                                                                                                                               S
                                                                                                                               T
                                                                                        62%                                    A
                                                                                                                               B
                                                                                                                               I
         Anchors (> 10K sq. ft.): 78% of GLA
                                                                                                                               L
                                                                                                                               I
                                                                                                                               T
                                                                                                                               Y
                                                        Anchors   Mid Tier Stores   National Small Shops   Local Small Shops

•   Portfolio is well balanced between Power Centers and Neighborhood & Community Centers
•   57% of portfolio has grocery or food component

                                                                                                                                   19
Active Portfolio Management

             What we are Selling                                                        What we are Buying
• Located in secondary/tertiary markets                               •   Grocery or national big box anchored centers

• Limited growth potential                                            •   Emphasis on strong tenancy and rollover
                                                             Invest   •   Largest MSAs: Higher CAGR, Barriers-to-entry,
• Stubborn vacancy                                           $$$$         Value creation through redevelopment, strong
• Initiated asset recycling program in Sept. 2010                         demographics & growth estimates
       Sold 108 shopping centers for approx.
                                                                      •   Acquired 59 shopping centers for approx. $1.3B
          $825.3M
                                                                          since Sept. 2010

                                                                                                          Acquired         Disposed
                                                                                                                                             Variance
                                                                                                           Sites*            Sites
                                                                      Number of Sites                        59              108              -45.4%
                                                                      Gross GLA (000’s)                     7,512            10,854           -30.8%
                                                                      Gross Occupancy %                     95.8%            85.1%            10.7%
                                                                      Pro-rata ABR per sq. ft.             $13.92             $8.75           59.2%
                                                                      Average Household Income             $88,935          $65,328           36.1%
                                                                      Median Household Income              $74,390          $58,458           27.3%
                                                                      Estimated Population                  91,621           76,329            20.0%
                                                                      Household Density                      1,273            1,064            19.6%
                                      Mountain Island Marketplace                     * Includes transfers from joint ventures to consolidated portfolio.
                                      Charlotte , NC                                 Note: Statistics provided from Sept. 2010 through Dec. 31, 2012.

                                                                                                                                                            20
Growth in Small Shop Lease-Up

Fast Track Franchise Program                     KEYS Program                                    Portfolio Review
•   Franchisors pre-approve Kimco                •   Business incubator program for              •   Kimco offers current & prospective
    locations                                        qualified startup entrepreneurs initiated       tenants an extensive custom tailored
                                                     in April 2012 in California                     portfolio review, identifying Kimco
•   Kimco then markets to prospective
                                                                                                     properties that suits their needs
    franchisees                                  •   Participant benefits:
                                                        One year of free rent                   •   Provides tenants a comprehensive
•   Utilize program website
                                                        Affordable property charges                 overview of target market sites
    (www.fasttrackfranchise.com), signage,
                                                             (NNN) to minimize initial
    blog posting, & franchise industry events                                                    •   Resources include pad/outparcel
                                                             overhead
    as marketing tools                                                                               database, demographic reporting, co-
                                                        Access to personal Kimco retail
                                                             business counselors                     tenant preference reporting, and
•   More than 20 chains are currently
                                                        A flexible four-year lease option           grocery anchor sales ranking searches
    signed up
                                                             after the first year
                                                        Access to shop space in                 •   Conducted 63 portfolio reviews to date
                                                             established retail centers              in 2012 that resulted in 81 fully
                                                                                                     executed leases
                                                 •   Prospecting candidates through colleges,
                                                     Small Business Administration (SBA)
                                                     Programs, & local chambers of
                                                     commerce

                                            Since fourth quarter of 2011, small shop occupancy has
                                                         increased by 170 basis points

                                                                                                                                             21
Redevelopment: Increasing Portfolio Value

                                                                                                                                  Investment Incremental
Property Name               City               State                                Opportunity
                                                                                                                                     ($M)          NOI ($M)
Projects estimated completion in 2013
                                                       Demolish existing Value City and build new BJs Wholesale & Fuel
Elsmere Square               Elsmere           DE                                                                                            4.2          0.6
                                                       Island
Richmond S.C.                Staten Island     NY      Redevelop existing Kmart for new Target & Miller’s Ale House                          3.9          2.5

Springfield S.C.             Springfield        PA     Demolished Value City & built new Giant Food; adding an outparcel                    12.4          1.3

Lake Prairie Town Crossing Grand Prairie       TX      Construction of Party City, Five Below, and Rue 21                                    3.6          0.4

Metro Crossing              Council Bluffs      IA     Construction of TJX & Ulta; Multi-tenant building w/ Panera Bread                    13.5          1.5
                                                       Construction of multi-tenant building with Five Below, Maurices &
Maple Hill                  Kalamazoo           MI                                                                                           3.3          0.3
                                                       CATO
                                                                                                             Subtotal for 2013          $40.9            $6.6
Projects estimated completion in 2014 and thereafter
                                                       Demolish former National Wholesale Liquidators; Construct a new
Forest Avenue S.C.         Staten Island       NY                                                                                            7.6          0.8
                                                       Stop & Shop
Miller Road                Miami                FL     Demolish & rebuild of existing Publix & in-line Walgreens                             2.7          0.3

Cupertino Village         Cupertino            CA      Construct 24K SF of new retail space                                                 15.9          1.0
                                                       Former K-mart demolished with Office Max relocating/downsizing along
Fairview City Centre      Fairview Heights      IL                                                                                          22.4          2.4
                                                       with new Best Buy and Sports Authority
Pompano Beach              Pompano Beach        FL     Demolish anchor space to build Whole Foods & Sports Authority                        10.9          1.1

Wilde Lake                 Columbia            MD      Residential & retail redevelopment including vacant anchor                           16.9          1.4

                                                                                                 Subtotal for 2014 & thereafter         $76.4             $7
                                                           Average Return:
Grand Total                                                                                                                            $117.3           $13.6
                                                                12%

                                                                                                                                                                22
Redevelopment: Increasing Portfolio Value

                                               Future Redevelopment Projects

                                              Center Name                City              State

                                      Cupertino Village          Cupertino                 CA

                                      Owings Mills Mall          Owings Mill               MD

                                      Camden Square              Dover                     DE

                                      Promenade at Christiana    New Castle                DE

                                      Tri-City Plaza             Largo                      FL

                                      Palm Beach Gardens         West Palm Beach            FL

                                      Renaissance Centre         Altamonte Springs          FL

                                      Airport Plaza              Farmingdale               NY

                                      Manhasset Center           Manhasset                 NY

                      Westlake S.C.   Additional outlot opportunities: $22.5M investment
                      Daly City, CA   resulting in $5.6M incremental NOI

 Redevelopment Yield Range:              Estimated spending of approximately $250M
          8%-16%

                                                                                                   23
Recent U.S. Acquisition Profile

                               Wilton Campus Shops in Wilton, Connecticut
GLA: 97,000 square feet
Anchor Tenants: Stop & Shop
Occupancy: 100%
Rent Per Sq. Ft.: $30.03
Demographics:
Total Population: 21,465
Avg. HH Income: $241,486
Med. HH Income: $207,457

                                     Savi Ranch in Yorba Linda, California
GLA: 161,000
Anchor Tenants: Dick’s Sporting Goods, Bed Bath
& Beyond, Michaels
Occupancy: 100%
Rent Per Sq. Ft.: $15.11
Demographics:
Total Population: 61,263
Avg. HH Income: $150,071
Med. HH Income: $138,498

                                                                             24
Recent U.S. Acquisition Profile

                               Davidson Commons in Davidson, North Carolina
GLA: 79,000 square feet
Anchor Tenant: Harris Teeter
Occupancy: 97.1%
Rent Per Sq. Ft.: $14.98
Demographics:
Total Population: 29,157
Avg. HH Income: $114,506
Med. HH Income: $95,636

                                    Devon Village in Devon, Pennsylvania
GLA: 69,000 square feet

Occupancy: 100%
Rent Per Sq. Ft.: $31.49
Anchor Tenant: Whole Foods Market
Demographics:
Total Population: 48,741
Avg. HH Income: $152,318
Med. HH Income: $109,341

                                                                              25
Joint Venture Platform

          Portfolio Overview                              JV Consolidation Activity                                           Opportunity
•   270 properties totaling 40.8M gross sq.                                          JVs Transfers to           •   Kimco’s Acquisition Opportunity: buying
    ft. with gross occupancy of 94.6%                                                Wholly-Owned                   partner’s interest in well known
                                                                                                                    properties on an off-market negotiated
                                                    Number of Sites                          10
•   14 different co-investment programs                                                                             basis.
                                                    Gross Price                            $395M
•   24 institutional partners                       Gross GLA (000’s)                       1,920               •   Structure enhances ROE through long-
                                                                                                                    term, recurring asset and property
                                                    Gross Occupancy %                      97.9%
•   $10.1B in assets under management                                                                               management fees
        Provides recurring fee income of           Pro-rata ABR/sq. ft.                   $14.35
           $37.5M annually                                                                                      •   Additional source of capital to acquire
                                                    Note: Statistics provided from 2012 through January 2013.       high-quality retail properties

                                       Partner Buyouts- Quality Play with Long Term Growth
•   Towson Marketplace in Towson, MD: 70% partner buyout
       Fully-occupied 680,000 sq. ft. power center anchored by Weis Markets, Wal-Mart, Target, Babies ‘R’ Us, Sports Authority, Bed Bath &
       Beyond, Marshalls, TJ Maxx, PetSmart, DSW Shoe Warehouse and Michaels located in Baltimore-Towson MSA serves a population of
       140,000 in 3-mile radius

•    Santee Trolley Square in Santee, CA: 55% partner buyout
       311,000 sq. ft. power center anchored by TJ Maxx, PetSmart, Party City, Bed Bath & Beyond, 24 Hour Fitness and Old Navy located in San
       Diego-Carlsbad-San Marcos MSA serves a population of 103,000 in 3-mile radius

•   Shops at Kildeer: Kildeer, IL: 81% partner buyout
       168,000 sq. ft. center anchored by Bed Bath & Beyond, Michaels, Old Navy, Cost Plus and Ulta located in Chicago-Joliet-Naperville MSA
       with an average household income of $109,000 in 3-mile radius

•   Putty Hill Plaza in Baltimore, MD: 89.4% partner buyout
       91,000 sq. ft. center grocery anchored by Giant Food in Baltimore-Towson MSA serves a population of 135,133 in 3-mile radius

                                                                                                                                                              26
CORPORATE RESPONSIBILITY PROGRAM
     RETHINK Business • RENEW Community • RESTORE Environment

Program Overview
Objective:
Improve Kimco’s economic, social & environmental performance through
a series of initiatives that enhance tenant satisfaction, reduce operating
expenses, mitigate business risks, & generate new sources of income.

Key Initiatives:
 •   Utility Management                    •   KimCares
 •   Lighting and Irrigation Efficiency    •   KEYS
 •   Integrated Waste Management           •   FastTRACK Franchise
                                                                                                                     Westlake Shopping Center
 •   Tenant Energy Services                •   Redevelopment                                                         Daly City, CA

North Brunswick Plaza                                                        Additional Information/Resources
North Brunswick, NJ

                                                                              • NAREIT leader in The Light Group
                                                                              • Participates in Global Real Estate Sustainability
                                                                                 Benchmark (GRESB) & Carbon Disclosure Project (CDP)
                                                                              • CR Web Portal: www.KimcoCR.com
                                                                              • Kimco Blog: blog.kimcorealty.com
                                                                              • Twitter: twitter.com/KimcoCR
                                                                              • Email: CorporateResponsibility@kimcorealty.com

                                                                                                                                                27
Direct to Retail Investment Opportunities

                                            Alamosa Plaza
                                            Las Vegas, NV
Key Differentiator: Strong Retailer Relationships
                                      Ability to Act Opportunistically with Retailer-Controlled Real Estate…

•      Current economic environment coupled with strong retail relationships should continue to yield profitable investment opportunities.

•      Decades of retail property experience and financial acumen resulting in solid track record of unlocking real estate value for retailers.

•      Remain focused on working directly with retailers on:
          Sale leasebacks
          Bankruptcy transactions
          Acquire and reposition underperforming retail locations
          Retail real estate financing

•      In January, Kimco announced its participation in the consortium to acquire five grocery banners totaling 877 locations from SUPERVALU
       INC. (NYSE: SVU). The company will contribute up to $76.5 million as its investment & hold approx. 15% interest in the consortium.

                                                                       (Designation                              (Designation                                                       (Real Estate Financing)
(Acquire/Release              (Acquire/Release to tenants)                                                         Rights)                           (Privatization)
                                                                         Rights)
   to tenants)
                                                                                          (Bond Purchase)

                                                                                                                                                                                                    (consortium to acquire
                                               (Acquire/Release to tenants)                                                     (Real Estate Financing)           (Real Estate Financing)
                                                                                       (Real Estate Financing/                                                                                       five grocery banners)
                                                                                        Designation Rights)

                (Acquire 60 leases)             (Acquire/Sale Leasebacks)                                                        (Acquire/Reposition)
                                                                                                                                                                   (Real Estate Financing)             (Sale Leasebacks)
                                                                                   (Acquire/Real Estate Financing)

    Pre -1991          1995              1997                1998           2001               2002                 2003               2005               2006            2007               2008             2013

                                                               …Has Led To Long History of Value Creation

                                                                                                                                                                                                                             29
Financial Highlights & Strategy

                                  Hamden Mart
                                   Hamden, CT
Capital and Balance Sheet Strategy

Timonium Square
Timonium, MD

     •    Growing free cash flow (after common dividends) for investment and debt reduction

     •     Maintain strong balance sheet metrics
             Net Debt to EBITDA, as adjusted: 5.5x – 6.0x
             Improving fixed charge coverage

     •     Maintain a strong liquidity position – $1.5B available of unsecured line of credit

     •     Large unencumbered asset pool – Repay existing secured debt of over $400M through 2015

     •     Maintain investment grade ratings

     •     Active portfolio management

                                                                                                    31
Strong Balance Sheet Strength

                                                   Solid Improvement since 2008
                                            12/31/08        12/31/11     12/31/12     Improved         Consolidated Market Cap: $13.2B*

Gross Assets                                 $10.6B         $11.3B       $11.5B                    8% Mortgage Debt

Unencumbered Assets (416 properties*)        $8.7B           $9.2B        $9.6B                         7% Preferred Stock
                                                                                                              1% Non-controlling
                                                                                                                   Ownership Interests
Debt / Gross Assets                          43.2%           36.4%        36.5%             
Debt/ Total Market Cap (Book)                0.53 : 1       0.46 : 1      0.46:1            
Debt / Equity (Book)                         1.12 : 1       0.84 : 1      0.85:1            
Net Debt /EBITDA, as adjusted                 8.3x            6.2x           5.7x           
Debt Service Coverage                         3.1x            3.4x           3.5x           
Fixed Charge Coverage                         2.6x            2.7x           2.8x           
FFO Payout Ratio                             77.7%           56.7%        61.3%                     24% Unsecured Debt
                                                                                                                60% Market Equity Shares

Investment Grade Ratings:
                                •   S&P: BBB+        •   Moody’s: Baa1   •    Fitch: BBB+

                                Raised over $2.0 billion in capital during 2012 at a significantly lower cost

                                                                                                                               *As of 12/31/12
                            Strong balance sheet ensures ready access to capital markets

                                                                                                                                            32
Well Staggered Debt Maturity Profile

                                                              Consolidated Debt
                       900                                     21%
                                                      19%                                                  Weighted Avg. Fixed Rate: 5.79%
                       800
                       700                                                                              Weighted Avg. Floating Rate: 1.56%
                             15%
Debt in Millions

                       600
                       500          12%    11%                          12%

                       400
                                                                                  7%
                       300
                       200
                       100                                                                                                              2%
                                                                                               1%            0%            0%
                         0
                             2013   2014   2015       2016     2017     2018     2019         2020         2021          2022       Thereafter
                                     Secured      Unsecured    Revolving Credit Facility        Term Loan

                                                      Kimco Share Joint Venture Debt
                       700
                                                                23%                                        Weighted Avg. Fixed Rate: 5.52%
                       600                                                                               Weighted Avg. Floating Rate: 2.37%
                                           18%        18%
                       500
    Debt in Millions

                       400

                       300   10%
                                    8%                                                                                      7%
                       200                                                                                    7%

                       100                                               3%       2%                                                      2%
                                                                                                2%
                        0
                             2013   2014   2015       2016     2017     2018     2019          2020          2021         2022       Thereafter
                                                              Secured    Unsecured
                                                                               Note: Percentages represent what is maturing as a % of the total debt stack
                                                                                                                                                             33
EBITDA Composition

      Retail Shopping Center Flows Grow from 83% in 2008 to Projected 100% in 2014

Where We Were  2008             Where We Are  2012            Where We Are Going  2014

Shopping Centers 83%             Shopping Centers 96%               Shopping Centers 100%

  Non-retail Investments 17%        Non-retail Investments 4%   All EBITDA contributions generated
                                                                 from retail shopping center flows.

                                                                                                      34
Recurring Retail Earnings Growth

                $1,200

                                                            $1,030
                                               $995                                                                                              $1010-$1044
                $1,000                                                                                                  $975
                                                                                                          $934                      $945-$978
                                                                                          $903
                                                                            $840
                                $815
                 $800

                         $667
$ in Millions

                 $600
                                                                                                                                                     $1010
                                                                                                                                       $930            -
                                                                                                                        $914             -           $1040
                                                                                                         $860                          $957
                 $400                                         $786                        $814
                                                                             $769
                                               $716
                                $653
                         $541
                 $200

                    $-
                         2005   2006           2007           2008           2009          2010           2011          2012           2013*          2016*
                                                       Recurring Retail      Recurring Non-Retail      Non-Recurring                                   * Forecasted

• Consistently growing recurring retail earnings – 2012 grew by 6.3%                • Eleven consecutive quarters of positive same-site NOI
• More than 97% of recurring earnings contribution in 2013 will be from retail      • 4Q12 gross occupancy of 94.0%, an increase of 70 basis points over 4Q11
• Recurring retail earnings have a CAGR of 6% from 2009 to 2012                     • 2,678 new leases, renewals & options totaling 10.0 M sq. ft. executed in 2012

                                                                                                                                                                      35
2013 Funds From Operations (FFO) Guidance

                                                                         FFO ($ in millions)                       FFO $/Diluted Share
                                                                     2012A                  2013F               2012A               2013F
Recurring:
 Retail                                                                      $ 914      $ 930 —     $ 957          $ 2.23      $ 2.26 —      $ 2.33
    Non-Retail                                                                  40         15 —        21            0.10        0.04 —         0.05
    Financing Costs                                                          (299)      (278) —     (283)          (0.73)      (0.68) —      ( 0.69)
    G&A                                                                      (122)      (122) —     (126)          (0.30)      (0.30) —      ( 0.31)
    Other                                                                     (19)       (18) —      (21)          (0.04)      (0.04) —      ( 0.05)
    Total FFO as Adjusted                                                    $ 514      $ 527 —     $ 548          $ 1.26      $ 1.28 —      $ 1.33

Transactional Income, Net (1)                                                   18       -   — -                     0.04        -    —        -
                                                                             $ 532      $527 — $ 548               $ 1.30      $ 1.28 —      $ 1.33

Preferred Stock Redemption Charge (2)                                         (22)       -   —   -                 (0.05)           - —           -
  FFO Before Impairments                                                     $ 510      $527 — $ 548               $ 1.25      $ 1.28 —      $ 1.33

Impairments                                                              -                 - —     -               -              - —           -
  FFO (3)                                                                    $ 510      $ 527 — $ 548              $ 1.25      $ 1.28 —      $ 1.33

Capital Recycling Assumptions for 2013:

•     Acquisition of shopping centers: $500M to $600M which includes Kimco's contribution of $375M to $425M

•     Disposition of shopping centers with sales price of $600M to $700M generating Kimco proceeds of $500M to $550M

•     Continuing disposition of non-retail assets → $225M to $275M (including InTown in first half of 2013)

                                (1) Includes normal course of business events such as outparcel sales, acquisition fees and other transactional events
                                (2) Non-cash charge to FFO associated with the redemption of preferred stock issues F (6.65%) and G (7.75%)
                                (3) Reflects the potential impact if certain units were converted to common stock at the beginning of the period.

                                                                                                                                                         36
Reconciliation of FFO to Net Income Available to Common Shareholders

($ in millions, except per share data)                                                2012A                 2013F                  2012A*                 2013F*
FFO                                                                                      $ 510      $ 527       — $ 548             $ 1.25        $ 1.28     — $ 1.33
Depreciation & amortization                                                              (257)       (256)      — (264)              (0.63)        (0.62)    — (0.64)
Depreciation & amortization real estate joint ventures (1)                               (134)       (126)      — (134)              (0.33)        (0.31)    — (0.33)
Gain on disposition of operating properties                                                  85         4       —      12             0.21          0.01     —       0.03
Gain on disposition of joint venture operating properties (1)                                28         4       —      8              0.07          0.01     —       0.02
Impairments of operating properties, net of tax (1)                                        (59)         -       —      -             (0.15)           -      —         -
Net income available to common shareholders                                              $ 173      $ 153       — $ 170             $ 0.42        $ 0.37      — $ 0.41
                                                                                                                                        (1) Net of noncontrolling interests
                                                                                                                                        * Reflects diluted per share basis
                                                             Certain reclassifications of prior year amounts have been made to conform with the current year presentation.

      Manetto Hill Plaza
      Plainview, NY

                                                                                                                                                                              37
The Kimco Difference

Largest owner/operator/investment          U.S. shopping center portfolio growth   Strong balance sheet and related credit
manager of U.S. shopping centers with      from occupancy increases,               ratings with excellent liquidity, access
50 years of history, retailer              recapture/re-tenanting of below         to capital and banking relationships
relationships, leasing expertise and       market leases, and redevelopment
redevelopment experience                   programs

                                                                                   Proven opportunistic investor in retail
International platform with incremental   Retail operating partner of choice for
                                                                                   real estate owned by U.S. retailers
earnings from strong Canadian market      large, blue chip domestic and
                                                                                   through structured sales leaseback and
and lease-up of Mexico development        international pension funds and
                                                                                   purchase transactions
portfolio                                 insurance companies

                                                                                                                              38
You can also read