Proposed Acquisition of a 50.0% Interest in 11 Logistics Properties in China - April 2018
←
→
Page content transcription
If your browser does not render page correctly, please read the page content below
Proposed Acquisition of a 50.0% Interest in 11 Logistics Properties in
China
April 2018

1

Disclaimer
This presentation has been prepared by Mapletree Logistics Trust Management Ltd. (in its capacity as the Manager of Mapletree Logistics Trust (“MLT”, and the manager of MLT, “MLTM” or the “Manager”))
for the sole purpose of use at this presentation and should not be used for any other purposes. The content of this presentation has not been reviewed by any regulatory authority. The information and opinions
in this presentation are provided as at the date of this document (unless stated otherwise) are subject to change without notice, its accuracy is not guaranteed and it may not contain all material information
concerning MLT. Neither the Manager, MLT nor any of their respective affiliates, advisors and representatives or any of their respective holding companies, subsidiaries, affiliates, associated undertakings or
controlling persons, or any of their respective directors, officers, partners, employees, agents, representatives, advisers (including any global co-ordinator and bookrunner in respect of any potential equity fund
raising that may be undertaken by the Manager) or legal advisers make any representation or warranty, express or implied and whether as to the past or the future regarding, and assumes no responsibility or
liability whatsoever (in negligence or otherwise) for, the fairness, accuracy, completeness or correctness of, or any errors or omissions in, any information contained herein or as to the reasonableness of any
assumption contained herein or therein, nor for any loss howsoever arising whether directly or indirectly from any use, reliance or distribution of these materials or its contents or otherwise arising in connection
with this presentation. Further, nothing in this document should be construed as constituting legal, business, tax or financial advice. None of the Mapletree Investments Pte Ltd (“MIPL”, or the "Sponsor"), MLT,
the Manager, HSBC Institutional Trust Services (Singapore) Limited (as the trustee of MLT (the “Trustee”)) or their respective subsidiaries, affiliates, advisors, agents or representatives have independently
verified, approved or endorsed the material herein.
The information contained in this presentation includes historical information about and relevant to the assets of MLT that should not be regarded as an indication of the future performance or results of such
assets. This presentation contains forward-looking statements that may be identified by their use of words like “plans”, “expects”, “will”, “anticipated”, “believes”, “intends”, “depends”, “projection”, “estimates” or
other words of similar meaning and that involve assumptions, risks and uncertainties. All statements that address expectations or projections about the future and all statements other than statements of
historical facts included in this presentation, including, but not limited to, statements about the strategy for growth, product development, market position, expenditures, and financial results, are forward-looking
statements. Such forward-looking statements are based on certain assumptions and expectations of future events regarding MLT's present and future business strategies and the environment in which MLT will
operate, and must be read together with those assumptions. The Manager does not guarantee that these assumptions and expectations are accurate or will be realised. Actual future performance, outcomes
and results may differ materially from those expressed in forward-looking statements as a result of a number of risks, uncertainties and assumptions. Although the Manager believes that such forward-looking
statements are based on reasonable assumptions, it can give no assurance that such expectations will be met. Representative examples of these risks, uncertainties and assumptions include (without limitation)
general industry and economic conditions, interest rate trends, cost of capital and capital availability, competition from other companies, shifts in customer demands, customers and partners, changes in
operating expenses including employee wages, benefits and training, governmental and public policy changes and the continued availability of financing in the amounts and the terms necessary to support
future business. Predictions, projections or forecasts of the economy or economic trends of the markets are not necessarily indicative of the future or likely performance of MLT. Past performance is not
necessarily indicative of future performance. The forecast financial performance of MLT is not guaranteed. You are cautioned not to place undue reliance on these forward-looking statements, which are based
on the Manager’s current view of future events. No assurance can be given that the future events will occur or that projections will be achieved. The Manager does not assume any responsibility to amend,
modify or revise any forward-looking statements, on the basis of any subsequent developments, information or events, or otherwise. You should conduct your own independent analysis of the Sponsor, the
Manager and MLT, including consulting your own independent legal, business, tax and financial advisers and other advisers in order to make an independent determination of the suitability, merits and
consequences of investment in MLT. In addition, any discrepancies in the tables, graphs and charts between the listed amounts and totals thereof are due to rounding. Figures shown as totals in tables may not
be an arithmetic aggregation of the figures that precede them. Where applicable, figures and percentages are rounded to one decimal place.
These materials contain a summary only and do not purport to contain all of the information that may be required to evaluate any potential transaction mentioned in this presentation, including the acquisition by
MLT of a 50.0% interest in each of 11 Hong Kong special purpose vehicles, as described herein, which may or may not proceed. The information set out in this presentation is for information only and is not
intended to form the basis of any contract. By attending this presentation, you agree that you will not rely on any representation or warranty implied herein or the information contained herein in any action or
decision you may take or make. This presentation does not constitute or form part of an offer, solicitation, recommendation or invitation for the sale or purchase of securities or of any of the assets, business or
undertakings described herein. No part of it nor the fact of its presentation shall form the basis of or be relied upon in connection with any investment decision, contract or commitment whatsoever.
This presentation is being provided to you for the purpose of providing information in relation to the forthcoming transaction by MLT. Therefore, this presentation is not being distributed by, nor has it been
approved for the purposes of section 21 of the Financial Services and Markets Act 2000 (“FSMA”) by, a person authorised under FSMA. This presentation is being communicated only to persons in the United
Kingdom who are (i) authorised firms under the FSMA and certain other investment professionals falling within article 19 of the FSMA (Financial Promotion) Order 2005 (the "FPO") and directors, officers and
employees acting for such entities in relation to investment; (ii) high value entities falling within article 49 of the FPO and directors, officers and employees acting for such entities in relation to investment; or (iii)
persons who receive the presentation outside the United Kingdom.
This presentation is being communicated only to Persons in Hong Kong SAR who are professional investors as defined in Schedule 1 to the Securities and Futures Ordinance (Cap 571 of Hong Kong SAR) or
any rules made thereunder.
Nothing in this presentation constitutes or forms a part of any offer to sell or solicitation of any offer to purchase or subscribe for securities for sale in the United States, the European Economic Area, Japan,
Australia, Hong Kong SAR, Singapore or any other jurisdiction. The securities of MLT will not be registered under the U.S. Securities Act of 1933, as amended (the "Securities Act") or under the securities laws
of any state or other jurisdiction of the United States, and may not be offered or sold within the United States except pursuant to an exemption from, or transactions not subject to, the registration requirements
of the Securities Act and in compliance with any applicable state securities laws. The Manager does not intend to conduct a public offering of any securities of MLT in the United States. Neither this presentation
nor any part thereof may be (a) used or relied upon by any other party or for any other purpose, (b) copied, photocopied, duplicated or otherwise reproduced in any form or by any means, or (c) forwarded,
published, redistributed, passed on or otherwise disseminated or quoted, directly or indirectly, to any other person either in your organisation or elsewhere. By attending this presentation, you agree to be bound
by the terms set out above.
Acquisition Overview
3
Transaction Summary
Proposed acquisition of a 50.0% interest in each of 11 Hong Kong special purpose vehicles (“HK
SPVs”)1, each of which indirectly owns a logistics property located in the PRC (collectively the
“Properties” and the acquisition of interests in the HK SPVs, the “Acquisition”)
Transaction Mapletree Investments Pte Ltd (“MIPL” or the “Sponsor”) through its wholly-owned subsidiaries, will be
the sole investor of the other 50.0% indirect interest in the Properties post Acquisition
The Trustee has pre-emption rights over the relevant MIPL Subsidiary's shares in the relevant HK SPV2
and has provided reciprocal rights to the MIPL subsidiaries
Approximately RMB1,021.6 million (approximately S$212.8 million) comprising:
The Acquisition Price of approximately RMB985.3 million (S$205.3 million) 3
Total Acquisition
Cost The acquisition fee payable in units (the “Acquisition Fee Units”) to the Manager for the
Acquisition which is estimated to be approximately S$1.0 million
The estimated professional and other fees and expenses of approximately S$6.5 million
Independent Colliers: RMB2,895.0 million (approximately S$603.1 million)4
Valuation JLL: RMB2,956.0 million (approximately S$615.8 million)4
The aggregate Agreed Property Value of RMB 2,846.8 million (approximately S$593.0 million) is at a
Aggregate Agreed
discount of approximately 1.7% to Colliers’ aggregate valuation and a discount of approximately 3.7% to
Property Value JLL’s aggregate valuation
Based on the exchange rate on 19 April 2018, being the latest practicable date prior to the announcement (the “Latest Practicable Date”), of S$1 = RMB4.80.
1) 3 of the HK SPVs are wholly-owned by MIPL wholly-owned subsidiaries (“MIPL Subsidiaries” and the 3 HK SPVs, the “Sponsor-owned HK SPVs”) and 8 of the HK SPVs are
owned by the MIPL Subsidiaries and Itochu Corporation (“Itochu”) wholly-owned subsidiaries (“Itochu Subsidiaries”) in the proportion of 80.0% and 20.0% respectively (the
“Co-owned HK SPVs”).
2) In the event that the relevant MIPL Subsidiary wishes to divest its 50.0% interest in the HK SPV.
3) The acquisition price payable is the sum of (1) 50.0% of the adjusted consolidated net asset values of the HK SPVs (taking into account, among others, the Agreed Property
Value less existing shareholders’ loans owed to the MIPL Subsidiaries and the Itochu Subsidiaries and RMB944.2 million (S$196.7 million) of bank loans), subject to post-
completion adjustments and (2) the value of the loans to be extended by the Trustee to each HK SPV to enable them to repay and discharge 50.0% of the existing shareholders’
loans.
4) Represents the independent aggregate valuation by Colliers International (Hong Kong) Ltd (“Colliers”) and Jones Lang LaSalle Corporate Appraisal and Advisory Limited
(“JLL”) for the Properties as at 1 March 2018. Colliers was commissioned by the Trustee and JLL was commissioned by the Manager.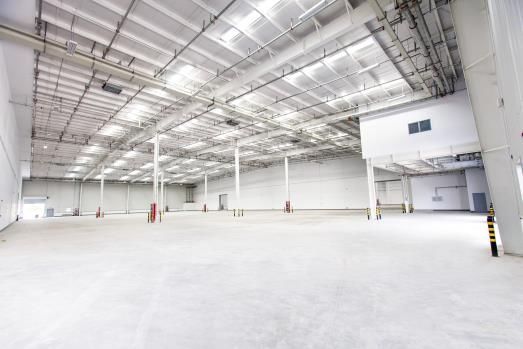
4

Overview of the Properties1
Aggregate Agreed                     Implied Net Property                Net Lettable                        Occupancy                            Weighted Average
Property Value                       Income Yield                        Area (“NLA”)                        Rate2                                Lease Expiry (“WALE”)
RMB2,846.8 million                   6.4%                                821,911 sq m                        97.7%                                3.3 years3
(c. S$593.0 million)
8       Mapletree Xi’an                                                                                         1     Mapletree Tianjin           2    Mapletree Zhenjiang

                                                  North China:
                                                     3.7%
                                              of Aggregate Agreed
                                                 Property Value

9      Mapletree Wuhan                                                                                          3      Mapletree Wuxi             4     Mapletree Nantong

                                                                                  1

                                                                   8
10   Mapletree Changsha                                                                 2                       5   Mapletree Changshu            6     Mapletree Jiaxing
                                                                                          3 4
                                                                             9              5
                                                                                         7 6
                                                                                  11
                                       Midwest China:                   10
                                           36.5%
                                    of Aggregate Agreed
11   Mapletree Nanchang                Property Value                                       East China:
                                                                                                                7   Mapletree Hangzhou

                                                                                             59.8%
                                                                                       of Aggregate Agreed
                                           Location of the Properties                     Property Value
                                           Satellite Clusters

1)   The 11 properties are: Mapletree Tianjin Wuqing Logistics Park (“Mapletree Tianjin”); Mapletree Zhenjiang Logistics Park (“Mapletree Zhenjiang”); Mapletree Wuxi New District
     Logistics Park (“Mapletree Wuxi”); Mapletree Nantong Chongchuan Logistics Park (“Mapletree Nantong”); Mapletree Changshu Logistics Park (”Mapletree Changshu”); Mapletree
     Jiaxing Logistics Park (“Mapletree Jiaxing”); Mapletree Hangzhou Logistics Park (“Mapletree Hangzhou”); Mapletree Fengdong (Xi’an) Industrial Park (“Mapletree Xi’an”); Mapletree
     Wuhan Yangluo Logistics Park (“Mapletree Wuhan”); Mapletree Changsha Logistics Park Phase 1 (“Mapletree Changsha”); and Mapletree Nanchang Logistics Park (“Mapletree
     Nanchang”)
2)   As at 31 March 2018, the portfolio occupancy rate of the Properties is 83.2% and including committed leases that have been secured as at the Latest Practicable Date, the portfolio
     occupancy rate of the Properties is 97.7%.
3)   By NLA as at 31 March 2018.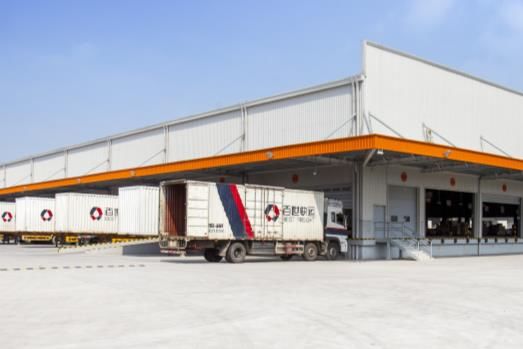
Key Acquisition Rationale
6

Key Acquisition Rationale

 1           Attractive Logistics Market in China

                 Strategic Addition of a Diversified and
     2            Well-Located Portfolio Across China

                       Strong Tenant Base with Exposure to
         3             Businesses Involved in E-Commerce

             4                 Attractive Value Proposition

                   5        Positive Impact on MLT’s Enlarged Portfolio
7
1 Attractive Logistics Market in China
Strategic Expansion in the Largest Asia-Pacific Economy with a High
and Sustainable Growth Profile
Asia-Pacific 2017 Real GDP, Real GDP Growth Components of China’s GDP Growth
and Population (2008, 2012 and 2017)
3% 3% 3%
1,372 128 1,339 51 24 8 32 6 96
6.7% 32%
5.5% 5.2% 43%
4.1% 53%
2.4% 2.0%
1.5% 0.9% 1.3%
6,572
5,159 Increasing
65% domestic
54% consumption
1,915 44%
1,350 1,013
269 263 231 119
2008 2012 2017
2017 Real GDP (US$billion)1 Forecast Real GDP per Capita Growth: 2017 Population (million) Domestic Consumption Investment Net Exports
17' – 22F' (CAGR)
China has the largest economy and population in Asia Pacific and is one of the world’s fastest growing economies
China’s economic growth is shifting from investment driven growth to domestic consumption driven growth, which is more
stable and sustainable
Source: Economist Intelligence Unit and the independent market research consultant, Colliers International (Hong Kong) Ltd (the “Independent Market Research Consultant”).
1) Adjusted to exclude the effects of inflation, with 2005 as the reference year.8
1 Attractive Logistics Market in China
Rising Consumption Expenditure and Rapid Expansion of E-commerce in China Support
Strong Demand for Logistics Properties
Rising Consumption Expenditure in China
2017 Consumption Expenditure per Capita China Disposable Household Income per Capita
(US$) (US$)
7.6%
4.9% 4.5%
2.4% 12,844
1.0%
41,051
8,219 8,261
31,629
23,694 21,288 4,482
2,813
3,453 1,255
2006 2016 2030F
2017 Consumption Expenditure per Capita (US$) Forecast Growth: 17' - 22F' (CAGR) Tier 1 Cities Non-Tier 1 Cities
Higher CAGR in disposable household income per capita
China’s consumption expenditure per capita is significantly lower
expected in Non-Tier 1 cities vs. Tier 1 cities
than major developed economies
Increasing household income and consumption higher
Forecasted to grow at a higher CAGR between 2017-2022F,
demand for logistics services greater demand for logistics
driven by rising disposable household income
properties
Source: Economist Intelligence Unit, National Bureau of Statistics of China and Independent Market Research Consultant.9
1 Attractive Logistics Market in China
Rising Consumption Expenditure and Rapid Expansion of E-commerce in China Support
Strong Demand for Logistics Properties
Rapid Expansion of E-commerce in China
E-Commerce Sales Volume and Growth in China
Overview of Selected E-commerce Markets (US$ billion)
1,121
1,006
449 813
769 734
366 651
618
553
449
327 345
264 264
223
79 172
51 103
19 62
2 1
China United Japan South Korea Australia Hong Kong Singapore 2012 2013 2014 2015 2016 2017 2018F 2019F 2020F 2021F
States
2017 E-commerce Sales (US$ billion) 2017 E-commerce Sales per Capita (US$) Historical Forecast
China ranked first in total e-commerce sales volume among selected Asia-Pacific economies but e-commerce sales per capita remains
relatively low
E-commerce sales in China is expected to achieve strong growth as more global retailers and brands enter the market via cross border
e-commerce, facilitated by omni-channel distribution and rise in mobile payments
Increasing emphasis on efficiency and faster deliveries strong demand for warehouses and distribution centres rise of third-party
logistics (“3PL”)
3PLs contribute ~45.0% of net absorption of Grade A warehouses in 2017 and the 3PL market is expected to grow at a CAGR of 10.2%
between 2018F-2021F
Source: Euromonitor, World Bank and Independent Market Research Consultant.10
1 Attractive Logistics Market in China
Favorable Supply-Demand Dynamics Underpins Rental Growth of Logistics Assets
Grade A Warehouse Space per 1,000 persons China Grade A Warehouse Average Rent
(sq m) and Occupancy Rate
87% 87%
83%
1,346.7 80% 80%
78%
1.09
681.4 1.05
1.01
142.9
33.0 0.96
0.94
0.91
China Singapore Hong Kong Japan 2014 2015 2016 2017 2018F 2019F
Grade A Warehouse Space per 1,000 persons (sq m) Historical Average Rent Forecast Average Rent Occupancy Rate (%)
(RMB per sq m per day) (RMB per sq m per day)
Imbalance in supply compared to demand will continue to support rise in occupancy rates and rental growth for Grade A
warehouses
Source: Independent Market Research Consultant.
1) Grade A warehouses in China are identified by their high specifications, such as a clear ceiling height of 9 metres and floor loading of 20 kiloNewton per square metre (“kN per
sq m”) to 40 kN per sq m.11
1 Attractive Logistics Market in China
Beneficiary of the One Belt One Road Initiative (“OBOR”)
China-Mongolia-Russia Economic Corridor (“CMREC”)1
Comprises two key traffic arteries which extend from parts
of China to Russia
New Eurasia Land Bridge Economic Corridor (“NELBEC”)2
A 10,800 km rail link linking the Pacific Ocean and Atlantic
Ocean, serving > 30 countries and regions
China-Indochina Peninsula Economic Corridor (“CICPEC”)3
A land bridge which links China with the Indochina
Peninsula and crosses Vietnam, Laos, Cambodia,
Thailand, Myanmar and Malaysia
Location of the Properties
Selected Economic Corridors
OBOR initiative aims to boost inter-continental trade and connectivity by land and sea between Europe, Africa and China support demand for logistics
properties
The Properties are located near or along the three economic corridors of the OBOR initiative
Source: Independent Market Research Consultant.
1) Properties along or near the CMREC: Mapletree Tianjin.
2) Properties along or near the NELBEC: Mapletree Wuxi, Mapletree Hangzhou, Mapletree Nantong, Mapletree Changshu, Mapletree Xi'an, Mapletree Jiaxing, and
Mapletree Zhenjiang.
3) Properties along or near the CICPEC: Mapletree Changsha, Mapletree Wuhan, and Mapletree Nanchang.2
Strategic Addition of a Diversified and Well-Located 12
Portfolio Across China
Located in 3 Clusters with Unique Economic Growth Characteristics
No. Property North China:
1 Mapletree Tianjin
North China: One of the most densely populated regions in
2 Mapletree Zhenjiang China
3 Mapletree Wuxi
3.4% Highly developed transportation and logistics
Contribution to Properties’
4 network
Mapletree Nantong Gross Revenue
5 Mapletree Changshu
6 Mapletree Jiaxing
Midwest China1:
7 Mapletree Hangzhou
1 Will become prominent economic, transportation
8 Mapletree Xi’an and logistics centres for China due to the OBOR
initiative
9 Mapletree Wuhan
8 Two of the fastest growing regions since 2011 in
10 Mapletree Changsha 2 China and expected to grow at faster rate than
3 4
5 the national average
11 Mapletree Nanchang 9
7 6
11
10 East China:
One of the most urbanised and economically
Midwest China1: East China: developed regions in China with well-established
transport infrastructure
34.7% 61.9%
Contribution to Contribution to Geographical location and economic strength
Location of the Properties Properties’ Properties’ have laid solid foundation for development of the
Gross Revenue Gross Revenue modern logistics industry
Satellite Clusters
Source: Independent Market Research Consultant.
1) Comprising Central and Western China.2
Strategic Addition of a Diversified and Well-Located 13
Portfolio Across China
Located in 3 Clusters with Unique Economic Growth Characteristics
Grade A Warehouse Forecast Rental Growth for 2018F and 2019F (Asking Rent)
(%)
North China East China Midwest China
5.9%
5.1%
4.7% 4.9% 4.8% 4.9%
4.6% 4.5% 4.5%
4.6% 4.3% 4.3%
4.1% 4.0%
3.8% 3.9%
3.5% 3.6% 3.5%
3.0% 3.0%
2.7%
Tianjin Zhenjiang Wuxi Nantong Changshu Jiaxing Hangzhou Xi'an Wuhan Changsha Nanchang
2018F vs. 2017 2019F vs. 2018F
Rental growth expected to remain healthy due to favorable location
Asking rents for Grade A warehouses in the 11 cities1 expected to increase between 2.7% and 5.1% from 2017 to 2018F and between 3.5%
and 5.9% from 2018F to 2019F
Source: Independent Market Research Consultant.
1) The 11 cities are Tianjin, Zhenjiang, Wuxi, Nantong, Changshu, Jiaxing, Hangzhou, Xi'an, Wuhan, Changsha and Nanchang.2
Strategic Addition of a Diversified and Well-Located 14
Portfolio Across China
Excellent Connectivity
- (minutes)
Est. Travel Time by Road 5 10 15 20 25 30 35 40
Expressway Entrance
Mapletree Tianjin
Wuqing Railway Station
Expressway Entrance
Mapletree Zhenjiang
Nanjing Lukou International Airport
Sunan Shuofang International Airport
Mapletree Wuxi
Wuxi Railway Station
Nantong Xingdong International Airport
Mapletree Nantong
Nantong Railway Station
Mapletree Changshu Expressway Entrance
Jiaxing Airport
Mapletree Jiaxing
Jiaxing South Railway Station
Expressway Entrance
Mapletree Hangzhou
Hangzhou Bay Sea Wharf
Expressway Entrance
Mapletree Xi’an
Xi`an Railway Station
Expressway Entrance
Mapletree Wuhan
Yangluo Port
Expressway Entrance
Mapletree Changsha
Changsha Port
Nanjing Changbei International Airport
Mapletree Nanchang
Container Terminal of Nanchang Port
The Properties have excellent connectivity, being located in cities which are either transportation hubs or are expected to benefit from the
OBOR initiative
They are located near highways, railway stations, airports and / or sea or river ports
Source: Independent Market Research Consultant.2
Strategic Addition of a Diversified and Well-Located 15
Portfolio Across China
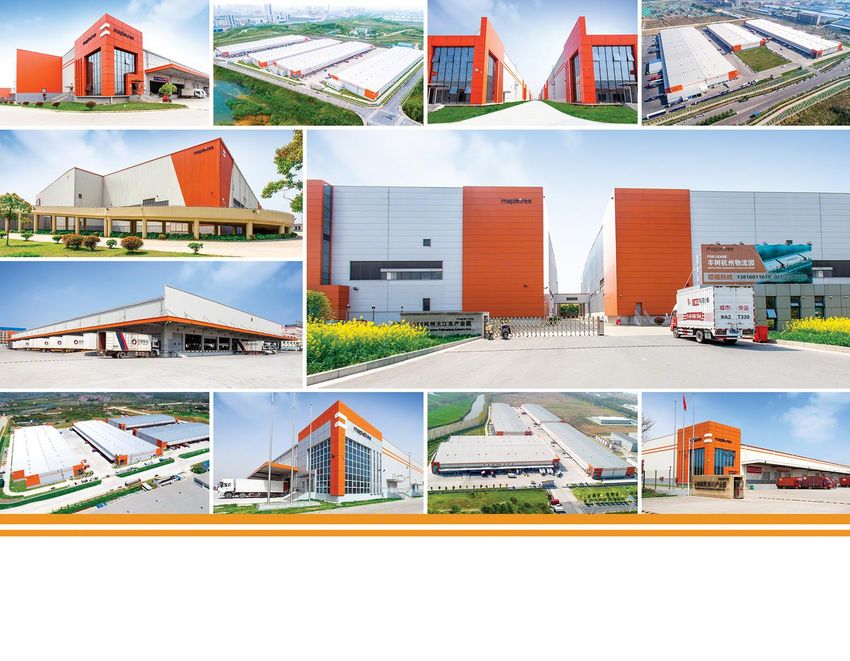
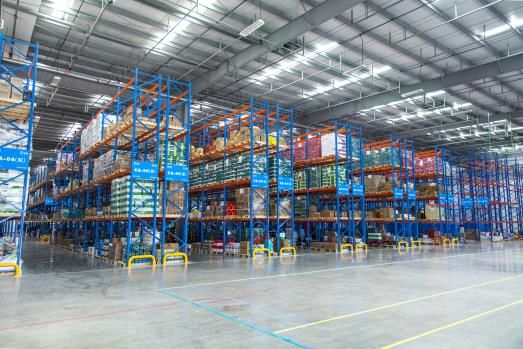
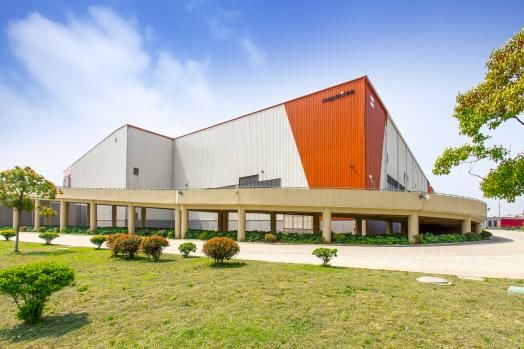
Modern Grade A Specification Assets with Long Land Tenure
Clear Ceiling Height of 9 metres and
New and Purpose-Built
Floor Loading of >20kN per sq m
Developed by the
Sponsor, an established
real estate developer with
a track record of award-
winning projects
Remaining land tenure of
the Properties is
approximately 47 years on
Cross-Docked Warehouse Efficient Column Grid average
The portfolio median age
for the Properties is 1.7
years old with the oldest
Property being 2.3 years
old1
1) As at 31 March 2018.3
Strong Tenant Base with Exposure to Businesses 16
Involved in E-commerce
Top Five Tenants are Large E-commerce or E-commerce Related Companies
Tenant Breakdown by Gross Revenue and Trade Sector
% of Gross Trade Sector
Top 10 Tenants of the Properties One of the largest e-commerce companies
Revenue1 (Business Nature)
by market share in China
JD.com, Inc. 20.8% Multi-Sector (E-commerce)
Logistics arm of Alibaba
Cainiao Smart Logistics Network Limited
19.3% Multi-Sector (3PL)
(“Cainiao”)
Best Logistics Technology (China) Co., Ltd. 5.3% Multi-Sector (3PL) Major express delivery companies
supporting e-commerce activities
Sinotrans Limited 4.6% Multi-Sector (3PL)
China Post Group Corporation 3.8% Multi-Sector (3PL)
SF Express (Group) Co., Ltd. 3.7% Multi-Sector (3PL)
Enhances MLT’s tenant mix in China with additional
58 tenants:
Adient Yanfeng Seating Mechanism Co.,
3.6% Automobile
Ltd. Majority are major e-commerce companies or 3PL
companies with strong credit profiles
China Deppon Logistics Co., Ltd 3.4% Retail (3PL)
Certain tenants have incurred capital expenditure
to fit out their logistics facilities to high
Shanghai Zhengming Modern Logistics Co.,
3.0% F&B / Multi-Sector (3PL) specifications and such capital expenditure
Ltd.
supports tenant retention and encourages tenants
to enter into longer lease terms2
ZTO Express Co., Ltd. 2.9% Multi-Sector (3PL)
Acquisition will increase the exposure to e-commerce
related tenants in MLT’s China portfolio from 18.4% to
Top 10 Total 70.3% 41.6%3 on a pro forma basis by Gross Revenue
1) Based on existing and committed leases for the Properties as at the Latest Practicable Date.
2) The WALE by NLA as at 31 March 2018 for the 9 existing properties in China held by MLT (the "Existing China Portfolio") is 2.0 years. Post-Acquisition, WALE by NLA as at 31
March 2018 for the Existing China Portfolio and the Properties (the “Enlarged China Portfolio”) is expected to extend to 2.7 years (Based on MLT’s 50.0% indirect interest in the
Properties and based on existing and committed leases for the Properties as at the Latest Practicable Date).
3) Based on MLT's 50.0% indirect interest in the Properties.3
Strong Tenant Base with Exposure to Businesses 17
Involved in E-commerce
Reduce Tenant Concentration Risk in MLT’s China Portfolio
Top 10 Tenants of MLT’s Enlarged China Portfolio1 by Gross Revenue
63.5% 53.8%2
14.5% of Gross Revenue Contributed of Gross Revenue1 Contributed
by Existing Portfolio’s Top 10 by Enlarged Portfolio’s Top 10
Tenants in China Tenants in China
10.4%
9.7% 9.8%
8.8%
7.5% 7.3%
6.5%
4.8%
4.2% 4.4%
3.7% 3.6% 3.5%
2.7% 2.3%
JD.com, Inc. Cainiao China Deppon A.P. Moller- Shanghai Shanghai Dia Integrated Nissin Best Logistics Sinotrans
Logistics Co., Maersk Group Zhengming Retail Co., Shun Hing Corporation Technology Limited
Ltd Modern Ltd Logistics (China) Co.,
Logistics Co., (Shanghai) Co. Ltd.
Ltd. Ltd.
Existing China Portfolio Enlarged China Portfolio
1) Based on MLT’s 50.0% indirect interest in the Properties.
2) As at 31 March 2018 on a pro forma basis.18
4 Attractive Value Proposition
Discount to Independent Valuations and Implied Valuation Metrics
Compared to MLT’s Existing China Portfolio
Aggregate Agreed Property Value Relative to
Independent Valuations Net Property Income Yield
(RMB million) (%)
3.7% 6.4%
Discount 2,956
1.7% 20 basis points
Discount 2,895
6.2%
2,847
Aggregate Agreed Colliers JLL The Properties1 MLT's Existing
Property Value China Portfolio 2
Source: Colliers, JLL and Manager.
1) Assuming that the Properties had a portfolio occupancy rate of 97.7% for the entire financial year ended 31 March 2018 and all leases, whether existing or committed as at the
Latest Practicable Date, were in place since 1 April 2017. All tenants were paying their rents in full. Net Property Income yield is computed based on the aggregate Agreed
Property Value.
2) Based on the Net Property Income of the Existing China Portfolio for FY17/18 divided by its valuation as at 31 March 2018.19
5 Positive Impact on MLT’s Enlarged Portfolio
Increases and Diversifies MLT’s Exposure in China
Existing Portfolio Enlarged Portfolio
1% 1% China
5% 3% 3%
Geography (as at
9%
31 March 2018)
6%
Valuation by
34% 6% 33% Hong Kong
9%
S$6,515 8% S$6,816
million million1 Singapore
15%
14%
27% 26% Japan
Australia
2%
Property Income by
2%
5% 4%
6% 21% 11% 20%
FY17/18 Net
Geography
7% South Korea
7%
10%
S$334 S$353
Malaysia
million 10% million2
32% 30%
17% Vietnam
16%
The Acquisition will introduce assets located in non-Tier 1 China cities with higher expected growth in disposable household
income, complementing MLT's existing China properties which are primarily located in affluent eastern and southern China
cities
1) Based on MLT's 50.0% indirect interest in the Properties.
2) Based on MLT's 50.0% indirect interest in the Properties. Assuming that the Properties had a portfolio occupancy rate of 97.7% for the entire financial year ended 31 March 2018
and all leases, whether existing or committed as at the Latest Practicable Date, were in place since 1 April 2017. All tenants were paying their rents in full.Financing Considerations
21
Financing Considerations
Illustrative Uses
Approximately RMB1,021.6 million (approximately S$212.8 million) comprising:
The Acquisition Price of approximately RMB985.3 million (S$205.3 million) which comprises:
• The aggregate purchase consideration estimated to be RMB120.5 million (approximately S$25.1
million)(the “Aggregate Share Consideration”)1
Total Acquisition
• The loans extended by the Trustee to the HK SPVs of RMB864.8 million (approximately S$180.2
Cost million) (the “Trustee Shareholders’ Loans”)2
The acquisition fee payable in units3 to the Manager for the Acquisition which is estimated to be approximately
S$1.0 million4
The estimated professional and other fees and expenses of approximately S$6.5 million5
Illustrative Sources6
Assumed approximately S$200.0 million
Equity Fund Raising The details and timing of the Equity Fund Raising have not been determined and the Manager will announce details at
the appropriate time
Loan Facilities MLT’s existing bank facilities (the “Loan Facilities”)
Acquisition Fee
Approximately 0.9 million Acquisition Fee Units at an illustrative issue price of S$1.20 per Acquisition Fee Unit
(in Units)
1) This is the aggregate purchase consideration payable by the Trustee in connection with the Acquisition, subject to adjustments after the date of completion of the Acquisition
(“Completion”) to the adjusted consolidated net asset values of the 11 HK SPVs. This amount comprises the purchase consideration of RMB21.5 million (approximately S$4.5
million) payable to the Itochu Subsidiaries and the purchase consideration of RMB99.0 million (approximately S$20.6 million) payable to the MIPL Subsidiaries.
2) To be extended by the Trustee to the HK SPVs at Completion, subject to adjustments based on the actual date of Completion to take into account interest accruing up to such
date.
3) As the acquisition of the interests of the MIPL Subsidiaries in the HK SPVs will constitute an "interested party transaction" under the Property Funds Appendix, the acquisition
fee will be in the form of Acquisition Fee Units, which shall not be sold within one year from the date of issuance. While the acquisition of the interests of the Itochu Subsidiaries
in the HK SPVs will not constitute an "interested party transaction" under the Property Funds Appendix, the Manager has nevertheless elected to receive the acquisition fee in
the form of Acquisition Fee Units and not to dispose of them within one year from the date of issuance.
4) Representing 0.5% of the Acquisition Price.
5) Incurred or to be incurred by MLT in connection with the Acquisition and the Equity Fund Raising.
6) The final decision regarding the proportion of the debt and equity to be employed to fund the Acquisition will be made by the Manager at the appropriate time, taking into account
the then prevailing market conditions to provide overall DPU accretion to Unitholders on a pro forma basis while maintaining an optimum level of aggregate leverage.22
Financial Impact on MLT
DPU-Accretive Acquisition
Pro Forma DPU (FY17/18)
(S$ cents)
(12-month Period from 1 April 2017 – 31 March 2018)
7.650
7.618
Existing Portfolio Enlarged Portfolio 1
1) Assuming that the Properties had a portfolio occupancy rate of 97.7% for the entire financial year ended 31 March 2018 and all leases, whether existing or committed as at the
Latest Practicable Date, were in place since 1 April 2017. All tenants were paying their rents in full. Includes the contribution to total return before tax arising from MLT's 50.0%
indirect interest in the Properties. MLT’s expenses comprising borrowing costs associated with the drawdown of S$11.8 million from the Loan Facilities, the Manager’s
management fees, Trustee’s fees and other trust expenses incurred in connection with the operation of the Properties have been deducted. The total number of Units at the end
of the period used in computing the DPU comprises the weighted average of 2,779.3 million Units in issue for the financial year ended 31 March 2018 as well as (a)
approximately 166.7 million New Units issued in connection with the Equity Fund Raising to raise gross proceeds of approximately S$200.0 million at the Illustrative Issue Price
of S$1.20, (b) approximately S$1.0 million Acquisition Fee paid in Acquisition Fee Units at the Illustrative Issue Price of S$1.20 and (c) approximately 1.3 million new Units
issued in aggregate as payment to (i) the Manager for the base management fee and (ii) the PRC Property Manager as payment for the property management and lease
management fees for such services rendered to the Properties for the financial quarters ended 30 June 2017, 30 September 2017 and 31 December 2017, based on the volume
weighted average price for all trades on the SGX-ST in the last 10 business days of each respective financial quarter.
2) Accretion is based on pro forma numbers and does not take into account the impact from rounding.23
Financial Impact on MLT
Increase in Free Float and Liquidity
Market Capitalisation and Free Float
(S$ million)
3,8712
3,6701
2,360
2,560
(66.1%)
1 Increase free float
(64.3%)
Potentially improve trading liquidity which may
2 lead to an improved market index representation
1,310 1,3113
(35.7%) (33.9%)
Current After the Equity Fund Raising
Sponsor Stake Free Float
1) Based on 3,058.2 million Units in issue as at the Latest Practicable Date at an illustrative price of S$1.20 per Unit.
2) Based on 3,058.2 million Units in issue as at the Latest Practicable Date and the issue of approximately 166.7 million New Units under the Equity Fund Raising and
approximately 0.9 million Acquisition Fee Units at an illustrative price of S$1.20 per Acquisition Fee Unit.
3) Assuming for illustrative purposes, the Sponsor’s ownership of Units in MLT remained the same before and after the Equity Fund Raising, other than the receipt of Acquisition
Fee Units.24
MLT After the Proposed Acquisition
Enlarged Asset Size of S$6,816 million from S$6,515 million
Existing Portfolio1 Properties1,2 Enlarged Portfolio1 % Change
NLA (‘000 sq m) 3,738 402 4,150 11.0%
Valuation (S$ million) 6,515 3013 6,816 4.6%
WALE by NLA (Years) 3.5 3.3 3.5 -
Number of Tenants 556 58 614 10.3%
Occupancy 96.6%4 97.7%5 96.7% 10bps
Aggregate Leverage 37.7% - 37.5%6 20bps
Net Asset Value per Unit
1.10 - 1.11 0.01
(S$)
1) As at 31 March 2018.
2) Taking into account MLT's 50.0% interest in the Properties.
3) Based on the aggregate Agreed Property Value of the Properties and any capitalised costs. Taking into account MLT's 50.0% interest in the Properties.
4) Based on the actual occupancy.
5) Based on committed occupancy.
6) As at 31 March 2018, on a pro forma basis after the Acquisition, assuming gross proceeds raised for Equity Fund Raising of S$200.0 million.Appendix A: Transaction Details
26
Proposed Structure Post Acquisition
Each property is held by a PRC wholly foreign-owned
MLT MIPL Subsidiaries
enterprise (“PRC WFOE”), which is in turn wholly-
owned by a HK SPV
50.0% 50.0%
interest interest 3 of the HK SPVs are wholly-owned by MIPL
Subsidiaries and 8 of the HK SPVs are owned by the
Hong Kong MIPL Subsidiaries and Itochu Subsidiaries in the
proportion of 80.0% and 20.0% respectively
11 HK SPVs
The Acquisition involves in the case of the Sponsor-
owned HK SPVs, an acquisition of 50.0% of the entire
100.0% interest ordinary issued share capital from the MIPL
Subsidiaries, and in the case of the Co-owned HK
SPVs, an acquisition of 30.0% and 20.0% of the entire
PRC
ordinary issued share capital from the MIPL
11 PRC WFOEs Subsidiaries and the Itochu Subsidiaries respectively
Following the Acquisition, MLT will hold a 50.0%
100.0% interest interest in each of the 11 HK SPVs, with the other
50.0% interest held by the MIPL Subsidiaries
The Trustee has pre-emption rights over the relevant
11 Properties MIPL Subsidiary's shares in the relevant HK SPV1 and
has provided reciprocal rights to the MIPL subsidiaries
1) In the event that the relevant MIPL Subsidiary wishes to divest its 50.0% interest in the HK SPV.Sponsor’s Retention of a 50.0% Indirect Interest in the 27
Properties
Demonstration of the Sponsor’s Commitment and Leveraging on
its Local Market Experience and Resources
Strong Local Relationships
Total Assets Under Management and Access to Tenants
(as at 31 March 2017)
PRC
S$39.5 billion Manager
Integrated In-House Team
with Capabilities in
Property Management
Established Track Record in
Property and Lease Management
United
Kingdom
S$2.5 billion
Germany China
S$0.2 billion S$5.4 billion Japan
S$3.4 billion
United States
South Korea
S$1.7 billion India S$0.4 billion
S$0.2 billion
Hong Kong SAR
Malaysia S$7.5 billion
S$0.6 billion
Singapore
Countries in which Sponsor has investments in S$15.2 billion
Vietnam
S$x refers to asset under management S$1.3 billion Australia
S$1.1 billion28
Other Positive Impact on MLT’s Enlarged Portfolio
Reduces Tenant Concentration Risk
Top 10 Tenants by Gross Revenue1
(% of Gross Revenue Contribution1)
Existing Portfolio Enlarged Portfolio 1
23.0% 21.6%2
of Gross Revenue of Gross Revenue1
Contributed by Existing Contributed by Enlarged
Top tenant’s contribution towards
Gross Revenue will be reduced from Portfolio’s Top 10 Tenants Portfolio’s Top 10 Tenants
3.7% to 3.5%1,2
3.7%
3.5% 3.4%
3.2%
2.8%
2.7%
2.0% 1.9% 2.0%1.9% 2.0% 1.9%
1.9% 1.8% 1.8%
1.7% 1.7% 1.6% 1.6% 1.5%
Wesfarmers XPO Ever Gain Nippon adidas Hong Nippon Taeun Equinix Bidvest Group Woolworths
Group Worldwide Company Ltd Access Kong Limited Express Logistics Co.,
Logistics Group Ltd.
1) Based on MLT's 50.0% indirect interest in the Properties.
2) As at 31 March 2018 on a pro forma basis.Appendix B: Overview of MLT
30
Overview of MLT
Mapletree Logistics Trust
Public Unitholders MIPL
Sponsor Mapletree Investments Pte Ltd
Mapletree Logistics Trust Management Ltd. 64.3% 35.7%
Manager
− Wholly-owned subsidiary of the Sponsor
Sponsor
Stake
35.7%
Trustee – HSBC
Investment Primarily logistics and distribution spaces in
Mandate Asia-Pacific
Existing
Portfolio
1241 properties valued at S$6.5 billion
Manager – MLTM
Mapletree Property Management Pte. Ltd.
Property (“MPM”)
Manager
− Wholly-owned subsidiary of the Sponsor
Existing Portfolio
Trustee
HSBC Institutional Trust Services (Singapore) Property Manager
Total of 1241 properties across – MPM
Limited
8 geographic markets in Asia Pacific
1) Includes 7 Tai Seng Drive in Singapore. On 11 August 2017, MLT announced that it has granted an option to purchase to Mapletree Investments Pte Ltd for the proposed
divestment of 7 Tai Seng Drive in Singapore, which is subject to the exercise of the option to purchase by MIPL and approval from JTC Corporation.31
Snapshot of MLT
Location of Properties
Key Indicators As at 31 March 2018 (As at 31 March 2018)
Investment Property Value
6,515.2
(S$ million)
Japan
South Korea
Number of Properties: 20
Number of Properties: 11
Occupancy Rate: 100.0%
Market Capitalisation (S$ million) 3,761.5 Occupancy Rate: 95.0%
Valuation:S$953.6 million
Valuation: S$414.5 million
China
Free Float (S$ million) 2,360.2 Number of Properties: 9
Occupancy Rate: 96.0%
Valuation: S$341.6 million
Aggregate Leverage (%) 37.7% Hong Kong SAR
Vietnam
Number of Properties: 9
Number of Properties: 3
Occupancy Rate: 96.6%
Occupancy Rate: 100.0%
Valuation: S$2,233.4 million
Valuation: S$54.0 million
Net Asset Value Per Unit (S$) 1.10
Malaysia
Number of Properties: 14 Singapore
NLA (million sq m) 3.7 Number of Properties: 49
Occupancy Rate: 100.0%
Valuation: S$222.7 million Occupancy Rate: 94.6%
Valuation: S$1,743.6 million
Occupancy (%) 96.6%
WALE by NLA (years) 3.5 Australia
Number of Properties: 9
Occupancy Rate: 100.0%
Valuation: S$551.8 million
No. of Tenants 55632
Growth in Amount Distributable and DPU since Listing
Strong track record of delivering stable distributions and consistent long-term returns to Unitholders through
different economic and property cycles
Focused and proactive approach towards asset and lease management, acquisitions and capital management
Distribution per Unit
(S$ cents)
Global Financial
Crisis
8.24
7.50 7.44 7.62
7.24 7.35 7.38
6.69 6.86
6.57
6.022 6.09
5.06
1.85
FY11/12
FY12/13
FY13/14
FY14/15
FY15/16
FY16/17
FY17/18
FY05
FY06
FY07
FY08
FY09
FY10
1 3
1) FY05 comprised the period from Listing Date of 28 July 2005 – 31 December 2015.
2) Decline in FY09 DPU due to increase in unit base following rights issue in August 2008
3) FY11/12 comprised a 15-month period ended 31 March 2012 due to a change in financial year-end.Appendix C: Overview of Properties
34
Overview of the Properties
Mapletree Tianjin Mapletree Zhenjiang3 Mapletree Wuxi Mapletree Nantong
Location Tianjin Zhenjiang Wuxi Nantong
NLA 29,148 sq m 101,616 sq m 122,403 sq m 78,624 sq m
East:19 Oct 2064
12 Feb 2065 1 Oct 2066 16 Mar 2064 (c.47 years remaining)
Land Lease
(c.47 years remaining) (c.49 years remaining) (c.46 years remaining) West: 29 Jan 2065
(c.47 years remaining)
Independent
Valuation by RMB105.0 million (S$21.9 million) RMB335.0 million (S$69.8 million) RMB421.0 million (S$87.7 million) RMB262.0 million (S$54.6 million)
Colliers1
Independent
RMB110.0 million (S$22.9 million) RMB330.0 million (S$68.8 million) RMB426.0 million (S$88.8 million) RMB268.0 million (S$55.8 million)
Valuation by JLL1
Committed
100.0% 100.0% 97.1% 88.5%
Occupancy2
No. of Tenants 1 1 15 11
East: Apr 2016
Completion Aug 2016 Feb 2018 Dec 2015
West: Jan 2017
Clear Ceiling Height 9m 9m 9m 9m
1st Floor: 30 kN per sq m
Floor Loading 30 kN per sq m 30 kN per sq m 30 kN per sq m
2nd Floor: 25 kN per sq m
Column Grid 11.4 m by 26.5 m 11.4 m by 23.1 m 11.6 m by 12 m 11.4 m by 30 m
Sinotrans Limited JD.com, Inc. China Post Group Corporation Shanghai Zhengming Modern
Shanghai J-link Supply Chain Logistics Co., Ltd.
Key Tenant(s) Co., Ltd. Sinotrans Limited
Shanghai Dingshi Logistics Co., ZTO Express Co., Ltd.
Ltd.
1) As at 1 March 2018.
2) As at 31 March 2018.
3) As at the Latest Practicable Date, the PRC WFOEs holding Mapletree Wuhan, Mapletree Xi'an, Mapletree Nanchang and Mapletree Zhenjiang are in the process of applying for
the property title certificates in respect of these Properties. The Manager expects the property title certificates in respect of these Properties to be obtained by the second half of
2018.35
Overview of the Properties
Mapletree Changshu Mapletree Jiaxing Mapletree Hangzhou Mapletree Xi’an3
Location Changshu Jiaxing Hangzhou Xi’an
NLA 60,966 sq m 35,683 sq m 106,726 sq m 63,558 sq m
14 Feb 2065 26 Jan 2066 5 Sep 2064 9 Dec 2063
Land Lease
(c.47 years remaining) (c.48 years remaining) (c.46 years remaining) (c.46 years remaining)
Independent
Valuation by RMB197.0 million (S$41.0 million) RMB127.0 million (S$26.5 million) RMB399.0 million (S$83.1 million) RMB286.0 million (S$59.6 million)
Colliers1
Independent
RMB209.0 million (S$43.5 million) RMB130.0 million (S$27.1 million) RMB420.0 million (S$87.5 million) RMB287.0 million (S$59.8 million
Valuation by JLL1
Committed
93.6% 100.0% 100.0% 100.0%
Occupancy2
No. of Tenants 7 1 5 5
Completion Jun 2016 Jun 2017 Jun 2016 Mar 2016
1st Floor: 9.12 m
Clear Ceiling Height 9m 9m 9m
2nd Floor: 9 m
1st Floor: 30 kN per sq m
Floor Loading 30 kN per sq m 30 kN per sq m 20 kN per sq m
2nd Floor: 25 kN per sq m
Column Grid 11.4 m by 21.7 m 12 m by 22.2 m 11.9 m by 11.7 m 11.7 m by 26 m
Adient Yanfeng Seating Best Logistics Technology Cainiao Smart Logistics Network China Deppon Logistics Co., Ltd
Mechanism Co.,Ltd. (China) Co., Ltd. Limited Yue-Shen(Taicang)Footwear
Key Tenant(s) Nissin Corporation Hangzhou Haomusi Food Co., Co.,Ltd
Kunshan Yuan An Logistics Co., Ltd. Shaanxi Zhongyou Health
Ltd. ALOG Technologies Co., Ltd Medicine Co., Ltd
1) As at 1 March 2018.
2) As at 31 March 2018.
3) As at the Latest Practicable Date, the PRC WFOEs holding Mapletree Wuhan, Mapletree Xi'an, Mapletree Nanchang and Mapletree Zhenjiang are in the process of applying for
the property title certificates in respect of these Properties. The Manager expects the property title certificates in respect of these Properties to be obtained by the second half of
2018.36
Overview of the Properties
Mapletree Wuhan3 Mapletree Changsha Mapletree Nanchang3
Location Wuhan Changsha Nanchang
NLA 69,984 sq m 79,253 sq m 73,950 sq m
10 Jun 2065 20 Jun 2064 14 Jan 2066
Land Lease
(c.47 years remaining) (c.46 years remaining) (c.48 years remaining)
Independent
Valuation by RMB243.0 million (S$50.6 million) RMB303.0 million (S$63.1 million) RMB217.0 million (S$45.2 million)
Colliers1
Independent
RMB245.0 million (S$51.0 million) RMB307.0 million (S$64.0 million) RMB224.0 million (S$46.7 million)
Valuation by JLL1
Committed
100.0% 96.5% 100.0%
Occupancy2
No. of Tenants 1 6 5
Completion Oct 2017 Sep 2016 Aug 2017
Clear Ceiling Height 9m 9m 9m
Floor Loading 30 kN per sq m 30 kN per sq m 30 kN per sq m
Column Grid 11.4 m by 24 m 11.4 m by 23.2 m 11.4 m by 28 m
JD.com, Inc. Cainiao Smart Logistics Network SF Express (Group) Co., Ltd.
Limited Cainiao Smart Logistics Network
Key Tenant(s) Hunan Yujia Cosmetics Limited
Manufacturing Co.,Ltd Shenzhen Bestlyn Technology
ZTO Express Co., Ltd. Logistics Co., Ltd.
1) As at 1 March 2018.
2) As at 31 March 2018.
3) As at the Latest Practicable Date, the PRC WFOEs holding Mapletree Wuhan, Mapletree Xi'an, Mapletree Nanchang and Mapletree Zhenjiang are in the process of applying for
the property title certificates in respect of these Properties. The Manager expects the property title certificates in respect of these Properties to be obtained by the second half of
2018.You can also read