Investor Presentation: Proposed Acquisition of Mapletree Business City (Phase 1)
←
→
Page content transcription
If your browser does not render page correctly, please read the page content below
Investor Presentation:
Proposed Acquisition of Mapletree Business City (Phase 1)
July 2016
Disclaimer

This presentation has been prepared by Mapletree Commercial Trust Management Ltd. (as the Manager of Mapletree Commercial Trust (“MCT”, and the manager of MCT, the “Manager”) for the sole purpose of use at
this presentation and should not be used for any other purposes. The information and opinions in this presentation are provided as at the date of this document (unless stated otherwise) are subject to change without
notice, its accuracy is not guaranteed and it may not contain all material information concerning MCT. Neither the Manager, MCT nor any of their respective affiliates, advisors and representatives or any of their
respective holding companies, subsidiaries, affiliates, associated undertakings or controlling persons, or any of their respective directors, officers, partners, employees, agents, representatives, advisers (including any
global co-ordinator and bookrunner in respect of any potential equity fund raising that may be undertaken by the Manager) or legal advisers make any representation or warranty, express or implied and whether as to
the past or the future regarding, and assumes no responsibility or liability whatsoever (in negligence or otherwise) for, the fairness, accuracy, completeness or correctness of, or any errors or omissions in, any
information contained herein or as to the reasonableness of any assumption contained herein or therein, nor for any loss howsoever arising whether directly or indirectly from any use, reliance or distribution of these
materials or its contents or otherwise arising in connection with this presentation. Further, nothing in this document should be construed as constituting legal, business, tax or financial advice. None of the Mapletree
Investments Pte Ltd (the "Sponsor"), MCT, the Manager, DBS Trustee Limited (as trustee of MCT) or their respective subsidiaries, affiliates, advisors, agents or representatives have independently verified, approved or
endorsed the material herein.
The information contained in this presentation includes historical information about and relevant to the assets of MCT that should not be regarded as an indication of the future performance or results of such assets.
This presentation contains forward-looking statements that may be identified by their use of words like “plans”, “expects”, “will”, “anticipated”, “believes”, “intends”, “depends”, “projection”, “estimates” or other words of
similar meaning and that involve assumptions, risks and uncertainties. All statements that address expectations or projections about the future and all statements other than statements of historical facts included in this
presentation, including, but not limited to, statements about the strategy for growth, product development, market position, expenditures, and financial results, are forward-looking statements. Such forward-looking
statements are based on certain assumptions and expectations of future events regarding MCT's present and future business strategies and the environment in which MCT will operate, and must be read together with
those assumptions. The Manager does not guarantee that these assumptions and expectations are accurate or will be realised. Actual future performance, outcomes and results may differ materially from those
expressed in forward-looking statements as a result of a number of risks, uncertainties and assumptions. Although the Manager believes that such forward-looking statements are based on reasonable assumptions, it
can give no assurance that such expectations will be met. Representative examples of these risks, uncertainties and assumptions include (without limitation) general industry and economic conditions, interest rate
trends, cost of capital and capital availability, competition from other companies, shifts in customer demands, customers and partners, changes in operating expenses including employee wages, benefits and training,
governmental and public policy changes and the continued availability of financing in the amounts and the terms necessary to support future business. Predictions, projections or forecasts of the economy or economic
trends of the markets are not necessarily indicative of the future or likely performance of MCT. Past performance is not necessarily indicative of future performance. The forecast financial performance of MCT is not
guaranteed. You are cautioned not to place undue reliance on these forward-looking statements, which are based on the Manager’s current view of future events. No assurance can be given that the future events will
occur or that projections will be achieved. The Manager does not assume any responsibility to amend, modify or revise any forward-looking statements, on the basis of any subsequent developments, information or
events, or otherwise. You should conduct your own independent analysis of the Sponsor, the Manager and MCT, including consulting your own independent legal, business, tax and financial advisers and other advisers
in order to make an independent determination of the suitability, merits and consequences of investment in MCT.
These materials contain a summary only and do not purport to contain all of the information that may be required to evaluate any potential transaction mentioned in this presentation, including the acquisition by MCT of
the office and business park components of Mapletree Business City (Phase 1) as described herein, which may or may not proceed.
The information set out in this presentation is for information only and is not intended to form the basis of any contract. By attending this presentation, you agree that you will not rely on any representation or warranty
implied herein or the information contained herein in any action or decision you may take or make.
This presentation does not constitute or form part of an offer, solicitation, recommendation or invitation for the sale or purchase of securities or of any of the assets, business or undertakings described herein. No part of
it nor the fact of its presentation shall form the basis of or be relied upon in connection with any investment decision, contract or commitment whatsoever.
This presentation is being provided to you for the purpose of providing information in relation to the forthcoming transaction by MCT. Therefore, this presentation is not being distributed by, nor has it been approved for
the purposes of section 21 of the Financial Services and Markets Act 2000 (“FSMA”) by, a person authorised under FSMA. This presentation is being communicated only to persons in the United Kingdom who are (i)
authorised firms under the FSMA and certain other investment professionals falling within article 19 of the FSMA (Financial Promotion) Order 2005 (the "FPO") and directors, officers and employees acting for such
entities in relation to investment; (ii) high value entities falling within article 49 of the FPO and directors, officers and employees acting for such entities in relation to investment; (iii) certified sophisticated investors falling
within article 50 of the FPO; or (iv) persons to whom it may otherwise lawfully be communicated.
Nothing in this presentation constitutes or forms a part of any offer to sell or solicitation of any offer to purchase or subscribe for securities for sale in the United States, the European Economic Area, Japan, Australia,
Singapore or any other jurisdiction. The securities of MCT will not be registered under the U.S. Securities Act of 1933, as amended (the "Securities Act") or under the securities laws of any state or other jurisdiction of
the United States, and may not be offered or sold within the United States except pursuant to an exemption from, or transactions not subject to, the registration requirements of the Securities Act and in compliance with
any applicable state securities laws. The Manager does not intend to conduct a public offering of any securities of MCT in the United States.
Neither this presentation nor any part thereof may be (a) used or relied upon by any other party or for any other purpose, (b) copied, photocopied, duplicated or otherwise reproduced in any form or by any means, or (c)
forwarded, published, redistributed, passed on or otherwise disseminated or quoted, directly or indirectly, to any other person either in your organisation or elsewhere. By attending this presentation, you agree to be
bound by the terms set out above.

                                                                                                                                                                                                                                        11
Table of Contents

  I.    Overview of Mapletree Commercial Trust

  II. Acquisition Overview

  III. Key Acquisition Rationale

  IV. Financing Considerations

  Note: For defined terms not defined herein, please refer to the Circular dated 5 July 2016
                                                                                               22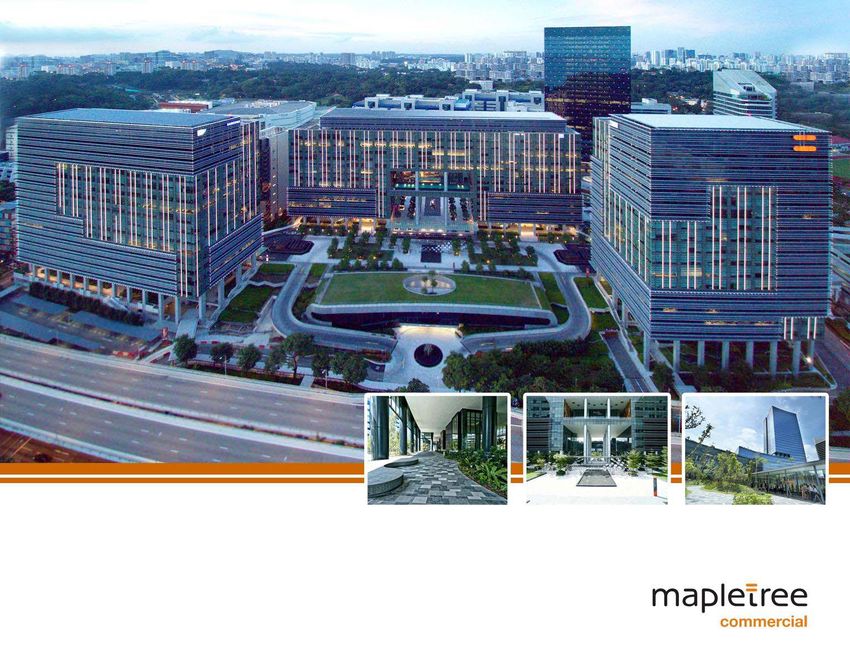
I. Overview of Mapletree Commercial Trust
Overview of Mapletree Commercial Trust (“MCT”)
Mapletree Commercial Trust Public
MIPL
Unitholders
Mapletree Investments Pte Ltd
Sponsor
(“MIPL” or the “Sponsor”)
61.6% 38.4%1
Mapletree Commercial Trust Management
Ltd. (“MCTM” or the “Manager”)
Manager Trustee –
— Wholly-owned subsidiary of the DBS
Sponsor
Sponsor Stake 38.4%1
Investment Mandate
Primarily retail and / or office assets Manager –
in Singapore MCTM
4 properties valued at S$4,341.8 million2
Existing Portfolio
Approximately 2.1 million sq ft NLA Property
Existing Portfolio Manager –
Mapletree Commercial Property MCPM
Management Pte. Ltd. (“MCPM”)
Property Manager VivoCity
— Wholly-owned subsidiary of the
PSA Building
Sponsor
Mapletree Anson
Trustee DBS Trustee Limited (the “Trustee”) Bank of America Merrill Lynch
HarbourFront (“Merrill Lynch
Credit Rating Moody’s – Baa1 (stable) HarbourFront”)
1 As at 17 June 2016, being the Latest Practicable Date of the Circular dated 5 July 2016
2 Based on the appraised valuations by CBRE for PSA Building, Mapletree Anson, and Merrill Lynch HarbourFront as at 31 March 2016, and Knight Frank for VivoCity as at 31 March 2016
44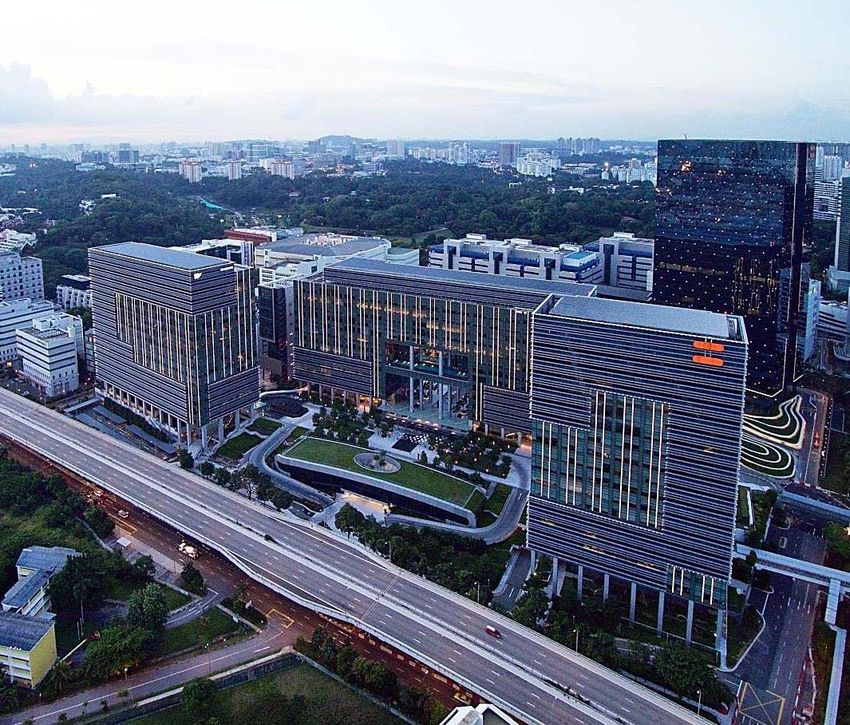
Snapshot of MCT

                 VivoCity                                       PSA Building                                    Mapletree Anson                           Merrill Lynch HarbourFront

                            Key Indicators                                                             At IPO                                              As at 31 March 2016

    NLA (‘000 sq ft)                                                                                   1,6681                          26.8%                          2,115

    Investment Property Value (S$ million)                                                              2,822                          53.9%                          4,342

    Net Asset Value Per Unit (S$)                                                                        0.91                          42.9%                          1.302

    Market Capitalisation (S$ million)                                                                 1,6383                          83.3%                         3,0034

    Free Float (S$ million)                                                                              9495                          94.9%                         1,8506

    Total returns from IPO to end of FY2015/16 (%)                                                         -                                                         100.37

1 Excluding PSAB asset enhancement which was deemed to have an expected NLA of 102,505 sq ft at the time of IPO
2 Net Asset Value Per Unit is S$1.28 post adjustment for the cash distribution paid on 3 June 2016 in relation to the distributable income for the period from 1 January 2016 to 31 March 2016
3 Based on IPO Price of S$0.88 per unit and 1,861 million units in issue
4 Based on Unit price of S$1.41 as at 31 March 2016
5 Market capitalisation at IPO less the proportion deemed to be held by the Sponsor
6 Market capitalisation on 31 March 2016 less the proportion deemed to be held by the Sponsor
7 Comprises 60.2% in capital appreciation gains based on IPO Price of S$0.88 and Unit Price of S$1.41 at close of trading on 31 March 2016, and 40.1% in distribution gains based on total distributions

  paid out of 35.26 Singapore cents, including DPU paid for 4Q FY2015/16                                                                                                                               55
Financial Profile

                                                                Track Record of Growing Distributions

 Net Property Income (S$ million)1                                                                    Distribution per Unit (Singapore cents)1

                                                                                220.7                                                                                8.00              8.13
                                                               211.7
                                                                                                                                                  7.37
                                              195.3
                                                                                                                                6.49

                              156.0
                                                                                                             5.272
            124.02

         FY2011/12 FY2012/13 FY2013/14 FY2014/15 FY2015/16                                               FY2011/12         FY2012/13          FY2013/14         FY2014/15          FY2015/16

Source: MCT Filings
1 For the period from 1 April to 31 March for FY2012/13 to FY2015/16
2 For the period from Listing Date of 27 April 2011 to 31 March 2012
3 Compounded annual growth rate from FY2011/12 (restated) to FY2015/16. FY2011/12 (restated) figures are restated from the period from Listing Date to 31 March 2012 to the full period from

  1 April 2011 to 31 March 2012, for a comparable basis in terms of CAGR calculation
                                                                                                                                                                                               66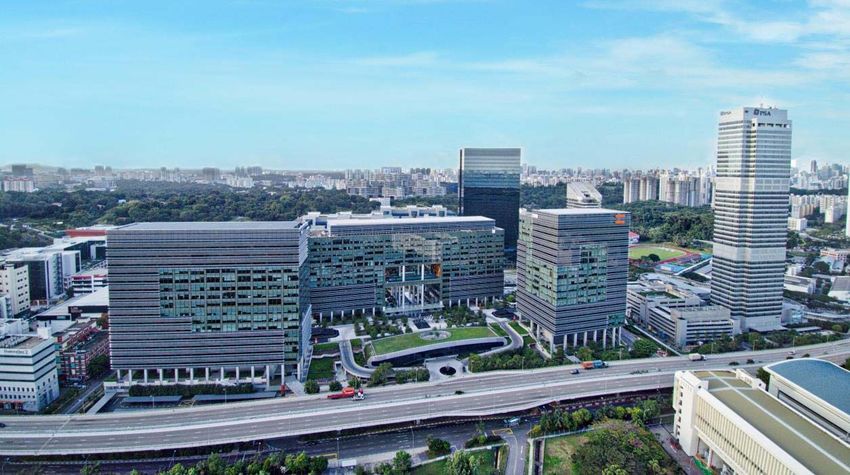
II. Acquisition Overview
MCT’s Second Acquisition Since IPO
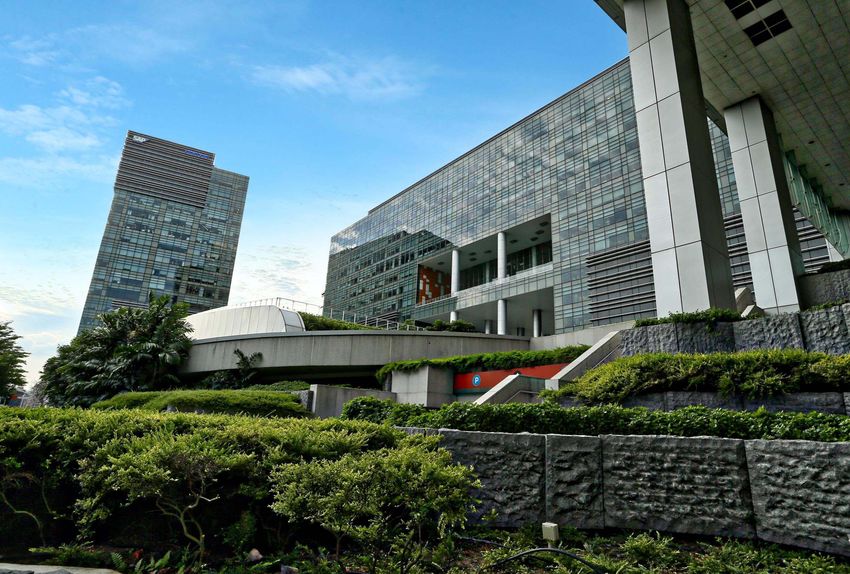
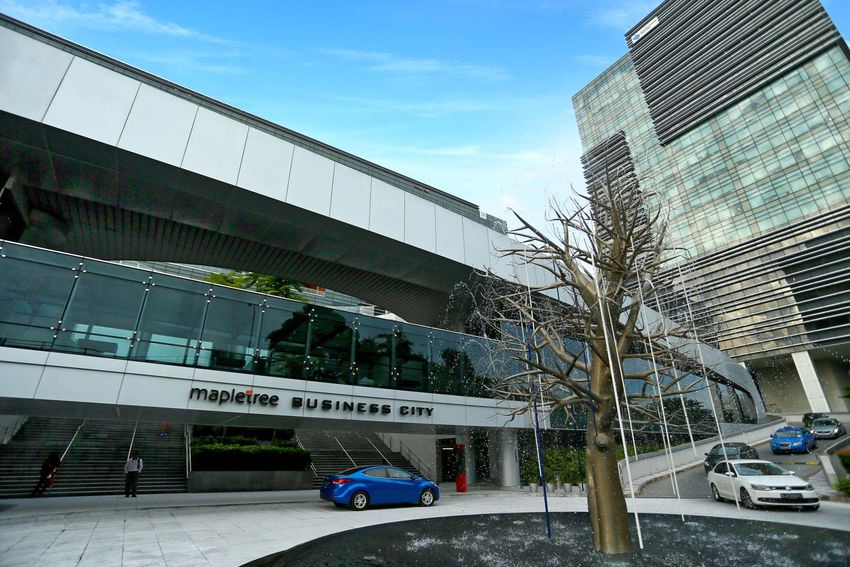
Office and Business Park Components of Mapletree Business City (Phase 1) (the “Property”)
9 Premier office and business 9 Strong and diverse tenant Overview of the Property
park space base
Strata Lease over level two to the rooftop of four blocks of
9 Close proximity to the CBD 9 High occupancy rates office and business park space
9 Grade-A building 9 Favourable and defensive of Mapletree Business City (Phase 1), namely:
specifications lease profile The Property
— Office tower (MBC 10)
— Three business park blocks (MBC 20W,
MBC 20E and MBC 30)
Building
April 2010
Completion
S$1,780.0 million (~S$1,042 psf of NLA)
Purchase — Office: S$571.9 million1 (S$1,359.9 psf of NLA)
Consideration — Business Park: S$1,208.1 million1 (S$938.2 psf of
NLA)
Tenure of Leasehold for a term commencing from Completion Date
Strata Lease up to and including 29 September 2096
1,708,218 sq ft
NLA2 — Office: 420,544 sq ft
— Business Park: 1,287,674 sq ft
S$5.94 psf per month
Average
— Office: S$6.14 psf per month
Passing Rent1
— Business Park: S$5.88 psf per month
Occupancy 97.8%3
WALE2 Approximately 3.5 years
1Derived by applying the same percentage value contribution of the office component and the business park component of the average of the independent valuations by DTZ and Knight Frank
as at 31 May 2016
2 As at 30 April 2016 88
3 Actual occupancy as at 30 April 2016. As at 17 June 2016, being the Latest Practicable Date of the Circular, the committed occupancy for the Property is 99.0%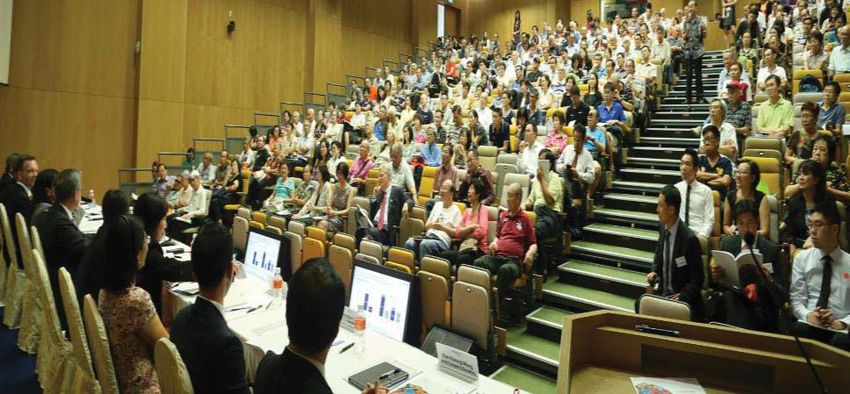
MCT’s Portfolio Location

                                                                                                     10-minute
                                                                                                 drive from Central
                                                                                                 Business District
                                                                                                                                  Mapletree Anson

                                                                                                                                  Singapore
                                                           Merrill Lynch
                                                                                                                               Southern Corridor
  (The Property)                 PSA Building              HarbourFront                  VivoCity

            Circle Line                  East-West Line           North-South Line              North-East Line             Downtown Line

                     Major Expressways           MRT Station          Existing MCT Properties                The Property

                                                                                                                                                    99
Purchase Price at Discount to Valuation
Purchase Consideration Relative to Independent Valuations1 Total Acquisition Cost (S$ million)
(S$ million)
Valuation 1,858.5
~1,072 ~1,067 ~1,042
(S$ psf NLA) Estimated Professional
16.2
Fees and Expenses2
1,832.0 53.4 Stamp Duty3
1,822.0
8.9
1,780.0 Acquisition Fees
2.8% 2.3% Paid in Units4
discount discount (0.5% of Purchase
Consideration)5
Property Purchase
Consideration
1,780.0
DTZ Knight Frank Purchase Total Acquisition
Valuation Valuation Consideration Cost
(31 May 2016) (31 May 2016)
1The Manager has commissioned DTZ and the Trustee has commissioned Knight Frank to value the Property as at 31 May 2016
2 Professional and other fees and expenses incurred or to be incurred by MCT in connection with the Acquisition (inclusive of the equity funding-related expenses and debt funding-related expenses)
3 Based on 3.0% of the Purchase Consideration
4 As the Acquisition will constitute an "interested party transaction" under the Property Funds Appendix, the Acquisition Fee will be payable in the form of Units, which shall not be sold within one year of
the date of issuance, in accordance with Paragraph 5.7 of the Property Funds Appendix
5 Under the Trust Deed, the Manager is entitled to be paid an Acquisition Fee at the rate of 1.0% of the Purchase Consideration
10
10Enlarged Portfolio and Net Property Income (“NPI”)
Increase in NPI and NPI Yield Post-Acquisition
Existing Portfolio The Property Enlarged Portfolio Growth
Key Financials for the Forecast Period (S$ million)
(6-month period from 1 October 2016 to 31 March 2017)
Gross Revenue 153.9 61.6 215.5 40.0%
Property Operating Expenses (37.5) (11.7) (49.2) 31.2%
Net Property Income 116.5 49.7 166.2 42.7%
Historical FY2015/16
NPI Yield 5.1%1 5.6%2 5.2%3
1 Based on FY2015/16 NPI over the valuation of the Existing Portfolio as at 31 March 2016
2 Based on FY2015/16 NPI for the Property over the Purchase Consideration of S$1,780 million. NPI based on the Vendor’s unaudited financial information on the Property for the period from 1 April
2015 to 31 March 2016 after deducting the property management fees, as if the Property was held and operated by MCT throughout the period
3 Based on FY2015/16 NPI of the Enlarged Portfolio over the valuation of the Existing Portfolio as at 31 March 2016 and Purchase Consideration of the Property of S$1,780.0 million
11
11Positive Accretion Without Income Support
DPU and NAV Accretive
DPU for the Forecast Period (Singapore cents)1 NAV per Unit (S$)3
(6-month period from 1 October 2016 to 31 March 2017)
4.27
Annualised 1.31
DPU Yield
4.14 of 6.1%2
1.28
Annualised
DPU Yield
of 5.9%2
Existing Portfolio Enlarged Portfolio Existing Portfolio Enlarged Portfolio
1 Assuming a drawdown of S$860.0 million from the Loan Facilities, gross proceeds of S$989.6 million raised from the Equity Fund Raising, the issuance of the New Units and Acquisition Fee Units at
the Illustrative Issue Price of S$1.40, the issue date of the New Units and Acquisition Fee Units is 1 October 2016, and completion of the Acquisition on 1 October 2016
2 Based on the Illustrative Issue Price of S$1.40. The annualised DPU for the Forecast Period may not reflect actual performance over a one-year period
3 As at 31 March 2016 assuming the Acquisition was completed on 31 March 2016. NAV has been adjusted for the cash distribution paid on 3 June 2016 in relation to the distributable income for the
period from 1 January 2016 to 31 March 2016
4 Accretion based on actual numbers and does not take into account the impact from rounding
12
12Key Acquisition Rationale
• Strategic Addition of a Property in a Large-Scale, Integrated
1 Business Hub
2 • Increased Exposure to a Resilient Office Micro-Market
3 • Exposure to the Stable and Growing Business Park Segment
4 • Stable and Quality Cash Flows
5 • Attractive Valuation Characteristics
6 • Positive Impact on the Enlarged Portfolio
13
13III. Key Acquisition Rationale
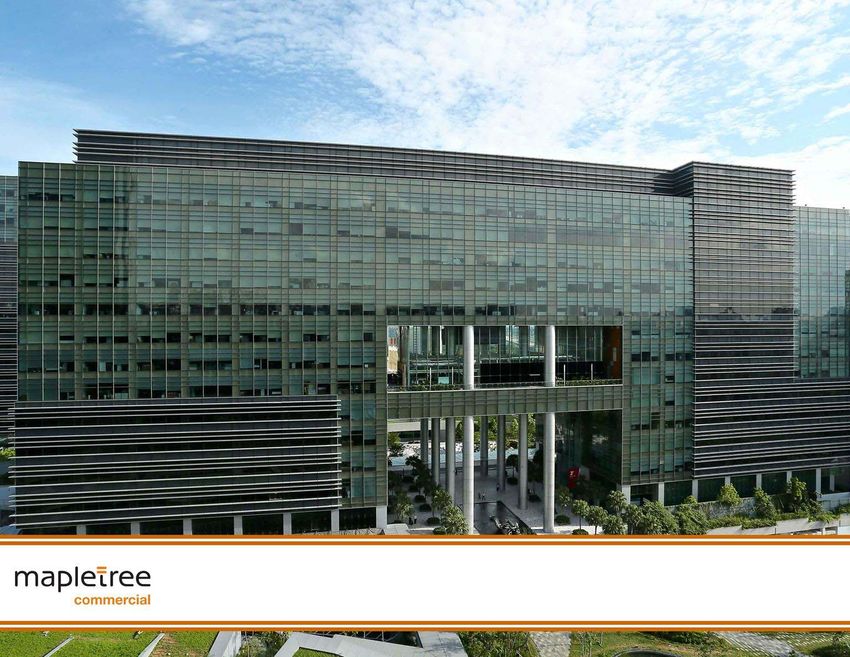
1 Strategic Addition of a Property in a Large-Scale,
Integrated Business Hub
One of the Largest Integrated Office and Business Park Complexes in Singapore with Excellent Connectivity
~10 minute drive from the CBD
(The Property)
Connected via major expressways (Ayer
Rajah Expressway, Marina Coastal
Expressway, West Coast Highway)
Accessible by bus services on Pasir Panjang
Road and Alexandra Road
Extensive direct bus services to the Property
Prominent frontage along Pasir Panjang Road with excellent transport connectivity
Strategic location in close proximity to the CBD
Directly linked via covered walkways to the Labrador Park MRT Station and other 4 MRT stops away from the CBD1
transportation nodes
Labrador Park MRT Station is connected via
Attracts tenants who do not require a CBD location for their operations, but covered walkways
would still like to enjoy proximity to the CBD
1 Four stops to Tanjong Pagar MRT Station
15
151 Strategic Addition of a Property in a Large-Scale,
Integrated Business Hub
Quality Grade-A Building Specifications
Floor Plate Size (‘000 sq ft) Floor-to-Ceiling Height (metres)
23 – 68
3.2 3.2
2.8 2.9
32 – 35 Grade-A Criteria:
2.75 metres
21 22
Grade-A Criteria:
15,000 sq ft
The Property MBFC T1 CapitaGreen Asia Square T1 The Property MBFC T1 Asia Square T1 CapitaGreen
The Property MBFC T1 Asia Square T1 CapitaGreen
Year of Completion 2010 2010 2011 2014
NLA (sq ft) 1,708,218 620,000 1,250,000 703,000
No. of Floors 14 – 18 33 43 40
Typical Floor Plate (‘000 sq ft) 23 – 68 21 32 – 35 22
Floor to Ceiling Height (metres) 3.2 2.8 2.9 3.2
No. of Carpark Lots 1,040 438 313 180
BCA Green Mark Platinum Gold Platinum Platinum
Source: CBRE
16
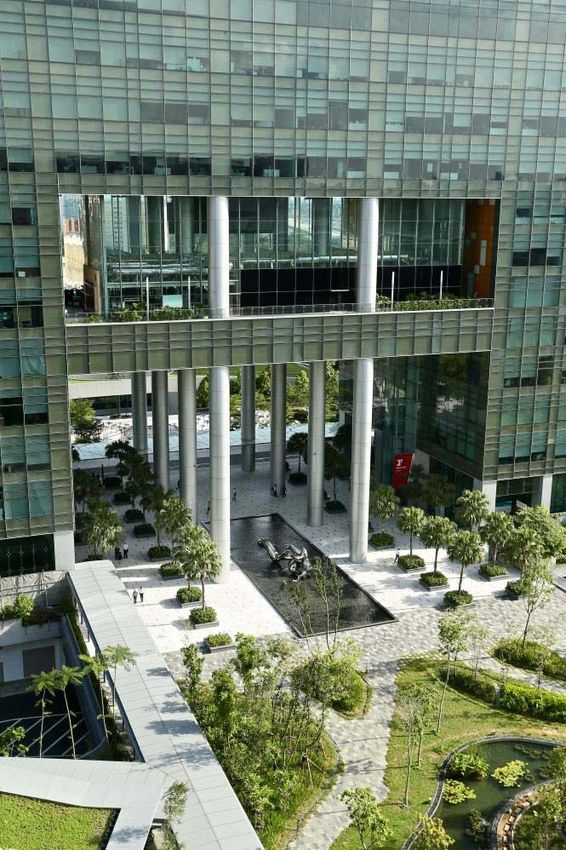
161 Strategic Addition of a Property in a Large-Scale,
Integrated Business Hub
One of the Newest Developments with Green Mark Platinum Certification
Large, highly efficient and column-free floor
plates
High quality finishes for common areas
Modern building management systems
Higher carpark lot ratio than most CBD offices
BCA Green Mark Platinum certified
— Eco-friendly and energy saving features
highly sought after by quality tenants and
MNCs
Numerous local and international
awards, including:
— FIABCI Prix d'Excellence Awards
(Sustainable Development Category)
— MIPIM Asia Awards – Top 3 Green Buildings
17
171 Strategic Addition of a Property in a Large-Scale,
Integrated Business Hub
Full Suite of “Work and Play” Amenities
Modern conference facilities
294-seat auditorium
On-site gym with a 44 metre-long heated pool
Complementary range of F&B establishments
1,040 sheltered carpark lots Multi-Purpose Hall
Sporting facilities such as an outdoor running track, futsal and
basketball courts
Garden amphitheatre for arts events and performances
Directly linked via a covered walkway to ARC which has a wide
range of F&B establishments, retail outlets, service trades as well
as a supermarket Sporting Facilities Heated Pool
F&B Establishments Covered Walkway
18
182 Increased Exposure to a Resilient Office Micro-Market
Historical Resilience in Rents Absence of New Supply to Support Demand
Singapore Office Rents Singapore Office Vacancy Rates2
Q1’16
12 YoY
Change
11
9.9
10 -13.2% 5.0%
Rents (S$ psf pm)
4.5%
9
8.0 3.8%
8 -7.6%
7 -7.4%
7.3
6
5
4
Q1 2011 Q1 2012 Q1 2013 Q1 2014 Q1 2015 Q1 2016 Grade-A Core CBD Grade-B Core CBD Prime Alexandra /
HarbourFront Basket¹
Grade-A Core CBD
Grade-B Core CBD
Prime Alexandra / HarbourFront Basket¹
Source: CBRE
1 Refer to Independent Market Research Report by CBRE for more details
2 As at 31 March 2016
19
192 Increased Exposure to a Resilient Office Micro-Market
Cost-efficient Alternative to Core CBD Office
Grade-A Core CBD Office Rent Comparison Grade-B Core CBD Office Rent Comparison
~28.8%1 Discount to ~8.5%1 Discount to
Grade-A Core CBD Office Grade-B Core CBD Office
12 40% 9 16%
10.5 35% 14%
11
30% 8.0 8.1 12%
9.9
Rents (S$ psf pm)
Rents (S$ psf pm)
10 8
25% 10%
Discount %
Discount %
7.3 7.5
9 20% 8%
15% 6%
8 7.5 7
7.3 10% 4%
7
5% 2%
6 0% 6 0%
Q1 Q1 Q1 Q1 Q1 Q1 2016E 2017E 2018E 2019E Q1 Q1 Q1 Q1 Q1 Q1 2016E 2017E 2018E 2019E
2011 2012 2013 2014 2015 2016 2011 2012 2013 2014 2015 2016
Discount to Grade-A Core CBD (RHS) Discount to Grade-B Core CBD (RHS)
Grade-A Core CBD Rents (LHS) Grade-B Core CBD Rents (LHS)
Prime Alexandra / HarbourFront Basket Rents² (LHS) Prime Alexandra / HarbourFront Basket Rents² (LHS)
Source: CBRE
1 Based on average discount of rents of Prime Alexandra / HarbourFront Basket to rents of Grade-A Core CBD offices and Grade-B Core CBD offices in the four quarters ended 31 March 2016
2 Refer to Independent Market Research Report by CBRE for more details
20
203 Exposure to the Stable and Growing Business Park
Segment
Demand Support from Growing Trend of CBD Tenant Relocations
Relocation trends tend to be driven by: Examples of Tenant Relocations to Mapletree Business City
Company Industry Relocated From
— Cost savings
The Concourse and
American Express Banking and Finance
Chevron House
— Consolidation from multiple locations BrightOil Oil and Gas Suntec City
BW Offshore / Maritime Oil and Gas AXA Tower
— Flight to quality relocation from older
Covidien3 Healthcare Services Vision Crest (Dhoby Ghaut)
developments
Google3 IT Services Asia Square Tower
HSBC Banking and Finance Multiple Locations
Infocomm Development
Government Related Suntec City & Eightrium
Authority of Singapore (IDA)
Approximately 78.0%1 Nike Apparels Suntec City & Eightrium
of the Property’s current Novartis Healthcare Services Keppel Tower
tenant base relocated from the
SAP IT Company IT Services Multiple Locations
"Central Area2”
Samsung Electronics Samsung Hub
Unilever Consumer Products UE Square and Vision Crest
Source: CBRE
1 By NLA
2 As defined by the Urban Redevelopment Authority
3 Tenant movements to Mapletree Business City (Phase 2), which is not part of the Property
21
213 Exposure to the Stable and Growing Business Park
Segment
The Business Park Closest to Singapore’s CBD
10-minute drive
Major Expressways CBD Business Parks The Property
22
223 Exposure to the Stable and Growing Business Park
Segment
Stable Rents and Limited Competing New Supply Island-wide
Business park rents historically more stable (S$5.25 – 5.50 psf pm since 20121) compared to traditional office assets
City fringe business parks command average rental premiums of approximately 44%2 over rest of island-wide
— Higher rents may be attributed to the profile of tenants who are attracted by the Grade-A building specifications and
proximity to the CBD
No visible new supply beyond 2016 and expected until 2020 to provide demand support3
Singapore Business Park Rents (S$ psf pm)
6.0 S$ 5.884
5.5 for the
5.50 5.50 Property
5.0 5.35 5.30 5.40 5.40 5.40 5.40
5.25
5.05 5.05
4.5
4.0
3.5 3.80 3.85 3.85
3.70 3.60 3.70 3.65 3.70 3.65 3.65 3.65
3.0
Q1 2011 Q1 2012 Q1 2013 Q1 2014 Q1 2015 Q1 2016
City Fringe Business Park Islandwide Business Park
Source: CBRE
1 Range for City Fringe Business Parks only
2 Average since 2011
3 New business parks require an average of three to four years for development. All planned future business park supply is due for completion in 2016, of which approximately 60.2% will be from
Mapletree Business City (Phase 2)
4 Average passing rent as at 30 April 2016 for the business park component of the Property
23
234 Stable and Quality Cash Flows
Beneficiary of Decentralisation and Flight to Quality Trends
Rents (S$ psf per month)
Cost-efficient Alternative to Core CBD Stable Rents
Stable historical range
(S$5.25 – 5.50 psf pm
since 2012)
9.901
8.001
6.142 5.882
5.401
Grade-A Grade-B The Property The Property City Fringe
Core CBD Core CBD (Office Component) (Business Park Component) Business Park
Source: CBRE
1 As at 31 March 2016
2 Average passing rent as at 30 April 2016
24
244 Stable and Quality Cash Flows
High Occupancy Backed By Strong “Office-like” Tenants
Historical Occupancy (%) Tenant Breakdown by Trade Sector2
99.1% 100.0% 100.0% 99.0%1
4% 4%
5% 24%
31-Mar-14 31-Mar-15 31-Mar-16 Committed
Occupancy 6%
6% % of
29 High Quality Tenants in Total Gross Rental
Income
% of Gross 10% 14%
Top 10 Tenant Names Rental Income2
The Hongkong and Shanghai Banking Corporation Limited 11.6%
Info-Communications Development Authority of Singapore 8.4% 13%
14%
Samsung Asia Pte. Ltd. / Samsung Electronics Asia
8.0%
Holding Pte. Ltd.
Unilever Asia Pte Ltd 7.7%
SAP Asia Pte Ltd 7.7%
BW Maritime Pte Ltd / BW Offshore Singapore Pte. Ltd. 6.4% Banking & Financial Services Government Related
Nike Trading Company B.V. Singapore Branch 5.6% Electronics Consumer Goods
Singapore Power Limited3 5.5%
IT Services & Consultancy Shipping Transport
Deutsche Bank Aktiengesellschaft 4.6%
Mapletree Investments Pte Ltd 4.1% Pharmaceutical Others
Total 69.6% Real Estate Energy
1 As at 17 June 2016, being the Latest Practicable Date of the Circular. Actual occupancy is 97.8% as at 30 April 2016
2 As at 30 April 2016
3 On 3 June 2016, Singapore Power Limited and Mapletree Business City Pte. Ltd. entered into a letter of agreement in relation to the SP Tenancy Agreement. See Circular for further details
25
254 Stable and Quality Cash Flows
Favourable and Defensive Lease Profile Further Enhances Income Stability and Organic Growth
Lease Expiry Profile1
Beneficial lease expiry profile
Property WALE of — No significant office expiries over
approximately 3.5 years1 next 3 years
37.0%2 — Lack of new supply of business
parks between 2017 and 2020
High tenant retention rate
21.4%
16.3%2 — 85.6%3 for leases expiring in FY2015/16
5.5% 12.3%
— Substantial capital expenditure made by
4.0% 4.6% 4.4% existing tenants
10.8%
Long-tenured leases – 88.0%1 with original
FY2016/17 FY2017/18 FY2018/19 FY2019/20 FY2020/21 and tenures of 5 to 10 years
Beyond
Office Component Business Park Component 97.5%1 of leases have average built-in
annual rental step-ups of ~3%
1 By Gross Rental Income as at 30 April 2016
2 As at the Latest Practicable Date, an additional lease was renewed, lowering the FY2016/17 lease expiry as a % of Gross Rental Income from 16.3% to 10.8%. The renewed lease expires in
FY2020/21 and beyond
3 Based on NLA for leases expiring in the year ended 31 March 2016
26
265 Attractive Valuation Characteristics
(Office Component)
Valuation Compares Favourably to CBD and Decentralised Offices
Office Comparable Benchmarking (S$ psf of NLA)
2,7005
2,1645
1,6574
1,3601 1,4142,3 1,4502
Purchase Consideration PSA Building Merrill Lynch Decentralised CBRE Grade-B CBRE Grade-A Core
(Office Component) HarbourFront Office Transactions Valuations CBD Average
Alexandra / HarbourFront
Comparables
(Existing Portfolio)
Source: CBRE
1 Based on the average of the independent valuations for the office component of the Property, which is S$587.0 million for DTZ and S$587.0 million for Knight Frank, as at 31 May 2016. Derived by
applying the same percentage value contribution of the office component of the average of the independent valuations by DTZ and Knight Frank as at 31 May 2016
2 Based on the appraised valuation by CBRE as at 31 March 2016
3 Includes retail component
4 Based on average valuation psf of NLA for decentralised office transactions. Refer to Independent Market Research Report by CBRE for more details
5 Refer to Independent Market Research Report by CBRE for more details
27
275 Attractive Valuation Characteristics
(Business Park Component)
Attractive Valuation Metrics Compared to Other Business Park Assets
Gross Yield (%)
7.6%1
5.9%
Purchase Consideration Business Park
(Business Park Component) Comparable Basket³2
Valuation psf of NLA (S$) 938 775
Average Remaining Land Tenure (years) 80 52
Source: CBRE
1 Based on the annualised Gross Revenue of the business park component of the Property for the Forecast Period from 1 October 2016 to 31 March 2017, and the Purchase Consideration for the
business park component of the Property, which is derived by applying the same percentage value contribution of the business park component of the average of the independent valuations by DTZ
and Knight Frank as at 31 May 2016. Gross yield is 7.4% if based on the average of the independent valuations
2 Refer to Independent Market Research Report by CBRE for more details
28
286 Positive Impact on the Enlarged Portfolio
Reduction of Concentration Risk by Property and Asset Class
Pre-Acquisition Post-Acquisition
7.2%
29.6% VivoCity
15.9%
PSA Building
Valuation
42.1%
S$4,341.8 Mapletree Anson
S$6,168.8
million million1 Merrill Lynch HarbourFront
59.8%
17.1% The Property
5.1%
11.2%
12.0%
6.8%
10.9% 31.1%
VivoCity
45.4% PSA Building
NPI
S$220.7 S$320.2
16.4% Mapletree Anson
million million2
Merrill Lynch HarbourFront
65.9% 4.7% The Property
7.5%
11.3%
1 Based on the valuation of the Existing Portfolio as at 31 March 2016 and the average of the independent valuations by DTZ and Knight Frank for the Property as at 31 May 2016
2 FY2015/16 pro forma
29
296 Positive Impact on the Enlarged Portfolio
Increase in Free Float and Liquidity
Market Capitalisation and Free Float (S$ million)
3,9862
2,9881 Increased free float
2,456
(61.6%)3
Improved trading liquidity
1,841
(61.6%)3
Improved index representation
1,530
1,147 (38.4%)3
(38.4%)3
Pre-Acquisition Post-Acquisition
Sponsor Stake Free Float
1 Based on 2,134.3 million Units in issue as at the Latest Practicable Date and the Illustrative Issue Price of S$1.40 per Unit
2 Based on 2,134.3 million Units in issue as at the Latest Practicable Date and the issue of 713.2 million new Units and Acquisition Fee Units
3 Assuming, for illustrative purposes, the Sponsor's ownership percentage in MCT remained constant before and after the Acquisition
30
30IV. Financing Considerations
Acquisition Financing
Acquisition to be Funded by Combination of Debt and Equity
Total Aggregate Leverage (%)
S$1,858.5 million inclusive of transaction costs
Acquisition
and Acquisition Fee paid in Units
Cost Equity Fund
Raising Size 989.61 929.12
(S$ million)
Proposed issue of up to 795.0 million New Units
39.4%3
The Equity Fund Raising may comprise: 38.4% 3
Equity — A private placement of New Units to
Fund institutional and other investors; and / or 35.1%
Raising
— A non-renounceable preferential offering of
New Units to the existing Unitholders on a
pro rata basis
MCT has been granted Loan Facilities of up to
Current Pro Forma Pro Forma
S$920.0 million Assuming Assuming
Debt
Loan Drawdown of Loan Drawdown of
Financing 2 / 4 / 6-year term loan facilities S$860 million S$920 million
Assumed interest cost of 3.25% per annum
As at 31 March 2016
1 At the Illustrative Issue Price of S$1.40 per Unit, approximately 713.2 million new Units will be issued in connection with the Acquisition (comprising approximately 706.8 million New Units to be issued
in relation to the Equity Fund Raising and approximately 6.4 million Acquisition Fee Units). Final amount of equity to be raised and issue price to be decided closer to the Equity Fund Raising, having
regard to the then prevailing market conditions and other factors
2 At the Illustrative Issue Price of S$1.40 per Unit, approximately 670.0 million new Units will be issued in connection with the Acquisition (comprising approximately 663.6 million New Units to be issued
in relation to the Equity Fund Raising and approximately 6.4 million Acquisition Fee Units)
3 Based on MCT’s aggregate leverage as at 31 March 2016 adjusted for the drawdown of the Loan Facilities and the increase in Deposited Property post completion of the Acquisition
32
32Pro Forma Debt Maturity Profile (Post-Acquisition)
No More than 21% of Total Debt Expiring in Any One Year
Debt Maturity Schedule (S$ million)
Pre-Acquisition Total Debt : S$1,550.5 million
Post-Acquisition Total Debt : S$2,410.5 million 486.7
447.6 467.4
439.3
336.7
286.7 286.7
185.5 447.6 439.3
286.7
185.5 47.4 180.7 200.0
47.4 50.0
FY2016/17 FY2017/18 FY2018/19 FY2019/20 FY2020/21 FY2021/22 FY2022/23
Existing¹ Acquisition²
% of Debt Maturing
Pre-Acquisition 12.0% 3.1% 3.2% 28.9% 11.6% 28.3% 12.9%
Post-Acquisition 7.7% 2.0% 13.9% 18.6% 19.4% 18.2% 20.2%
1 As at 26 April 2016, based on last reported debt breakdown as disclosed in MCT filings
2 Assuming that the Acquisition is completed on 26 April 2016 and a drawdown of S$860.0 million from the two-year, four-year, and six-year term loan facilities in almost equal proportion
33
33Approval Sought
Proposed Acquisition of Mapletree Business City (Phase 1) (Ordinary Resolution)
Key Benefits to Unitholders
1 • Attractive Valuation
2 • Stable and Quality Cash Flows
3 • Increase in NPI and NPI Yield Post-Acquisition
4 • DPU and NAV Accretive to Unitholders Without Income Support
• Reduction of Concentration Risk by Property Class and Asset
5 Class
6 • Increase in Free Float and Liquidity
34
34MCT After the Acquisition
Enlarged Asset Size of S$6.1 billion1
VivoCity PSA Building
S$2,597.0 million2 S$740.8 million3
Mapletree Anson Merrill Lynch HarbourFront
The Property: S$1,780.0 million4
S$690.0 million3 S$314.0 million3
1 Based on the valuation of the Existing Portfolio as at 31 March 2016 and Purchase Consideration of the Property of S$1780.0 million
2 Valuation by Knight Frank as at 31 March 2016
3 Valuation by CBRE as at 31 March 2016
4 Based on Purchase Consideration of the Property
35
35The Proposed Whitewash Resolution
The SIC has Granted the Whitewash Waiver
Pre-Acquisition Post-Acquisition3
Purpose of the Whitewash Resolution is to permit the Sponsor
to be diluted in a potential Private Placement, and then
subsequently subscribe for units under a Preferential Offering1 Issued Units 2,134,250,876 2,847,432,124
Without a Whitewash Resolution, the Sponsor could technically
No. of Units held
violate the “creep rules” given the time gap between the by the Concert 834,586,104 1,115,320,993
completion of a Private Placement and a Preferential Offering2 Party Group4
— Sponsor’s percentage unitholding immediately after No. of Units held
by Unitholders, other
the Equity Fund Raising (excluding the Acquisition Fee 1,299,664,772 1,732,111,131
than the Concert
Units to be issued) will be equal to or lower than its Party Group5
percentage unitholding immediately prior to the Equity
Fund Raising % of issued Units
held by the Concert 39.10% 39.17%
Party Group4
The SIC has on 30 June 2016 granted a waiver of the
requirement by the Sponsor to make a Mandatory Offer
% of Units held
by Unitholders, other
60.90% 60.83%
— Waiver granted is subject to Unitholder approval of the than the Concert
Whitewash Resolution Party Group5
1 The Whitewash Resolution is to enable the Sponsor to (i) accept, or procure the acceptance, in full of the provisional allocation of New Units under the Preferential Offering based on its entitlement;
and (ii) (subject to approval of the Whitewash Resolution by Independent Unitholders) apply for the Sponsor Excess Units, so that if it is fully allotted the Sponsor Excess Units, it would maintain its
percentage unitholding at the level immediately prior to the Equity Fund Raising
2 Pursuant to Rule 14.1(b) of the Code, except with the consent from the SIC, where any person who, together with persons acting in concert with him, holds not less than 30.0% but not more than
50.0% of the voting rights and such person, or any person acting in concert with him, acquires in any period of six months additional Units carrying more than 1.0% of the voting rights, such person
must extend offers immediately, on the basis set out in Rule 14 of the Code, to the holders of Units
3 Assuming gross proceeds of S$989.6 million raised from the Equity Fund Raising and the issuance of the New Units and Acquisition Fee Units at the Illustrative Issue Price of S$1.40. Assumes Concert
Party Group subscribes to its pro rata entitlement under the Preferential Offering and Sponsor is allotted in full its application for the Sponsor Excess Units
4 Concert Party Group refers to the Sponsor, the Manager and the parties acting in concert with them
5 Unitholders other than the Concert Party Group and parties not independent of them
36
36Summary of Approvals Required and Timetable
IFA is of the Opinion that the Acquisition is Based on Normal Commercial Terms
and Not Prejudicial to the Interests of MCT and the Minority Unitholders
Resolution 1: The Proposed Acquisition of the Property as an Interested Person Transaction
Resolution 2: The Proposed Issue of up to 795.0 million New Units under the Equity Fund Raising
Approvals Sought Resolution 3: The Whitewash Resolution for the Right of Independent Unitholders to Receive a
Mandatory Offer from the Concert Party Group for all the Remaining Units not already Owned or
Controlled by the Concert Party Group
All three resolutions are inter-conditional
Last Date and Time
for Lodgement of 22 July 2016 (Friday) at 3:00 pm
Proxy Forms
25 July 2016 (Monday) at 3:00 pm or immediately following the conclusion or adjournment of the AGM
to be held at 2:30 pm on the same day
Date, Time and
Place of EGM
10 Pasir Panjang Road, Mapletree Business City, Town Hall (formerly known as Multipurpose Hall) –
Auditorium, Singapore 117438
37
37You can also read